Random Sampling
In statistics, we often cannot survey an entire population. Instead, we study a sample, which is a smaller group selected from the population.
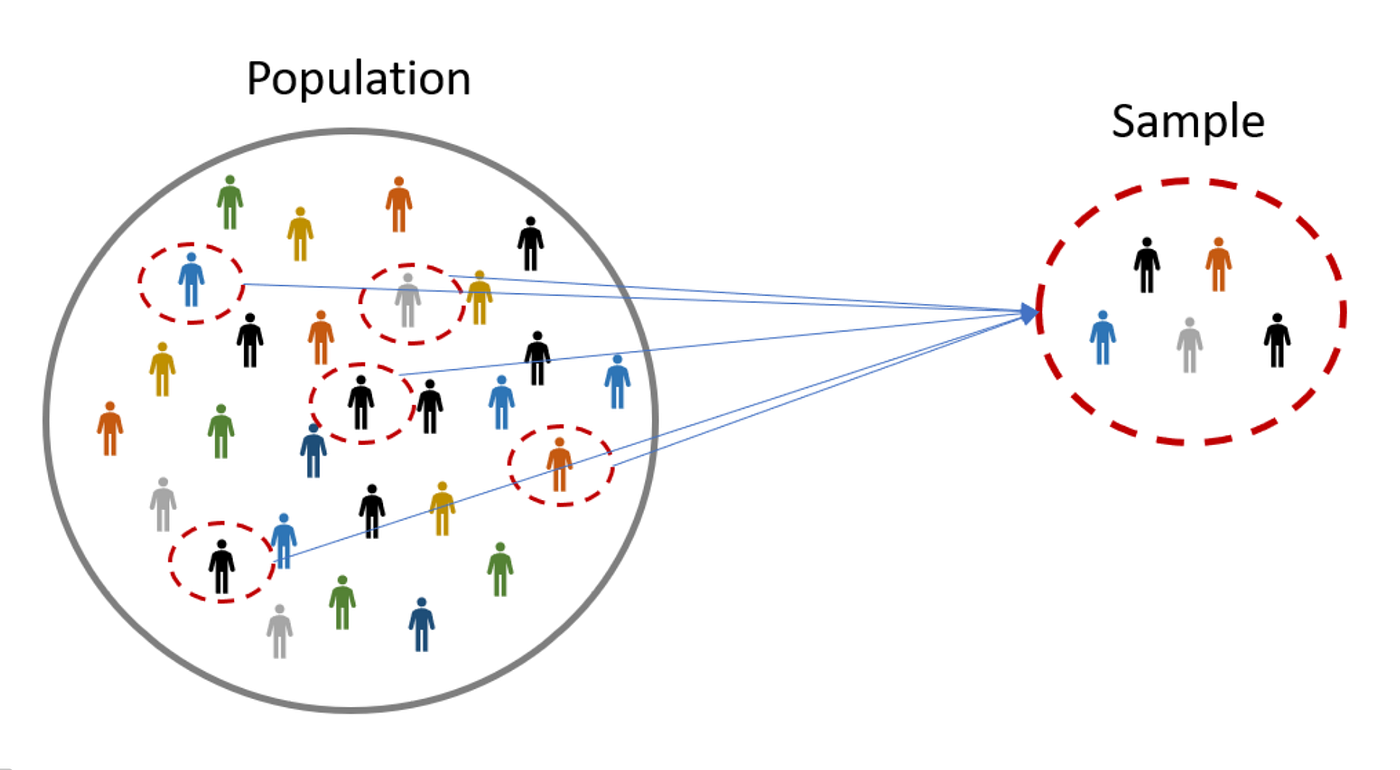
The goal is for the sample to represent the population accurately. This is achieved through random sampling.
Population vs Sample
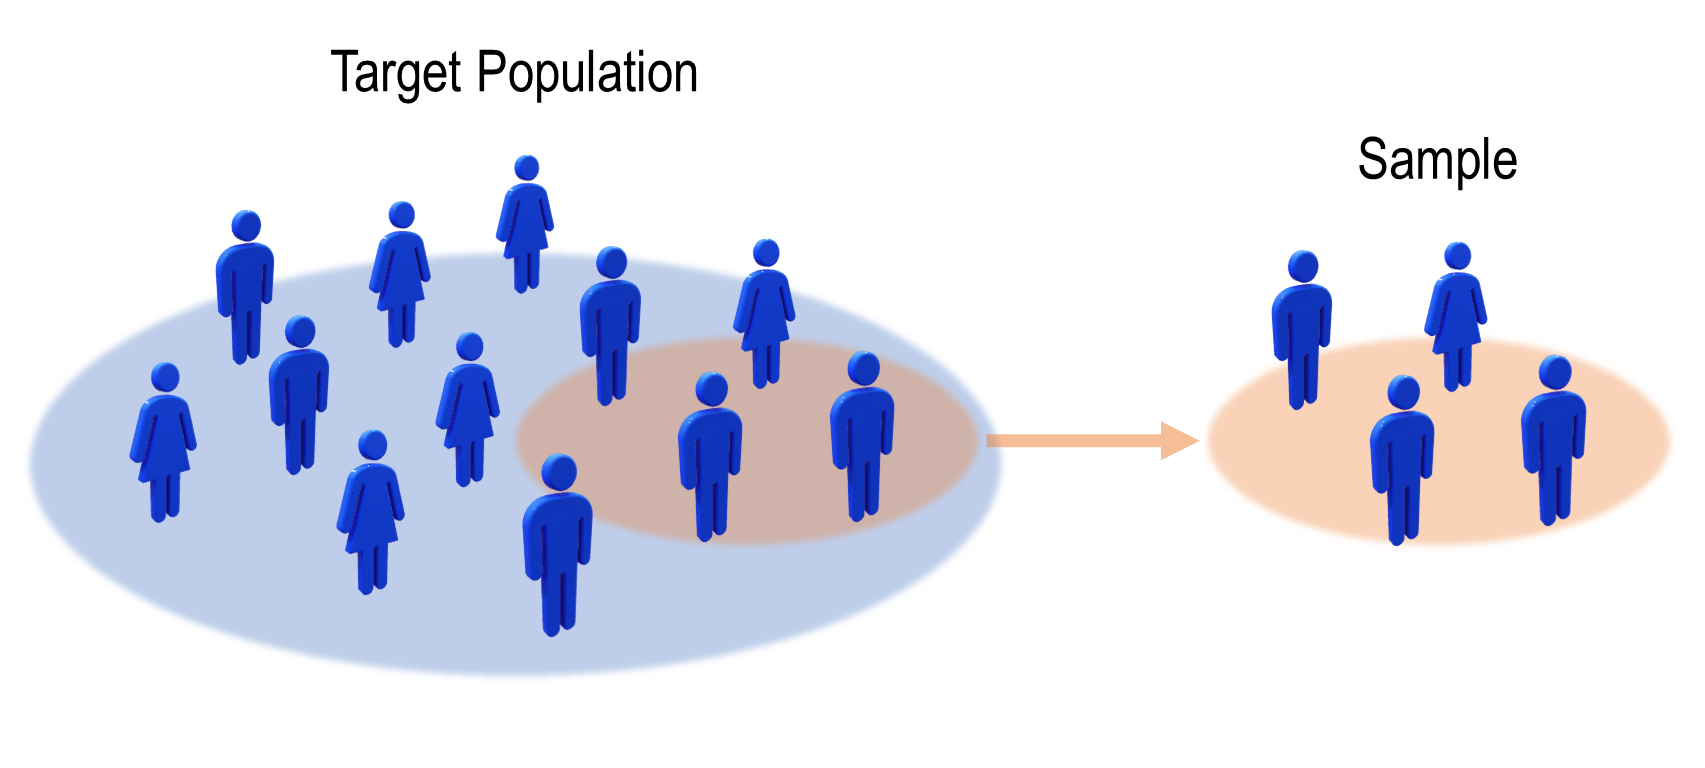
- Population: the entire group of interest
- Sample: the group actually surveyed
Random Sample
A sample is random if every individual in the population has an equal chance of being selected.
This is extremely important on the DIGITAL SAT. Conclusions about a population are only valid if the sample is random.
Why Random Sampling Matters
If the sample is not random, the results may not represent the population. The SAT often asks whether a conclusion is justified.
Common Types of Random Sampling
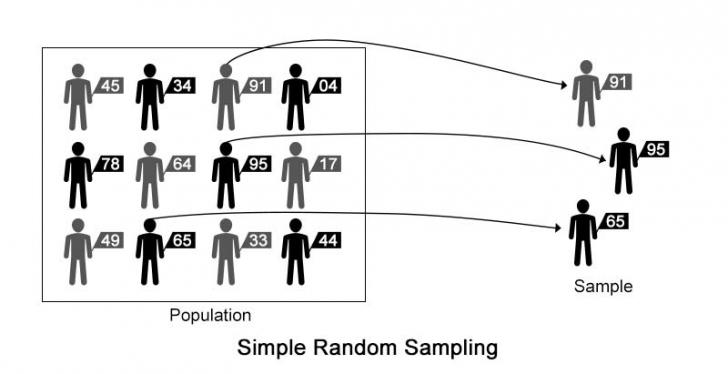
- Simple random sample: selecting names from a list using a random generator
- Systematic sample: selecting every 10th person
- Stratified sample: randomly selecting within groups (grades, age groups, etc.)
DIGITAL SAT Insight
The SAT commonly asks: “Can the results be generalized to the population?” The answer is yes only if the sample is random and representative.
Example 1 (Identifying a Random Sample):
A school wants to know students’ favorite lunch. The principal uses a random number generator to choose 80 students from the school roster. Can the results represent the whole school?
▶️ Answer/Explanation
Every student had an equal chance of being selected.
Conclusion: Yes. This is a random sample, so the results can represent the school.
Example 2 (Not Random):
A cafeteria surveys only students who buy lunch at the cafeteria to determine whether all students like cafeteria food. Is the conclusion valid?
▶️ Answer/Explanation
Students who do not buy cafeteria food were excluded.
Conclusion: Not valid. The sample is biased and does not represent the population.
Example 3 (Stratified Sampling):
A district wants opinions from elementary, middle, and high school students. They randomly select students within each school level. What type of sampling is this?
▶️ Answer/Explanation
Students are divided into groups and randomly chosen inside each group.
Conclusion: This is a stratified random sample.
Bias & Errors
Even when a study collects data, the results may still be misleading. On the DIGITAL SAT, you are often asked to identify whether a study is reliable. The two main issues are bias and random error.
Bias
Bias occurs when the sampling method systematically favors certain outcomes. A biased study does not represent the population accurately.
Common Types of Bias
- Selection bias: some members of the population cannot be chosen
- Voluntary response bias: people choose whether to participate
- Question wording bias: the question influences the answer
- Undercoverage: an important group is missing
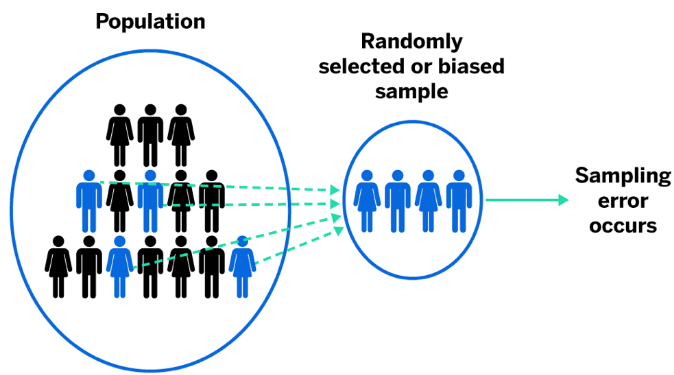
Random Error (Sampling Variability)
Even a good random sample may not perfectly match the population. This natural difference is called random error. It is not a mistake. It happens because only part of the population was surveyed.
Increasing the sample size reduces random error.
Key Difference
- Bias → caused by bad sampling method
- Random error → natural variation
DIGITAL SAT Tip
A larger sample size fixes random error, but it does not fix bias.
Example 1 (Selection Bias):
A gym surveys only people currently working out at the gym to estimate how often city residents exercise. Is the study reliable?
▶️ Answer/Explanation
People who do not exercise were excluded.
Conclusion: The study has selection bias and is not representative.
Example 2 (Voluntary Response Bias):
A website asks visitors to vote on whether homework should be banned. Only visitors who choose to click the poll respond. What problem exists?
▶️ Answer/Explanation
People with strong opinions are more likely to respond.
Conclusion: This is voluntary response bias.
Example 3 (Random Error):
A random survey of 40 students finds 55% prefer online classes. The true percentage in the school is 52%. Is this a mistake?
▶️ Answer/Explanation
The sample is random, but small samples naturally vary.
Conclusion: This is random error (sampling variability), not bias.
Margin of Error
When a survey reports a percentage, it usually does not give the exact population value. Instead, it gives an estimate along with a margin of error.
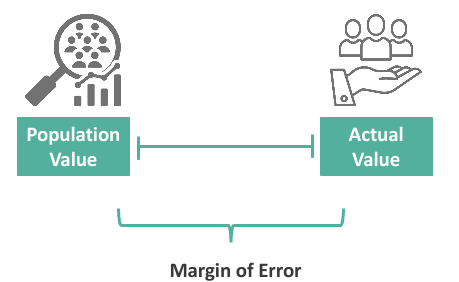
The margin of error tells how far the sample result could reasonably be from the true population value.
Interpreting Margin of Error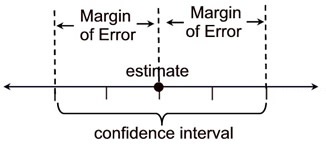
If a survey reports
\( 60\% \pm 3\% \)
this means the true population percentage is likely between
\( 57\% \text{ and } 63\% \)
The reported percent is called the point estimate.
Important Facts (DIGITAL SAT)
- Larger sample size → smaller margin of error
- Smaller sample size → larger margin of error
- Margin of error does NOT fix bias
Confidence Interval
The interval formed by the estimate plus/minus the margin of error is called a confidence interval.
\( \mathrm{estimate} \pm \mathrm{margin\ of\ error} \)
The SAT usually asks you to interpret what the interval means.
DIGITAL SAT Trap
Students often think the survey result is exact. It is not. It is a reasonable range of possible true values.
Example 1 (Finding the Interval):
A poll finds that 48% of students prefer online homework with a margin of error of 4%. What is the possible range of the true percentage?
▶️ Answer/Explanation
Lower bound:
\( 48 – 4 = 44\% \)
Upper bound:
\( 48 + 4 = 52\% \)
Conclusion: The true percentage is likely between 44% and 52%.
Example 2 (Comparing Polls):
Poll A reports 52% ± 3%. Poll B reports 52% ± 8%. Which poll is more reliable?
▶️ Answer/Explanation
Poll A has a smaller margin of error.
Conclusion: Poll A is more reliable because its estimate is more precise.
Example 3 (Interpretation):
A survey says 70% ± 5% of voters support a policy. Does this prove exactly 70% support it?
▶️ Answer/Explanation
The true value could be between:
\( 65\% \text{ and } 75\% \)
Conclusion: No. The survey estimates a range, not an exact percentage.