DSAT R&W Practice Question-Information and Ideas-Command of Evidence - Easy
DSAT R&W Practice Question-Information and Ideas-Command of Evidence – Easy
DSAT R&W Practice Question-Information and Ideas-Command of Evidence – Easy is part of Expression of Ideas : This section evaluates students’ ability to identify main ideas in a passage and the ability to make inferences about what the text implies, not just stating the obvious facts. Interpreting, evaluating, and combining different pieces of information from multiple sources is tested
Weightage : 26%
Subtopic: Information and ideas
Question
Roasted green chiles are a popular ingredient in Southwestern cuisine, but the traditional roasting method of burning propane is not environmentally friendly. To see if solar power could provide a better alternative, engineer Kenneth Armijo and his team roasted batches of green chiles using between 38 and 42 heliostats, which are devices that concentrate sunlight. The team was successful in reaching the same roasting temperature used in traditional propane roasting, but they found that propane yielded faster results. While the fastest solar-roasted green chiles took six minutes, batches using propane took only four. Armijo hypothesizes that they can reduce the roasting time for solar-roasted green chiles by using more heliostats.
Which finding, if true, would most directly support Armijo’s hypothesis?
A. The temperature inside the roasting drum is distributed more evenly when roasting green chiles with solar power than with propane.
B. Attempts to roast green chiles using 50 heliostats yields results in fewer than six minutes.
C. Green chile connoisseurs prefer the flavor of solar-roasted green chiles over the flavor of propane-roasted green chiles.
D. The skins of solar-roasted green chiles are easier to peel than the skins of propane-roasted green chiles
▶️Answer/Explanation
Ans. B
Correct Answer: B
Rationale
Choice B is the best answer. Armijo believes that using more heliostats will speed up the roasting process, and this finding shows that with 50 heliostats—more than the number of heliostats already used—the roasting time is indeed reduced.
Choice A is incorrect. The evenness of temperature in the roasting drum doesn’t tell us about the speed of the roasting process, which is what Armijo’s hypothesis is concerned with. Choice C is incorrect. Armijo’s hypothesis is focused on the speed of the roasting process, not the flavor of the resulting roasted chiles. Choice D is incorrect. Though Armijo’s hypothesis mentions a benefit of solar-roasting green chiles (easier peeling), it doesn’t address the speed of the roasting process
Question
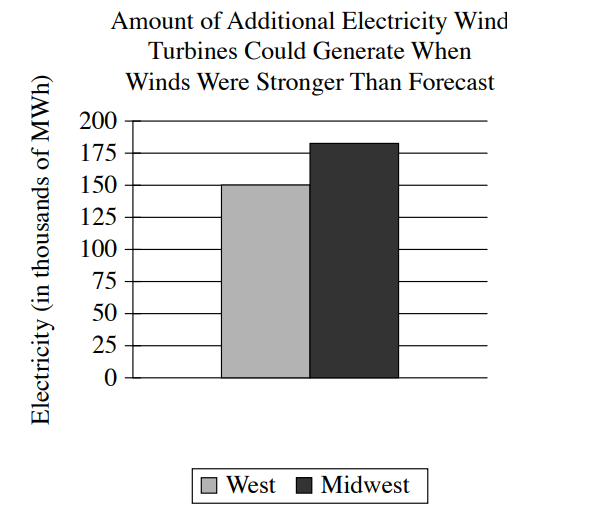
Electric companies that use wind turbines rely on weather forecasts to predict the maximum amount of power, in megawatt-hours (MWh), they can generate using wind so that they can determine how much they’ll need to generate from other sources. When winds are stronger than they were forecast to be, however, the predicted maximum amount of electricity wind turbines could generate will be too low. For example, the graph shows that for the West region, the winds were ______
Which choice most effectively uses data from the graph to complete the example?
A. strong enough to generate about 150 thousand more MWh of electricity from wind turbines.
B. so weak that the electricity from wind turbines was about 175 thousand MWh less than predicted.
C. so weak that the electricity from wind turbines was about 150 thousand MWh less than predicted.
D. strong enough to generate about 175 thousand more MWh of electricity from wind turbines.
▶️Answer/Explanation
Ans. A
Correct Answer: A
Rationale
Choice A is the best answer. The claim is that when winds are stronger than forecasted, wind turbines can generate more energy than predicted. The supporting graph shows the additional amount (above the predicted amount) that the turbines generated under those conditions, with the West generating about 150 thousand additional MWh.
Choice B is incorrect. This choice doesn’t complete the example. The graph shows the additional amount of electricity that the wind turbines generated. The West bar is greater than 0, so the West generated more than the predicted amount. Choice C is incorrect. This choice doesn’t complete the example. The graph shows the additional amount of electricity that the wind turbines generated. The West bar is greater than 0, so the West generated more than the predicted amount. Choice D is incorrect. This choice misreads the graph. The graph shows us that the West (the bar on the left) generated about 150 thousand additional MWh.