
Family Pedigrees
📝 Introduction
- A family pedigree (or pedigree chart) is a diagram that shows how an inherited characteristic or genetic disorder is passed through different generations of a family.
- It uses standard symbols to represent males, females and their relationships.
- Pedigrees help us trace the inheritance of a characteristic from parents to offspring.
- They can also help identify whether a trait is dominant or recessive and determine the possible genotypes of family members.
- Family pedigrees are widely used in genetics, medicine and genetic counselling.
🧬 What is a Family Pedigree?
- A family pedigree is a diagram that records the inheritance of a particular characteristic through several generations of a family.
- Instead of showing a genetic cross between two parents, it shows how a characteristic appears in an entire family over time.
Why are Pedigree Charts Used?
Pedigree charts help to:
- Trace the inheritance of a characteristic through generations.
- Identify affected and unaffected individuals.
- Determine whether a trait is dominant or recessive.
- Predict the chance of future children inheriting a characteristic.
- Study inherited genetic disorders in families.
Standard Symbols Used in Pedigree Charts
Understanding the symbols is the first step in interpreting a pedigree.
| Symbol | Meaning |
|---|---|
| □ (Square) | Male |
| ○ (Circle) | Female |
| ■ (Shaded square) | Affected male (shows the characteristic) |
| ● (Shaded circle) | Affected female (shows the characteristic) |
| □ or ○ (Unshaded) | Unaffected individual |
| Horizontal line between male and female | Marriage or parents |
| Vertical line below parents | Children |
| Horizontal line joining children | Brothers and sisters (siblings) |
Understanding the Structure of a Pedigree
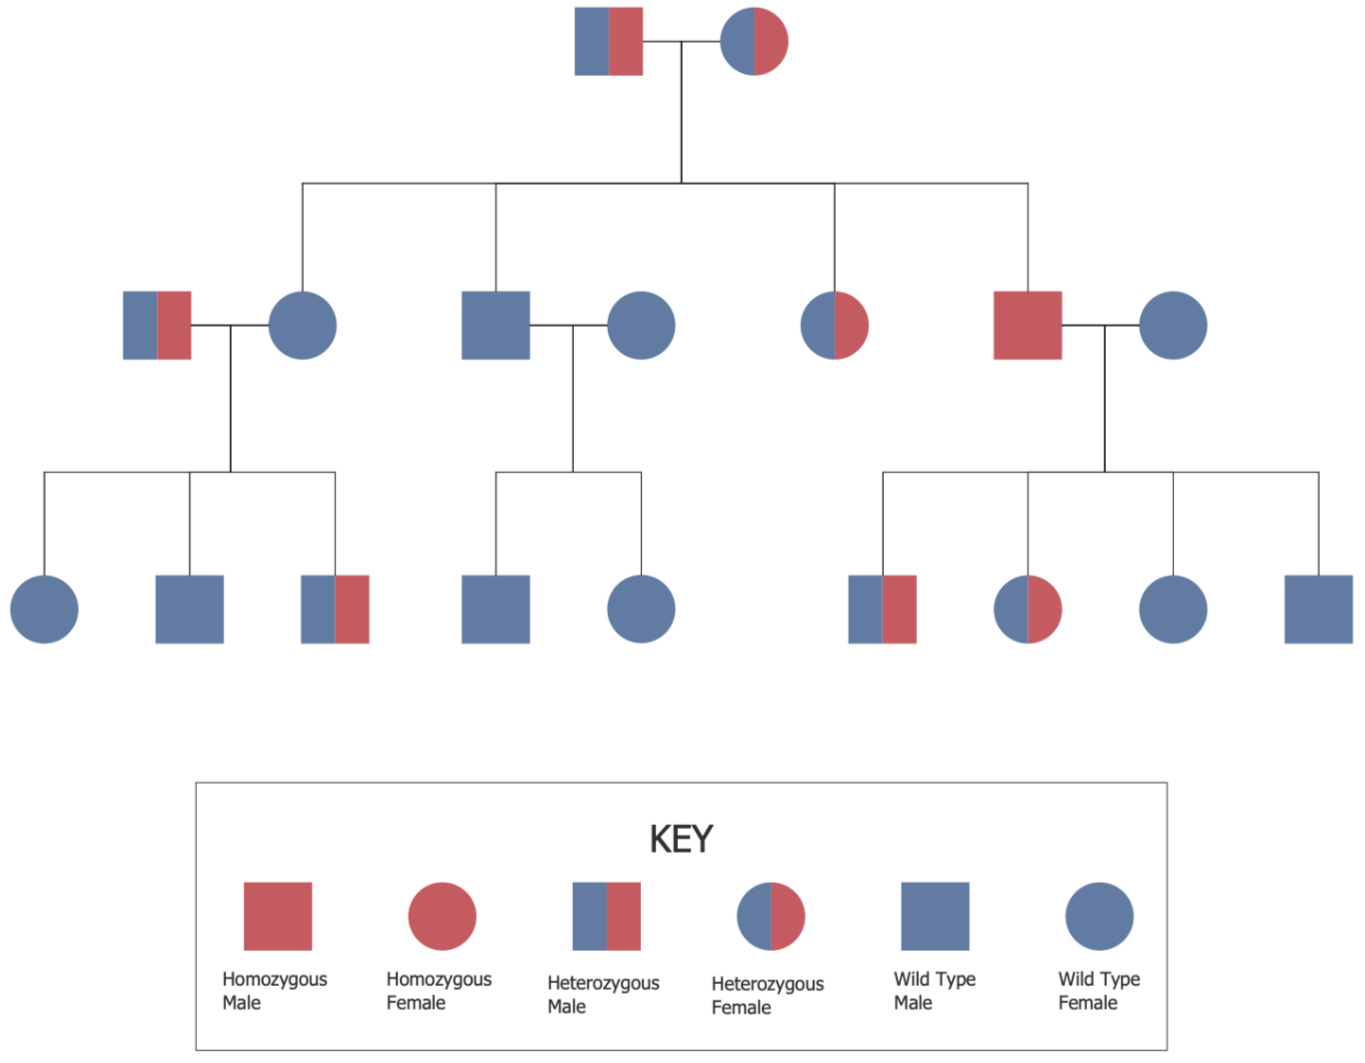
- A pedigree chart is usually arranged in generations.
- The oldest generation is shown at the top.
- Each new generation is shown below the previous one.
- Family relationships are connected using lines.
Generations
- Generations are labelled using Roman numerals.
Examples:
- Generation I
- Generation II
- Generation III
Individuals
- Each person within a generation is given a number.
Example:
Generation II
- II-1
- II-2
- II-3
- This numbering makes it easy to identify individuals.
🔍 How to Read a Pedigree Chart
When looking at a pedigree chart:
Step 1
Identify:
- Males (squares)
- Females (circles)
Step 2
Look for shaded symbols.
- Shaded individuals have the inherited characteristic being studied.
- Unshaded individuals do not have the characteristic.
Step 3
Identify family relationships.
Look for:
- Parents
- Children
- Brothers and sisters
Step 4
Observe how the characteristic appears in different generations.
Ask questions such as:
- Does the characteristic appear in every generation?
- Can unaffected parents have affected children?
- Are both males and females affected?
- These observations help identify the inheritance pattern.
🧬 Identifying Dominant Inheritance
A characteristic is likely to be dominant if:
- It usually appears in every generation.
- An affected person usually has at least one affected parent.
- Unaffected parents usually do not produce affected children.
- Both males and females can be affected.
Example Pattern
Generation I → Affected parent
⬇
Generation II → Some affected children
⬇
Generation III → Characteristic continues to appear
🧬 Identifying Recessive Inheritance
A characteristic is likely to be recessive if:
- It may skip generations.
- Two unaffected parents can have an affected child.
- Affected individuals may have unaffected parents.
- Both males and females can be affected.
Example Pattern
Generation I → Unaffected parents
⬇
Generation II → Affected child appears
This suggests the parents were carriers.
Determining Possible Genotypes
Pedigree charts can also help predict genotypes.
Example
Let:
- B = Dominant allele
- b = Recessive allele
If the characteristic is recessive:
Affected individual:
- bb
Unaffected individual:
May be:
- BB
- Bb
The pedigree provides clues to decide which genotype is most likely.
🌸 Example
Suppose:
- A shaded symbol represents a recessive disorder.
- Two unaffected parents have one affected child.
What can we conclude?
- The parents must both carry the recessive allele.
Genotypes:
- Father → Bb
- Mother → Bb
- Affected child → bb
⚠️ Common Mistakes to Avoid
- Confusing males and females.
- Forgetting that shaded symbols represent affected individuals.
- Assuming every unaffected person is homozygous dominant.
- Ignoring information from earlier generations.
- Deciding whether a trait is dominant or recessive without enough evidence.
📊 Dominant vs Recessive Patterns in Pedigrees
| Feature | Dominant Trait | Recessive Trait |
|---|---|---|
| Appears in every generation | Usually yes | May skip generations |
| Affected child from unaffected parents | Rare | Common |
| Affected individual usually has affected parent | Yes | Not always |
| Both sexes affected | Yes | Yes |
📌 Quick Recap
– Shaded = affected, Unshaded = normal.
– Every generation → Dominant.
– Skips generation → Recessive.
– More males affected → X-linked.
✨ Trick: D = Dominant → Doesn’t skip. R = Recessive → Rare/hidden in some generations.
Monohybrid Inheritance – Predicting Probabilities
📝 Introduction
- In genetics, offspring do not always inherit characteristics in the same way.
- We can predict the chance (probability) of different offspring being produced by using a genetic diagram (Punnett square).
- Probability tells us how likely a particular genotype or phenotype is to occur.
- These predictions are based on the alleles inherited from each parent.
- The predicted results are probabilities, so the actual offspring in a small family may differ, but the results become more accurate with a large number of offspring.
🧬 What is Probability in Genetics?
- Probability is the chance that a particular genotype or phenotype will be produced in the offspring.
It is usually written as:
- A fraction (¼, ½)
- A percentage (25%, 50%)
- A ratio (1 : 2 : 1 or 3 : 1)
- Probability helps us predict inheritance before the offspring are born.
What is a Monohybrid Cross?
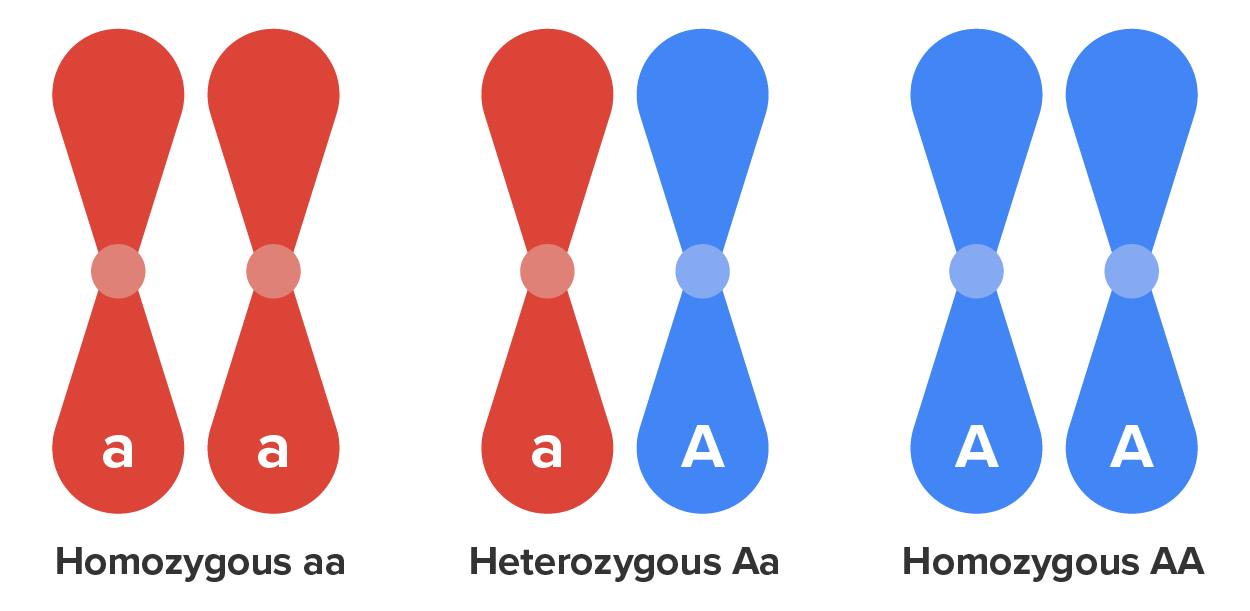
- A monohybrid cross studies the inheritance of one characteristic controlled by one gene.
- Each parent contributes one allele through its gametes.
- The alleles combine during fertilisation to form the offspring.
📝 Steps to Predict Probabilities
Whenever solving a monohybrid inheritance question, follow these steps.
Step 1: Identify the Alleles
- Decide which allele is dominant and which is recessive.
Example:
- R = Red flower (Dominant)
- r = White flower (Recessive)
Step 2: Write the Parent Genotypes
Example:
Rr × Rr
Step 3: Write the Gametes
- Each gamete carries only one allele.
Parent 1:
- R
- r
Parent 2:
- R
- r
Step 4: Draw the Punnett Square
| R | r | |
|---|---|---|
| R | RR | Rr |
| r | Rr | rr |
Step 5: Count the Offspring
Possible offspring:
- RR
- Rr
- Rr
- rr
Step 6: Calculate the Probability
- Count how many times each genotype or phenotype appears.
📊 Punnett Squares & Crosses
1. Homozygous Dominant (AA) × Homozygous Recessive (aa)
| A | A | |
| a | Aa | Aa |
| a | Aa | Aa |
Genotype: 100% Aa
Phenotype: 100% Dominant
Probability: 100% offspring show dominant trait
2. Heterozygous (Aa) × Heterozygous (Aa)
| A | a | |
| A | AA | Aa |
| a | Aa | aa |
Genotype ratio: 1:2:1
Phenotype ratio: 3:1
Probability: Dominant = 75%, Recessive = 25%
3. Heterozygous (Aa) × Homozygous Recessive (aa)
| A | a | |
| a | Aa | aa |
| a | Aa | aa |
Genotype ratio: 1:1
Phenotype ratio: 1:1
Probability: Dominant = 50%, Recessive = 50%
📊 How to Calculate Probability
Use the formula:
Probability = Number of desired outcomes ÷ Total number of possible outcomes
Example
In the cross:
Rr × Rr
What is the probability of getting a white flower?
- Number of white offspring = 1
- Total offspring = 4
- Probability = 1/4
- = 25%
⚠️ Important Points About Probability
- Probability predicts what is likely to happen.
- It does not guarantee the result of every individual offspring.
- Each fertilisation event is independent.
- Previous offspring do not affect the probability of future offspring.
- The expected ratios become more accurate when there are many offspring.
📊 Common Monohybrid Crosses
| Parent Cross | Genotype Ratio | Phenotype Ratio | Probability of Dominant Phenotype |
|---|---|---|---|
| RR × rr | 100% Rr | 100% Dominant | 100% |
| Rr × Rr | 1 : 2 : 1 | 3 : 1 | 75% |
| Rr × rr | 1 : 1 | 1 : 1 | 50% |
| RR × Rr | 1 : 1 | 100% Dominant | 100% |
| rr × rr | 100% rr | 100% Recessive | 0% |
📊 Genotype vs Phenotype Ratios
| Cross | Genotype Ratio | Phenotype Ratio |
|---|---|---|
| Rr × Rr | 1 RR : 2 Rr : 1 rr | 3 Dominant : 1 Recessive |
| Rr × rr | 1 Rr : 1 rr | 1 Dominant : 1 Recessive |
| RR × rr | 100% Rr | 100% Dominant |
⚡ Quick Recap
✔ Probability is the chance of a particular offspring being produced.
✔ A Punnett square is used to predict probabilities in monohybrid crosses.
✔ Each parent contributes one allele through its gametes.
✔ Probability can be written as a fraction, ratio or percentage.
✔ In the cross Rr × Rr:
• Probability of RR = 1/4 (25%)
• Probability of Rr = 1/2 (50%)
• Probability of rr = 1/4 (25%)
• Probability of the dominant phenotype = 3/4 (75%)
• Probability of the recessive phenotype = 1/4 (25%)
✔ Probability predicts expected outcomes, not the exact result for every individual offspring.