▶️ Answer/Explanation
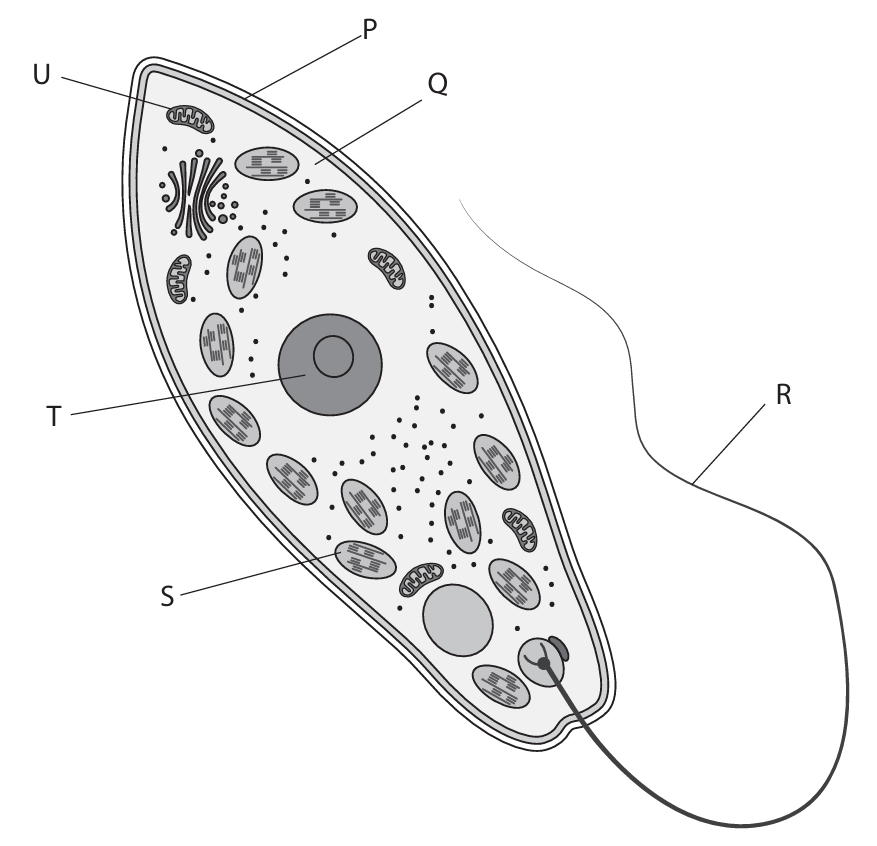
(a)(i) C (protocysts)
A is not the answer as Euglena is not in bacteria
B is not the answer as Euglena is not in fungi
D is not the answer as Euglena is not in viruses
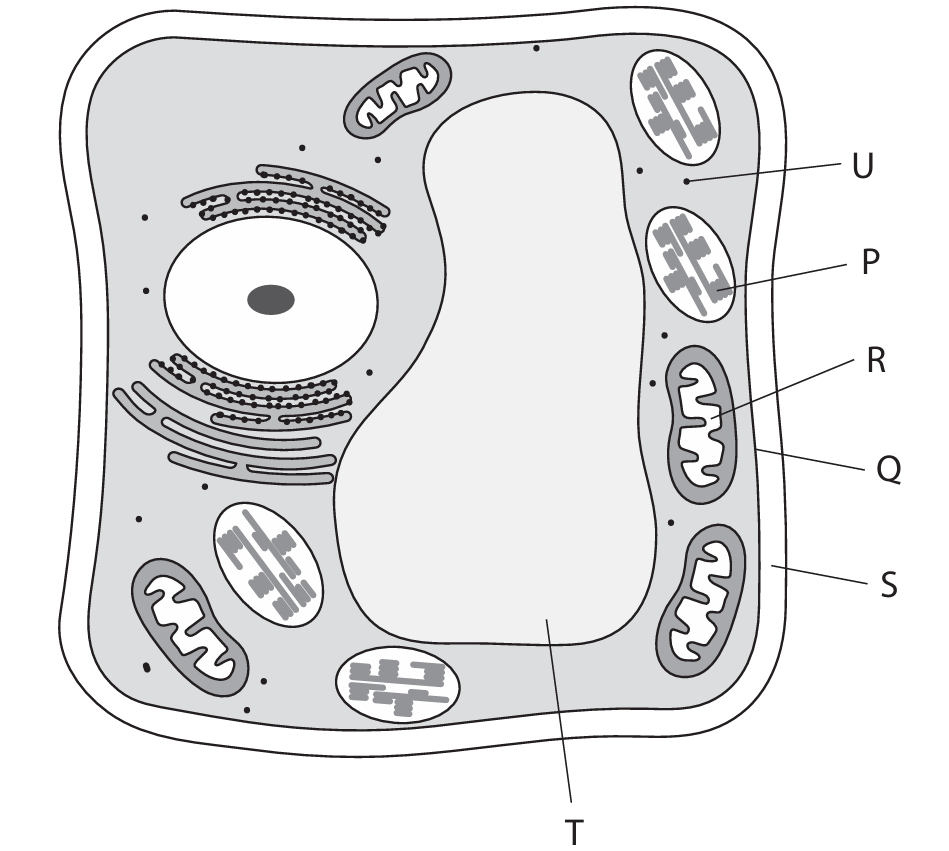
(a)(ii) D (U)
A is not the answer as P is the membrane
B is not the answer as R is the flagellum
D is not the answer as T is the nucleus
(a)(iii) D (T)
A is not the answer as P is the membrane
B is not the answer as Q is the cytoplasm
C is not the answer as R is the flagellum
(a)(iv) A (P)
B is not the answer as Q is the cytoplasm
C is not the answer as R is the flagellum
D is not the answer as U is the mitochondrion
(b) C (S)
A is not the answer as P is the cell membrane
B is not the answer as Q is the cytoplasm
D is not the answer as T is the nucleus
(c) • structure / part of a cell with particular function / purpose / role (s) /eq
(d) An explanation that makes reference to three of the following:
• mitochondria / U (1)
• (mitochondrion) respiration / releases energy / provides ATP / eq (1)
• flagellum / R / tail / eq (1)
▶️ Answer/Explanation
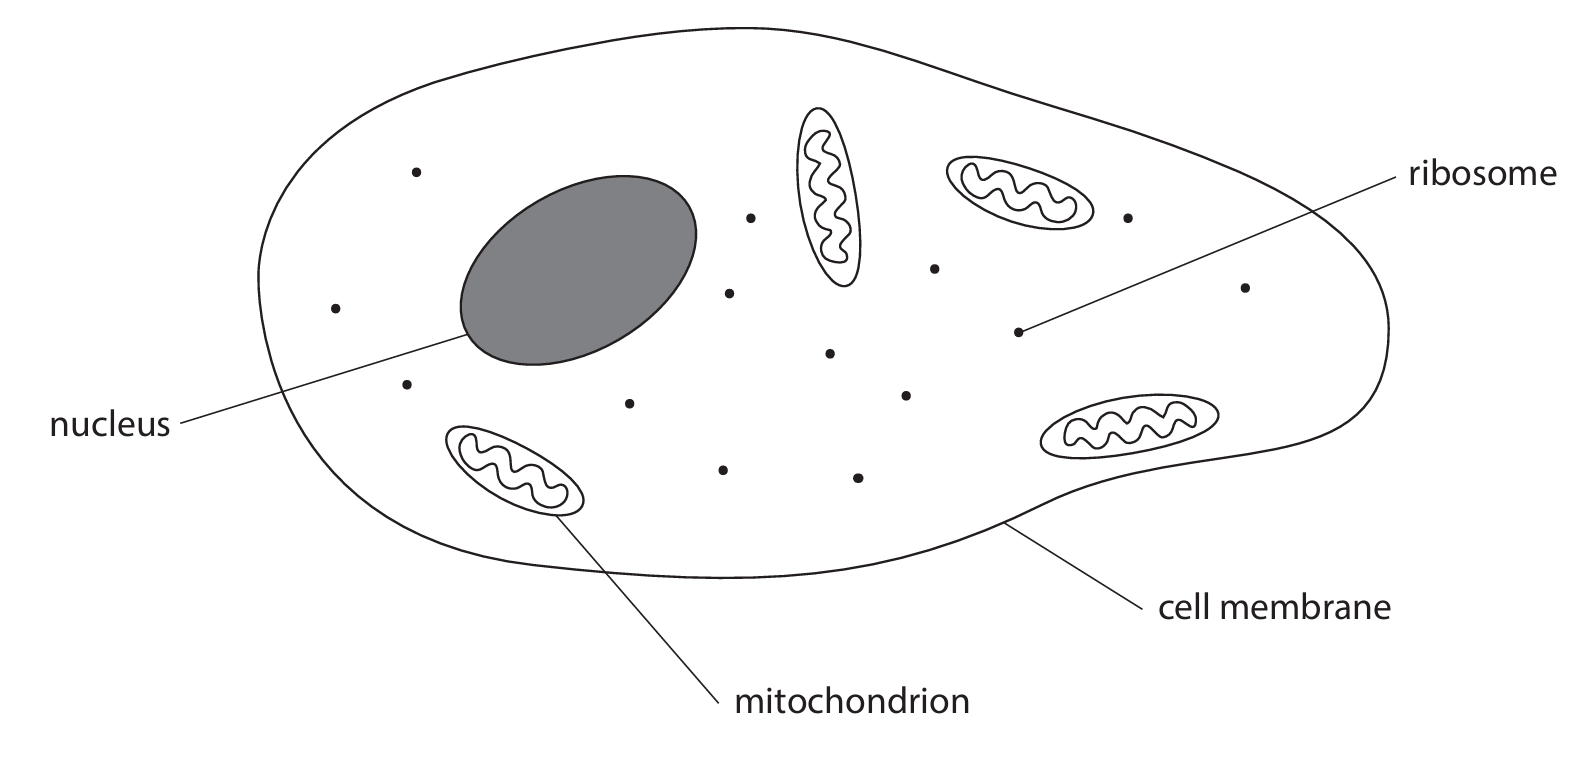
(a)(i) D (ribosome)
A is incorrect as cell membrane does not synthesise protein
B is incorrect as mitochondria does not synthesise protein
C is incorrect as the nucleus does not synthesise protein
(a)(ii) C (mitochondrion, nucleus and ribosome)
A is incorrect as ribosomes are also present in both
B is incorrect as nuclei are also present in both
D is incorrect as mitochondrion is also present in both
(b)(i) 40:1
Example calculation:
• Number of mitochondria per 10 μm3 for sperm = 12
• Volume of sperm cell = (75 ÷ 12) × 10 = 62.5 μm3
• Ratio = 2500:62.5 = 40:1
(b)(ii) An explanation that makes reference to four of the following:
• villus has highest number of mitochondria per cell / sperm has lowest number of mitochondria per cell
• sperm has highest number of mitochondria per 10 μm3 / skin has lowest number per 10 μm3
• mitochondria perform aerobic respiration / make ATP / release energy
• villus cells do active transport (so need lot of energy)
• sperm cells move / swim (so need lot of energy)
• skin cells have few active processes / use little energy

▶️ Answer/Explanation
(a)(i) A (Mucor is a eukaryotic organism with cell walls made of chitin)
B is incorrect as Mucor does not have cellulose
C is incorrect as Mucor is not a prokaryote
D is incorrect as Mucor is not a prokaryote
(a)(ii) B (1)
A is incorrect as Mucor has cytoplasm
C is incorrect as Mucor does not have chloroplasts or starch
D is incorrect as Mucor does not have chloroplasts or starch
(a)(iii)
• \(3.14 \times 45^2 = 6358.5\)
• to two sig figs = 6400
(b)(i) An answer that makes reference to two of the following:
• asexual produces genetically identical offspring / clones (1)
• asexual has no fertilisation / no gametes (1)
• asexual only has one parent cell (1)
• asexual uses (only) mitosis / asexual does not use meiosis (1)
(b)(ii) An explanation that makes reference to the following:
• sexual reproduction produces (genetic) variation (1)
• some may survive environmental changes / not all killed by disease / are more adaptable / natural selection can occur (1)
▶️ Answer/Explanation
(a)(i) • producer / first trophic level (1)
(a)(ii) • tertiary consumer / third consumer / fourth trophic level (1)
(b)(i)
Calculation method (not marking points):
Full marks for correct answer with no working.
Example: Measured length = 75 mm = 75 × 1000 = 75000 µm
Magnification = image size / actual size = 75000 µm / 10 µm = × 7500 (2)
(Allow answers in the range 7400 to 7600 depending on measurement. Ignore units in final answer.)
(b)(ii)
Calculation method (not marking points):
Full marks for correct answer with no working.
Example using formula: \( V = \frac{4}{3} \pi r^3 \)
\( r^3 = 5^3 = 125 \)
\( V = \frac{4}{3} \times 3.14 \times 125 = \frac{4 \times 392.5}{3} = \frac{1570}{3} = 523.33 \)
Volume = 523 µm3 (2) (Allow 522–524). If they round 4/3 to 1.33, answer will be = 522.
(b)(iii) A description that includes two of the following points:
• absorbs / traps (sun)light / light energy (1)
• site of photosynthesis (1)
• produces glucose / carbohydrate / sugar / starch (1)
(Note: Ignore “uses”. “Converts light energy into chemical energy” scores the first and third marking points.) (2)
(b)(iv) A description that includes the following points:
• provides an energy store / energy reservoir / stores carbohydrate (1)
• (can be broken down to release energy in) respiration (1) (2)
(c) A description that includes four of the following points:
• use quadrats (1)
• random sampling (1)
• use coordinates / grid to select sample positions (1)
• count number of individuals / plants in each quadrat (1)
• repeat and (calculate) mean / average (1)
• multiply (mean count) by size of (total) area to estimate population size (1)
(Note: “Use quadrats” scores the first and fifth marking points.) (4)
▶️ Answer/Explanation
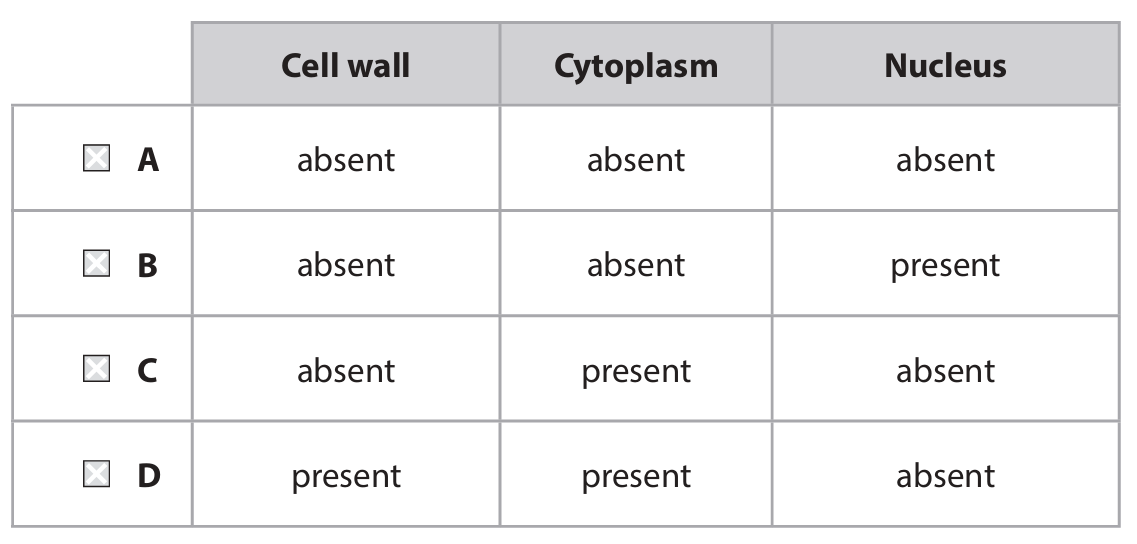
(a)(i) C (absent, present, absent)
A is incorrect because red blood cells have cytoplasm.
B is incorrect because human red blood cells do not have a nucleus.
D is incorrect because red blood cells do not have a cell wall.
(a)(ii) D (tissue)
A is incorrect because organs have more than one cell type.
B is incorrect because organisms have more than one cell type.
C is incorrect because systems have more than one cell type.
(b)(i) A description that makes reference to the following:
• use a syringe / pipette / beaker / (measuring) cylinder / eq (1)
• mix 5 cm\(^3\) of (10%) sucrose solution with 5 cm\(^3\) water / eq (1)
Accept other correct measuring apparatus.
Accept take 5 cm\(^3\) sucrose and make up to 10 cm\(^3\) with water / add equal volumes of water and sucrose and use 10 cm\(^3\) / eq.
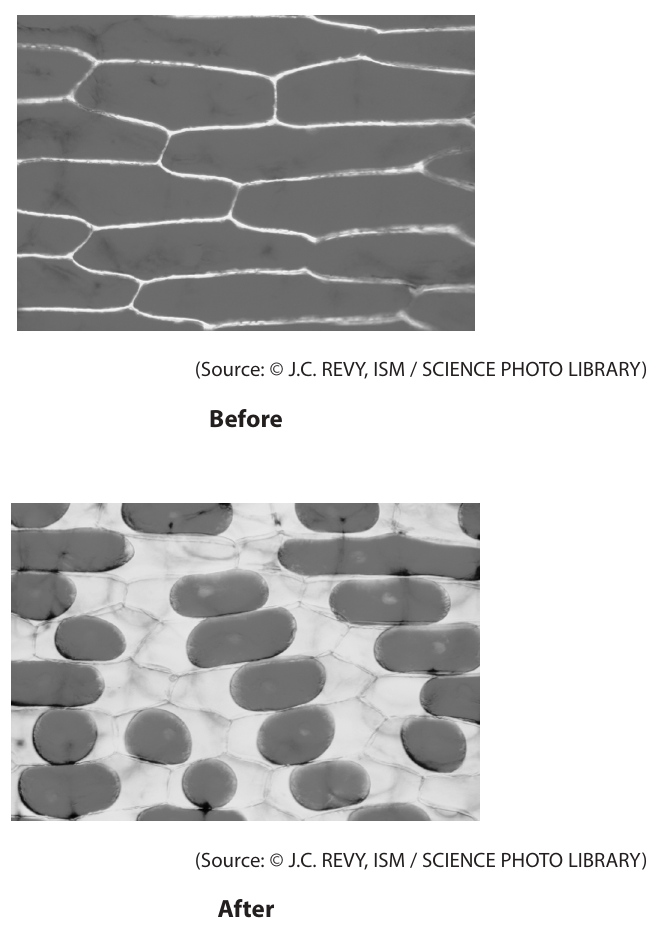
(b)(ii) An explanation that makes reference to three of the following:
• water leaves (the cells) / eq (1)
• by osmosis (1)
• from a high(er) water potential to a lower water potential / from higher water concentration to lower water concentration / from dilute solution to concentrated solution / eq (1)
• membrane detaches from cell wall / cell is flaccid / cytoplasm shrinks / cytoplasm volume decreases / cells are plasmolysed / eq (1)
Accept lose water.
Accept water moves from a high concentration to a low concentration.
Ignore cell shrinks.
▶️ Answer/Explanation
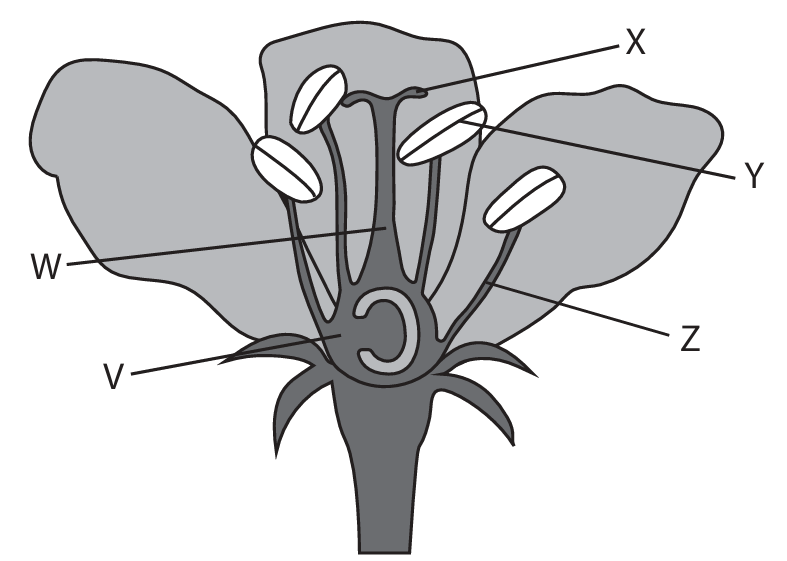
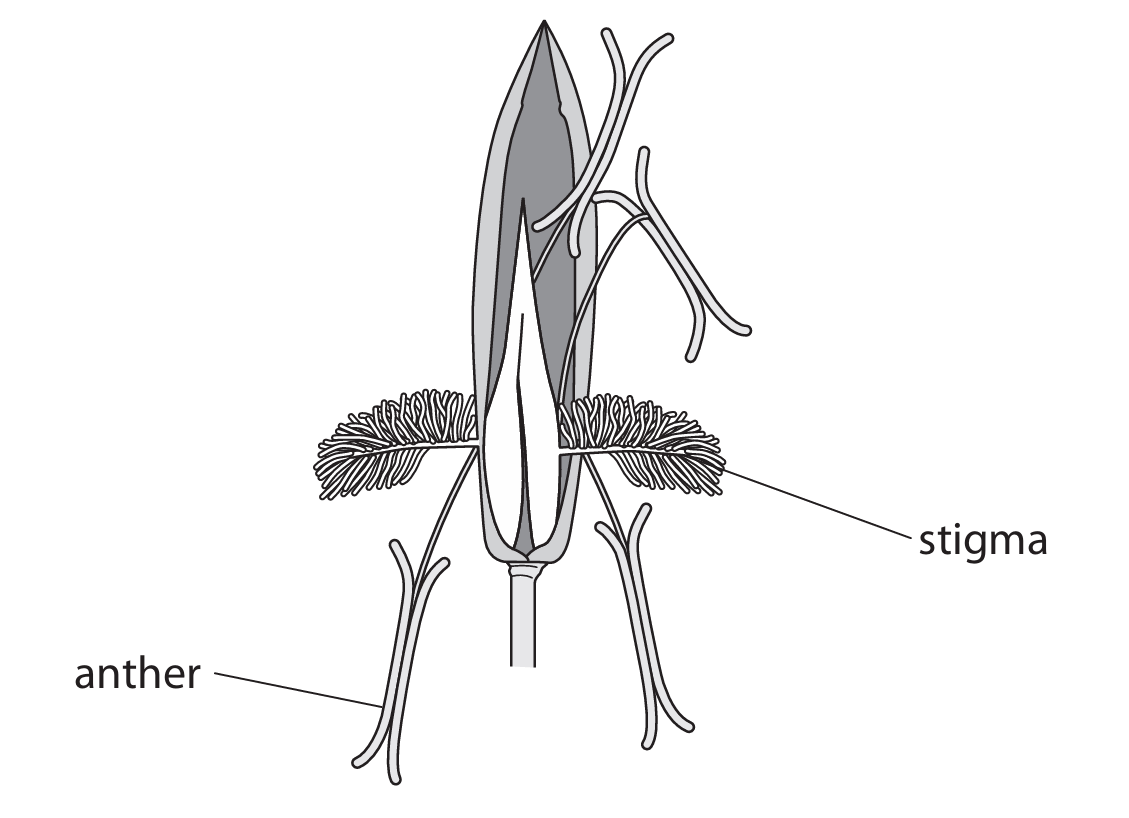
(a)(i) C (Y)
A is incorrect because V is the ovary.
B is incorrect because X is the stigma.
D is incorrect because Z is the filament.
(a)(ii) A (V)
B is incorrect because W does not become a fruit.
C is incorrect because X does not become a fruit.
D is incorrect because Y does not become a fruit.
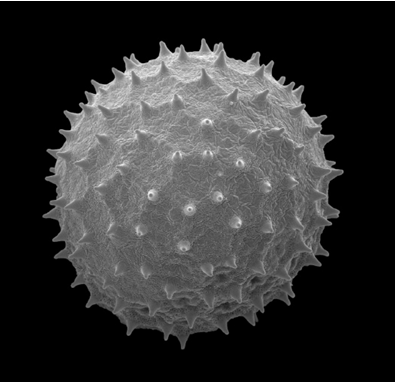
(b)(i) 96 (\( \times \))
Stages of calculation:
• Convert mm to \( \mu m \): 30 mm = \( 30 \times 1000 = 30000 \) \( \mu m \).
• Magnification = \( \frac{\text{image size}}{\text{actual size}} = \frac{30000}{313} \).
• Calculation: \( \frac{30000}{313} \approx 95.85 \).
• To nearest whole number = 96.
(b)(ii) • spikes / hooks / sticky / eq (1)
(c) An answer that makes reference to two of the following:
• asexual reproduction (1)
• cuttings are genetically identical / have same alleles / same genes / are clones / eq (1)
• faster / can be produced at any time of year / can be done from only one plant / no need to have insects / eq (1)
▶️ Answer/Explanation
(a)(i) B (oxygen)
A is not the answer as carbon dioxide is not released
C is not the answer as methane is not released
D is not the answer as nitrogen is not released
(a)(ii) A (chloroplast)
B mitochondrion is not the site of photosynthesis
C nucleus is not the site of photosynthesis
D ribosome is not the site of photosynthesis
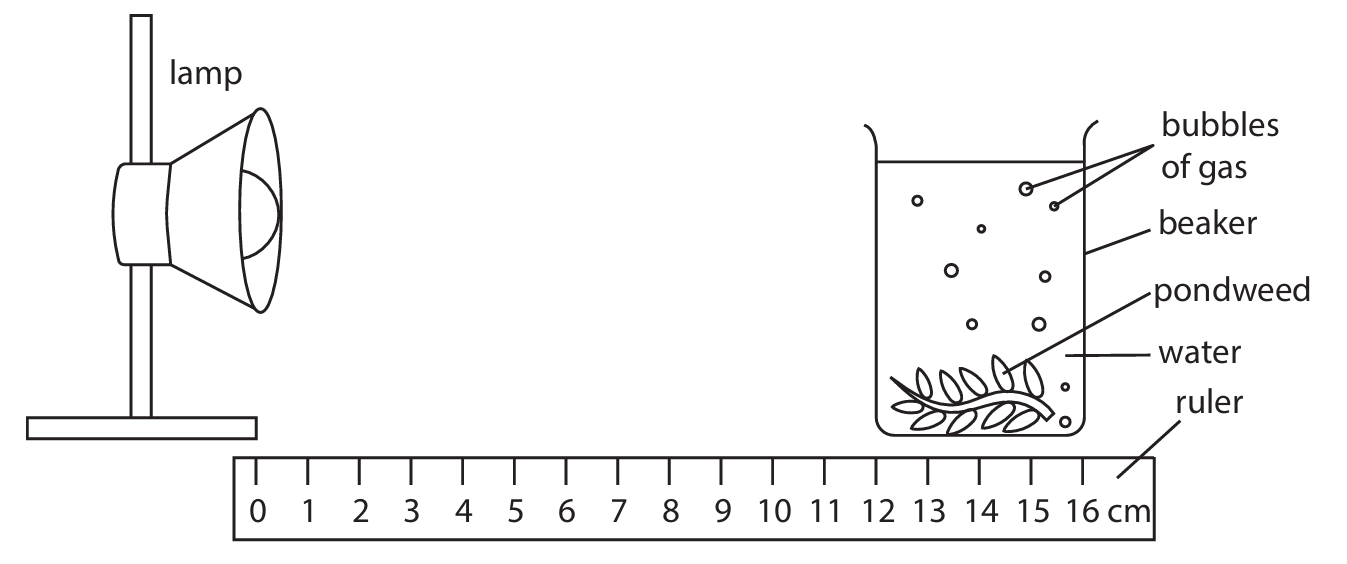
(a)(iii) • temperature / carbon dioxide concentration / pH / background light / same bulb/ lamp / time period / eq (1)
(b)(i) Line graph plotting criteria (from mark scheme):
• scale linear and plot half grid on y (1)
• lines straight and through points (1)
[Note: A full graph is expected here. The mark scheme awards marks for correct scaling, plotting, and straight line connections.]
(b)(ii) An explanation that refers to three of the following:
• as distance increases rate falls / fewer bubbles / eq (1)
• as light intensity reduces / less light energy / light becomes limiting factor (1)
• slower rate of / less photosynthesis (1)
• less oxygen released / fewer oxygen bubbles released (1)


▶️ Answer/Explanation
(a)(i) B (chitin)
Explanation: The cell walls of fungal cells, including yeast, are primarily composed of chitin, a strong and flexible polysaccharide. Cellulose is found in plant cell walls, while glycogen and starch are storage polysaccharides and are not structural components of cell walls.
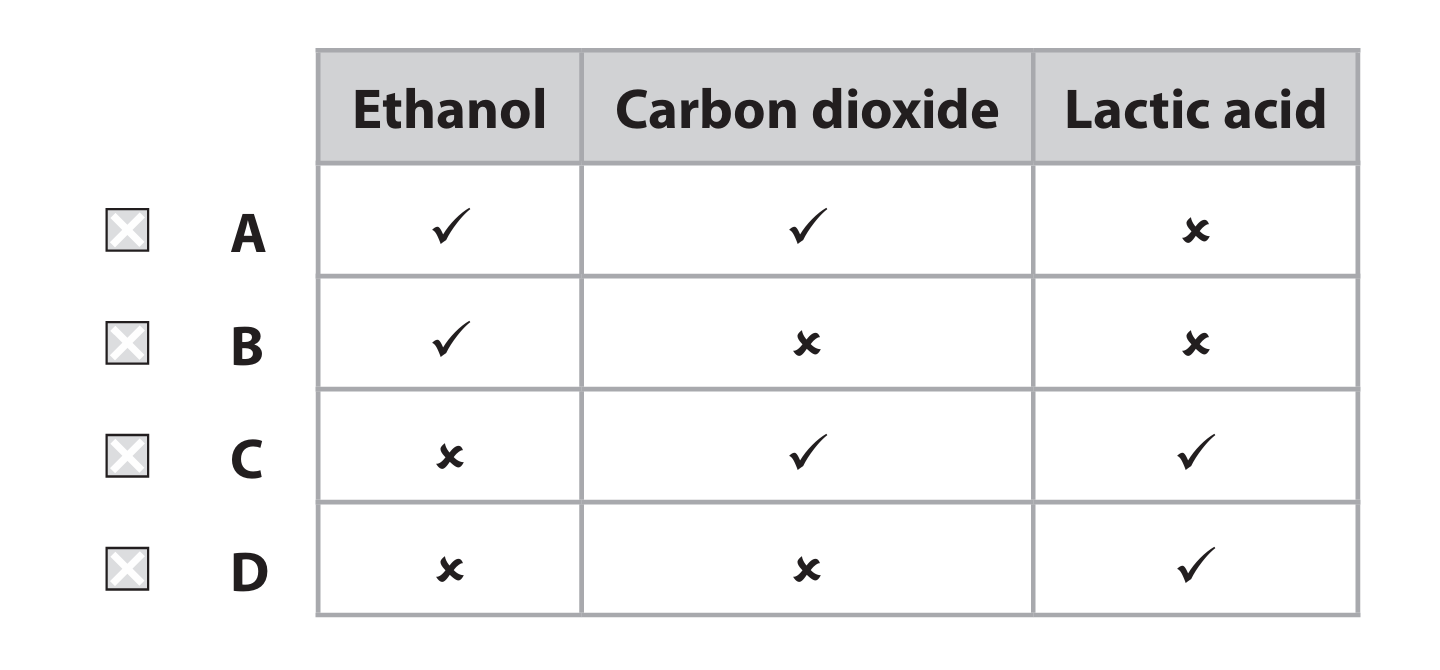
(a)(ii) A
Explanation: Yeast undergoes alcoholic fermentation during anaerobic respiration. The products of this process are ethanol and carbon dioxide. Lactic acid is not produced; it is a product of anaerobic respiration (lactic acid fermentation) in certain bacteria and animal muscle cells.
(b)(i) To stop oxygen getting in / to prevent aerobic respiration.
Explanation: The layer of paraffin oil acts as a barrier, sealing the yeast and glucose mixture from the air. This prevents oxygen from dissolving into the solution, ensuring that the yeast is forced to respire anaerobically (ferment) rather than aerobically, which would produce different products and potentially a different rate of gas production.
(b)(ii) Use a water bath. Monitor the temperature with a thermometer.
Explanation: To maintain a constant temperature, the test tube containing the yeast mixture should be placed in a water bath set to the desired temperature (e.g., 25°C or 37°C). The large volume of water helps to buffer against rapid temperature changes. The student should then use a thermometer to regularly check the temperature of the water bath (or the mixture itself) and make minor adjustments if necessary to keep it constant throughout the experiment.
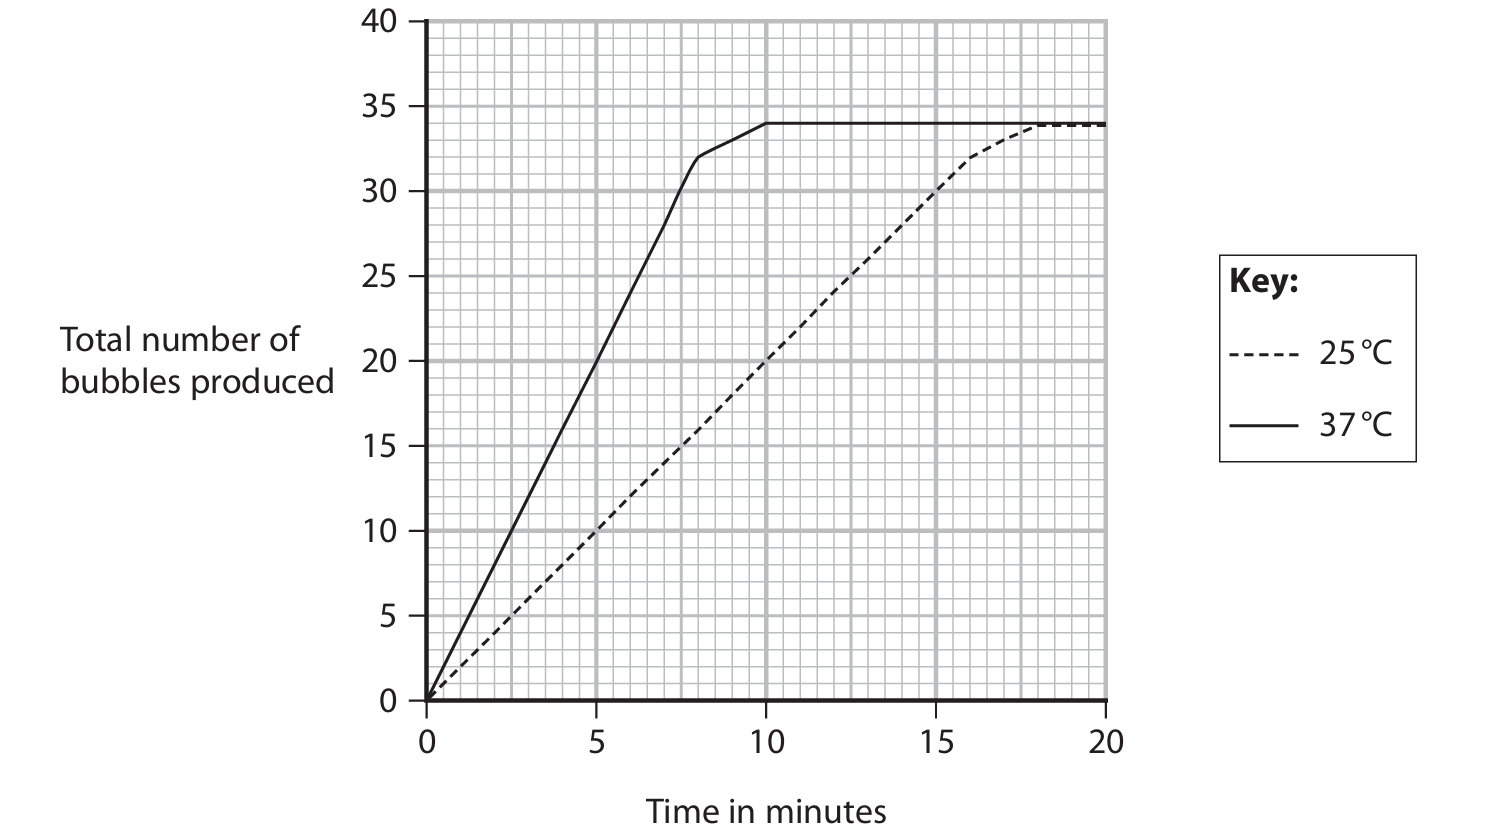
(b)(iii) 4 bubbles per minute
Explanation: The calculation for rate is: Rate = Total number of bubbles / Time. According to the graph, at 37°C, the total number of bubbles produced by 8 minutes is 32. Therefore, the rate is 32 bubbles / 8 minutes = 4 bubbles per minute.
(b)(iv) The total number increases up to around 16–18 minutes and then levels off. This is because initially glucose is not limiting, but later it runs out or the yeast is poisoned by ethanol.
Explanation: The graph line for 25°C shows a steady increase in the cumulative number of bubbles up to a certain point (around 16–18 minutes), after which the line becomes horizontal. The initial increase indicates that anaerobic respiration is occurring at a constant rate, as there is plenty of glucose substrate available. The leveling off occurs because the glucose supply eventually becomes depleted. Additionally, the ethanol produced as a waste product can reach a concentration that becomes toxic to the yeast cells, inhibiting further respiration and stopping bubble production.
(b)(v) The rate is faster at 37°C. This is because 37°C is closer to the optimum temperature for enzymes involved in respiration.
Explanation: The graph shows a steeper gradient (more bubbles produced in the same time) for the 37°C line compared to the 25°C line between 0 and 10 minutes. Enzyme‑controlled reactions, like those in respiration, have an optimum temperature. 37°C is closer to this optimum than 25°C. The increased thermal energy at 37°C causes enzymes and substrate molecules to move faster and collide more frequently and with more energy. This increases the rate of successful collisions and the formation of enzyme‑substrate complexes, thus speeding up the reaction. The faster rate also means the glucose substrate is used up more quickly at 37°C, which is why the curve begins to level off earlier.
(b)(vi) Collect and measure the volume of gas produced instead of counting bubbles. Use a gas syringe or a measuring cylinder in a water trough.
Explanation: Counting bubbles is an inaccurate method because bubbles can vary significantly in size. A small bubble and a large bubble would each count as one, giving a misleading measure of the actual quantity of gas produced. A more accurate method would be to replace the delivery tube in the diagram with one that leads into an inverted measuring cylinder (or burette) filled with water, or to use a gas syringe. This apparatus would collect the gas and allow the student to measure its volume directly, which is a more reliable and quantitative measure of the rate of respiration.
▶️ Answer/Explanation
(a)(i) D (T)
The vacuole is a large, permanent organelle in plant cells, typically the largest visible structure.
(a)(ii) A (P)
Photosynthesis occurs in chloroplasts, which are shown as oval structures labelled P.
(a)(iii) C (S)
The cell wall is the rigid outer layer surrounding the cell membrane, labelled S.
(a)(iv) C (ribosome)
Ribosomes are the site of protein synthesis.
(b) 113 : 1
Surface area = \(6 \times (0.053)^2 = 0.016854 \, \text{mm}^2\)
Volume = \((0.053)^3 = 0.000148877 \, \text{mm}^3\)
Ratio = \( \frac{0.016854}{0.000148877} \approx 113.2 \) → 113 : 1
(c)(i) Water enters the red blood cell by osmosis because distilled water has a higher water potential. The cell lacks a cell wall, so it swells and bursts (haemolysis).
(c)(ii) Water leaves the red blood cell by osmosis because the salt solution has a lower water potential. Without a cell wall, the cell shrinks and shrivels (crenation).

▶️ Answer/Explanation
(a)
1 Plasma
2 Platelets
Explanation: Blood is composed of several components. Red and white blood cells are the cellular components. The other two major components are plasma, which is the liquid matrix that carries the cells, nutrients, hormones, and waste products, and platelets, which are cell fragments crucial for blood clotting.
(b)
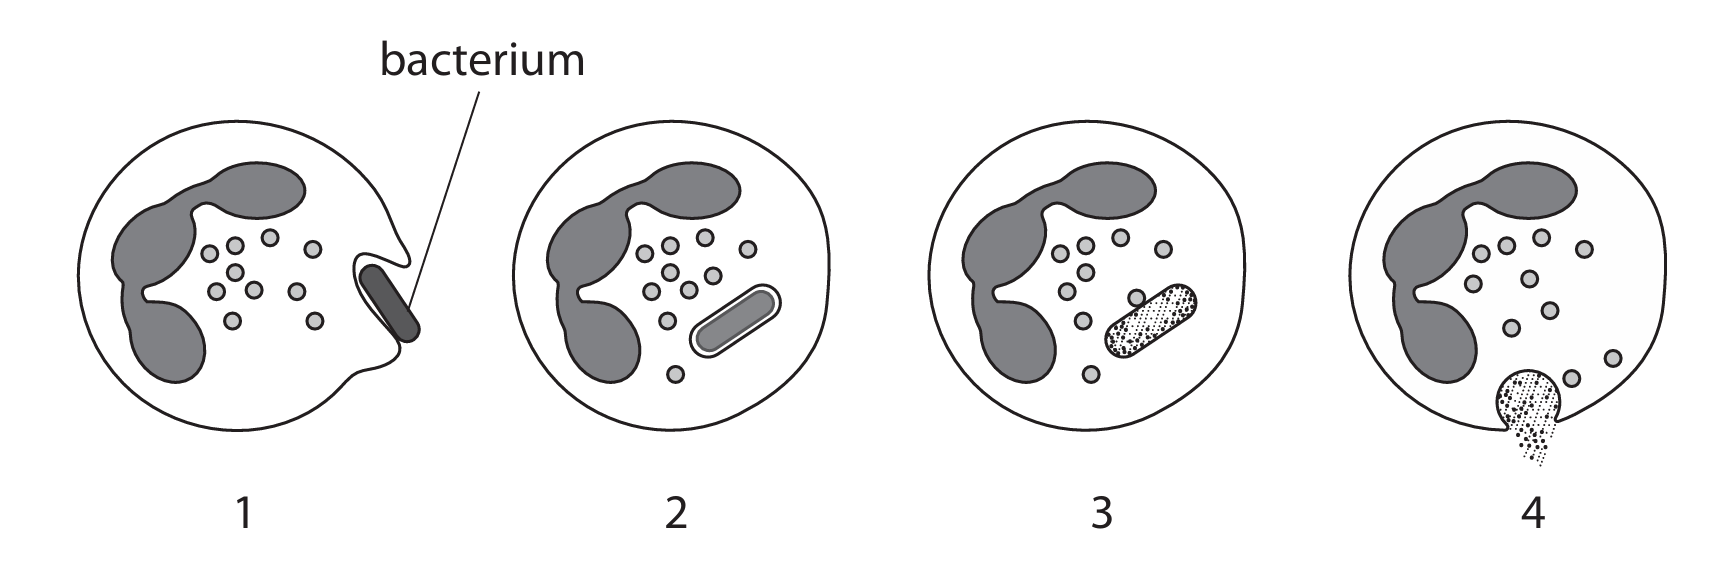
Stage 1: The white blood cell (a phagocyte) identifies the bacterium as a foreign pathogen and begins to move towards it.
Stage 2: The white blood cell engulfs the bacterium by extending its cell membrane around it, a process called phagocytosis. The bacterium becomes enclosed within a vesicle inside the cell called a phagosome.
Stage 3: A lysosome, containing digestive enzymes, fuses with the phagosome. The enzymes break down and digest the bacterium.
Stage 4: The waste products from the digested bacterium are expelled from the white blood cell through a process of exocytosis.
Explanation: This describes the process of phagocytosis, which is a key defense mechanism of the innate immune system. Specific types of white blood cells, like neutrophils and macrophages, use this method to ingest and destroy harmful microorganisms.
(c)(i)
magnification = 7000 (Accept answers in the range 6800–7300)
Explanation: To calculate magnification, you use the formula:
Magnification = Image Size / Actual Size
First, measure the diameter of the red blood cell in the picture. Let’s assume it measures approximately 5.7 cm (57 mm). Convert this to micrometres (μm) to match the units of the actual size: 57 mm × 1000 = 57,000 μm.
The actual size is given as 8.1 μm.
Therefore, Magnification = 57,000 μm / 8.1 μm ≈ 7037. This can be rounded to 7000 when considering significant figures and acceptable range.
(c)(ii)
Discussion:
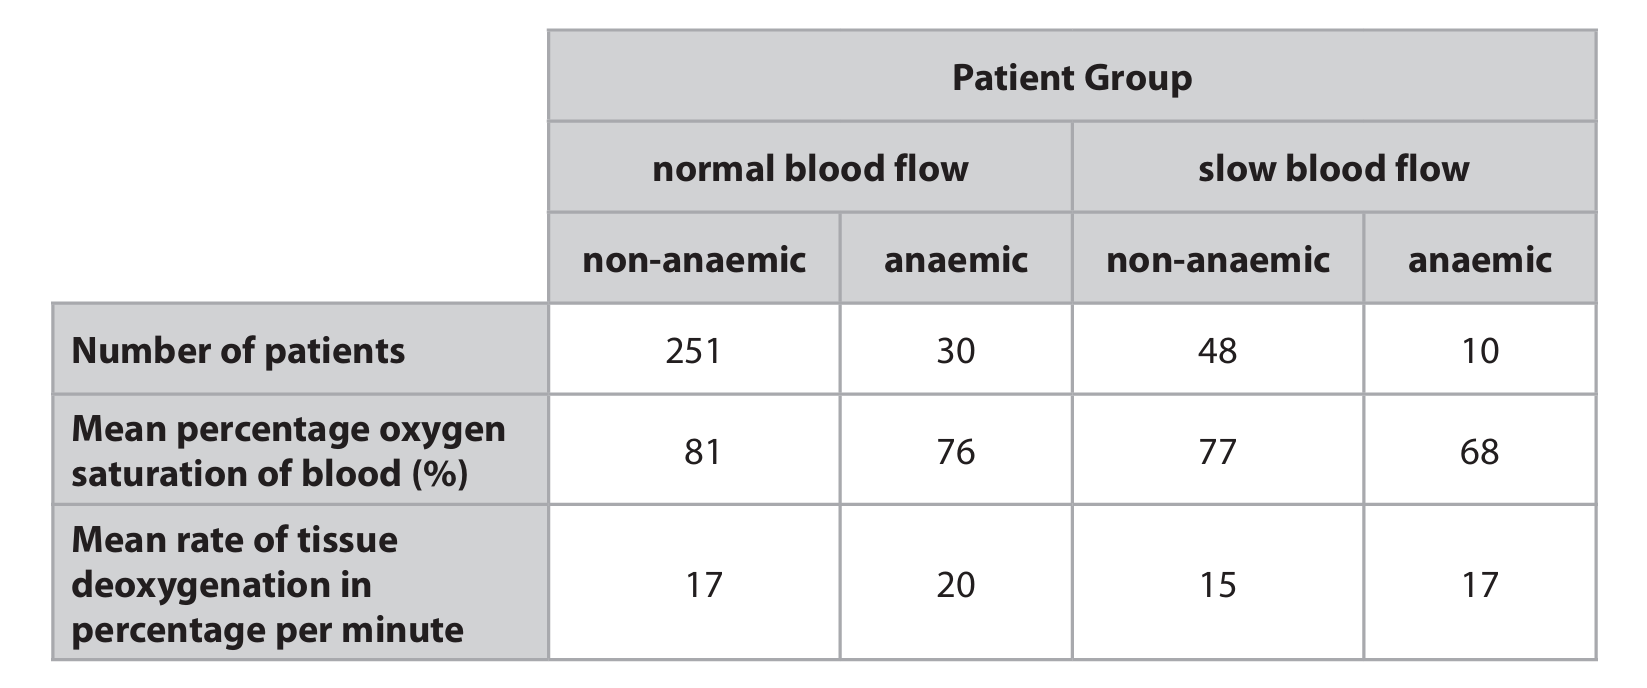
- Anaemia and Oxygen Saturation: For both blood flow groups, the mean percentage oxygen saturation is lower in anaemic patients (76% vs. 81% for normal flow; 68% vs. 77% for slow flow). This is because anaemia means fewer red blood cells and less haemoglobin, reducing the blood’s overall capacity to carry oxygen.
- Blood Flow and Oxygen Saturation: For both patient types (anaemic and non-anaemic), oxygen saturation is lower in the slow blood flow groups. Slower flow may allow more time for oxygen to be unloaded to tissues, leaving less oxygen bound in the blood vessels being measured.
- Rate of Tissue Deoxygenation: Under normal blood flow, the rate of deoxygenation is higher in anaemic patients (20%/min vs. 17%/min). This suggests that tissues are extracting oxygen from the blood more rapidly, possibly to compensate for the lower oxygen-carrying capacity. The difference is less pronounced in the slow blood flow group (17%/min vs. 15%/min), likely because the slower flow already allows for more complete oxygen extraction regardless of red blood cell count.
- Combined Effect: The lowest oxygen saturation (68%) is seen in anaemic patients with slow blood flow, showing these factors have a combined negative effect. Interestingly, their deoxygenation rate (17%/min) is the same as non-anaemic patients with normal flow, suggesting a complex compensatory relationship.
- Data Reliability: It’s important to note the much smaller sample sizes for the anaemic groups, especially the anaemic slow flow group (n=10), which might make these results less reliable than those from the larger non-anaemic normal flow group (n=251). Other factors like patient diet, activity levels, or overall health could also influence these results.
▶️ Answer/Explanation
(a)(i) C (protein)
Explanation: The outer coat or capsid of a virus is primarily made up of protein subunits called capsomeres. This protein coat protects the viral genetic material inside (which, in this case, is RNA). Cellulose (A) is a polysaccharide that makes up plant cell walls. Chitin (B) is a polysaccharide found in the exoskeletons of insects and fungal cell walls. Starch (D) is a carbohydrate storage molecule in plants. Viruses do not contain these substances in their structure.
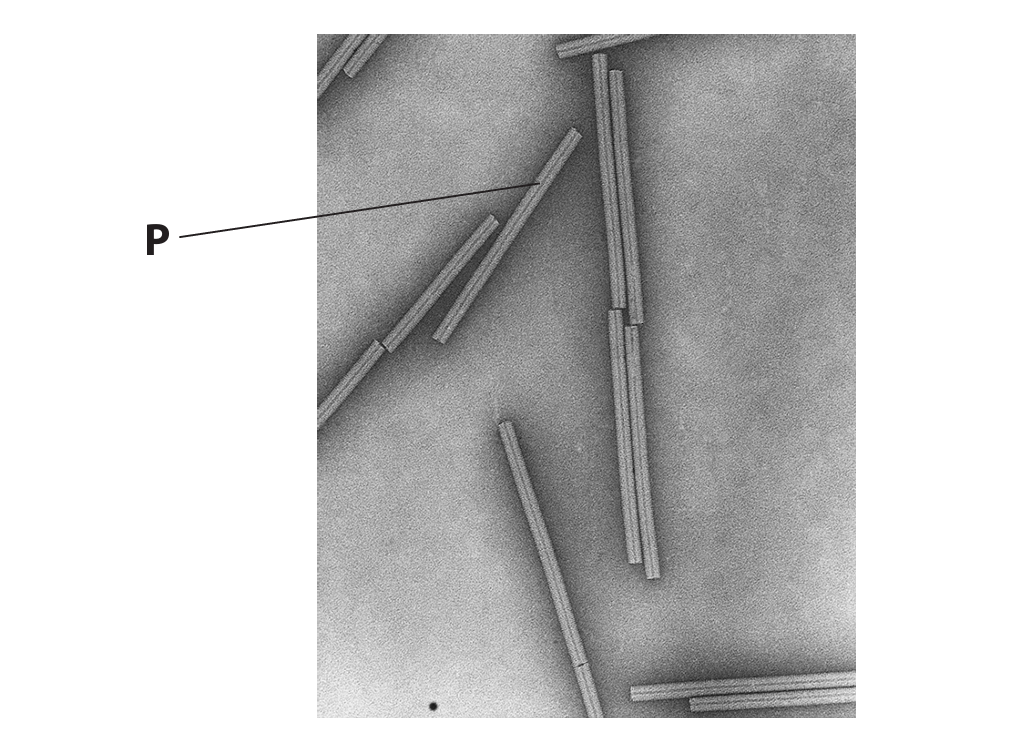
(a)(ii) Magnification = × 76,700 (or approximately × 77,000)
Explanation: To calculate magnification, we use the formula:
Magnification = Size of Image ÷ Size of Real Object
First, measure the length of the virus particle in the photograph (the image size). Assuming the measured length is 23 mm (this value can vary slightly between 22–24 mm).
Convert to micrometers (μm): 23 mm = 23,000 μm.
Actual size = 0.3 μm.
Magnification = 23,000 μm ÷ 0.3 μm ≈ 76,667.
Therefore, magnification ≈ × 76,700 (or × 77,000 rounded).
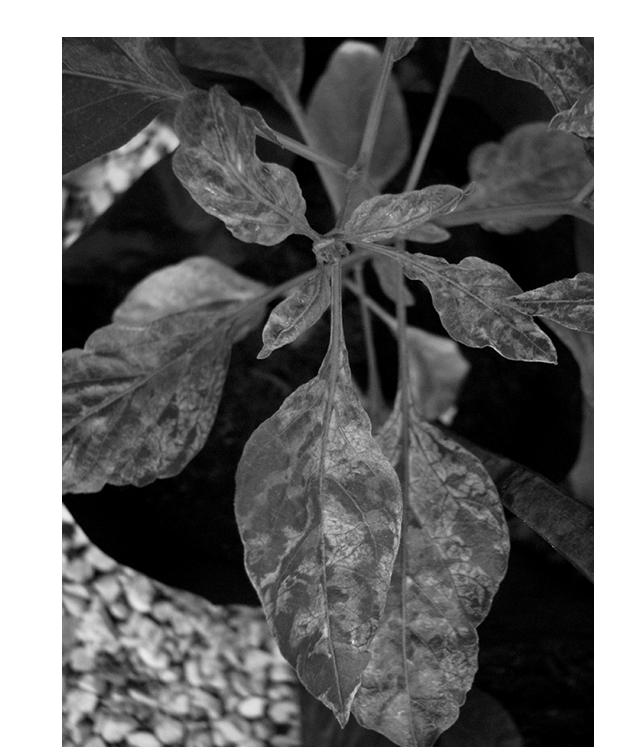
(b) Infected plants grow more slowly due to a cascade of effects caused by the virus halting chloroplast production. Chloroplasts are the organelles where photosynthesis occurs. Photosynthesis is the process that uses light energy to convert carbon dioxide and water into glucose, providing the plant with chemical energy and the building blocks for growth.
With fewer or no chloroplasts, the plant cannot perform photosynthesis effectively. This leads to a severe reduction in glucose production. Glucose is crucial for respiration (releasing energy for cellular processes) and for synthesizing starch and cellulose. A deficiency in energy and structural materials directly impedes growth.

▶️ Answer/Explanation
(a) B (6 and 12)
Explanation: Pollen grains are gametes, which are produced by meiosis. Meiosis halves the chromosome number, so a pollen grain nucleus (male gamete) from a plant with a diploid number of 12 would have a haploid number of 6 chromosomes. A root cell is a somatic (body) cell and is produced by mitosis, which maintains the chromosome number. Therefore, a root cell nucleus would have the full diploid number of 12 chromosomes.
(b) An explanation of two adaptations, each with its function:
Explanation: Wind-pollinated flowers, like those of grasses, have specific adaptations to facilitate pollen transfer by wind rather than insects. Two key adaptations are:
- Exposed Anthers: The anthers are often hanging on long, flexible filaments outside the flower. This positioning allows the wind to easily catch and blow the pollen away from the plant.
- Feathery Stigma: The stigma is often large, feathery, and hangs outside the flower. This structure provides a large surface area to effectively catch pollen grains that are drifting in the air.
Other possible adaptations include producing large quantities of light, smooth pollen grains and having small, inconspicuous petals with no nectar or scent, as they do not need to attract insects.
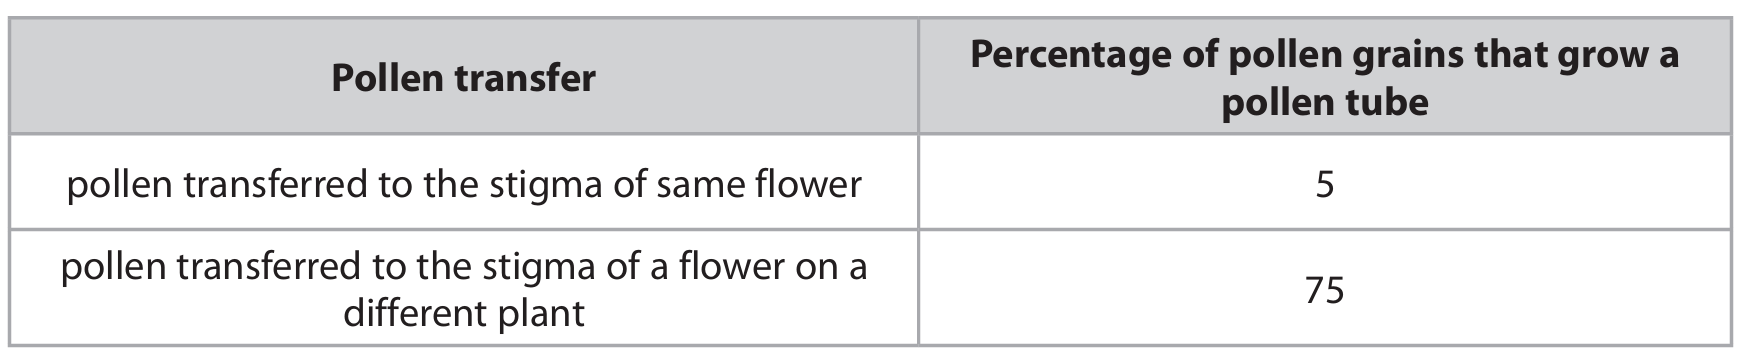
(c)(i) The percentage (or proportion/number) of pollen grains that grow a pollen tube.
Explanation: The dependent variable is what is measured in the experiment. In this case, the scientists are changing where the pollen is placed (the independent variable) and then measuring the effect this has on the success of pollen tube growth.
(c)(ii) An explanation linking cross-pollination to genetic variation and survival:
Explanation: The results show a much higher success rate for cross-pollination (75%) compared to self-pollination (5%). Cross-pollination involves the fusion of gametes from two different parent plants. This combines their different alleles, leading to greater genetic variation in the offspring. In a changing environment, this variation is crucial. Some individuals within the population are likely to possess combinations of alleles that make them better adapted to the new conditions (e.g., more resistant to a new disease or better suited to a changed climate). These individuals are more likely to survive and reproduce, passing on their advantageous alleles to the next generation. This process, natural selection, allows the species to evolve and survive over time. Self-pollination leads to less genetic variation, making the population more vulnerable if the environment changes, as seen by the low success rate.
(d)(i) Mitosis
Explanation: Asexual reproduction involves the production of genetically identical offspring from one parent. This is achieved through mitosis, a type of cell division that results in two daughter cells each having the same number and kind of chromosomes as the parent nucleus.
(d)(ii) An description of two advantages for commercial growers:
Explanation: Asexual reproduction is advantageous for commercial growers because it allows for the production of uniform crops. Since mitosis produces genetically identical clones, all the new plants will have the same desirable characteristics as the parent plant (e.g., high yield, specific fruit size, disease resistance). This ensures consistency and predictability in the harvest. Furthermore, it can be a faster method of propagation than growing from seed, allowing growers to produce large numbers of plants quickly to meet demand.


▶️ Answer/Explanation
(a)(i) A red blood cell cannot be used to show a karyotype because it lacks a nucleus. The nucleus is the organelle that contains the chromosomes. Since red blood cells in mammals are anucleated (they lose their nucleus during development to make more space for hemoglobin), they do not contain any chromosomal material that can be photographed and arranged into a karyotype.
(a)(ii) The type of cell division that occurs in white blood cells is mitosis. Mitosis is the process of nuclear division in eukaryotic cells that results in two daughter cells each having the same number and kind of chromosomes as the parent nucleus. It is the division responsible for general growth and repair in the body.
(a)(iii) The karyotype in Diagram 1 can be identified as male because the 23rd pair of chromosomes consists of one X chromosome and one Y chromosome. In humans, females have two X chromosomes (XX), while males have one X and one Y chromosome (XY). The presence of the Y chromosome is the definitive indicator of a male karyotype.
(b)(i) The key difference between the two karyotypes is the number of chromosomes. Diagram 1 (the male) shows the normal human diploid number of 46 chromosomes. Diagram 2 (the female with Turner syndrome) shows only 45 chromosomes; specifically, there is only one sex chromosome present (a single X chromosome), denoted as 45,X.
The effects of Turner syndrome on the person are significant. Due to the missing X chromosome and the resulting hormonal deficiencies (particularly oestrogen), the individual will likely not undergo normal puberty. This leads to a lack of development of secondary sexual characteristics (such as breast development). Furthermore, the ovaries are typically underdeveloped (streak ovaries) and do not produce viable eggs, making the person infertile. There can also be other health implications, such as short stature and potential heart defects.
(b)(ii) The chromosomal difference in Turner syndrome (45,X) is most commonly produced by a process called non-disjunction. This is an error that can occur during the formation of the gametes (eggs or sperm) in one of the parents. Specifically, during meiosis, the paired sex chromosomes (X and X in a female, or X and Y in a male) fail to separate properly. If an egg or sperm that lacks a sex chromosome (is nullisomic) fuses with a normal gamete containing one X chromosome, the resulting zygote will have only one X chromosome, leading to Turner syndrome.

▶️ Answer/Explanation
(a)(i) B (fungi)
Explanation: Yeast is a single-celled organism that belongs to the kingdom Fungi. Unlike bacteria (prokaryotes), yeast are eukaryotic cells. They are not plants as they do not perform photosynthesis and lack chloroplasts, and they are not protoctists, which is a kingdom typically containing diverse, often unicellular, eukaryotes that don’t fit into the other kingdoms.
(a)(ii) B (chitin)
Explanation: The cell wall of a yeast cell is primarily made of a complex carbohydrate called chitin, which is also found in the exoskeletons of insects and the cell walls of other fungi. This is different from plant cell walls, which are made of cellulose (A). Sucrose (C) is a sugar and starch (D) is a storage polysaccharide; neither are structural components of cell walls.
(b)(i) The teacher would need additional apparatus to control and measure temperature. This includes a water bath (or a beaker of water heated by a Bunsen burner) to contain the test tube and allow for precise temperature variation. A thermometer is essential to accurately measure the temperature of the yeast and glucose solution. A stopwatch or timer is also needed to measure the rate of the reaction, for example, by timing how long it takes for a colour change to occur or measuring the rate of gas production if that was being monitored.
(b)(ii) The layer of liquid paraffin acts as a seal on the surface of the glucose solution. Its purpose is to prevent oxygen from the air dissolving into the solution. This creates anaerobic conditions, ensuring that any respiration detected is anaerobic respiration (fermentation) rather than aerobic respiration. This is crucial for investigating this specific type of respiratory pathway.
(b)(iii) A suitable chemical indicator would be limewater (calcium hydroxide solution). Alternatively, hydrogencarbonate indicator could be used.
Explanation: Limewater is used to test for the product carbon dioxide (CO₂) of respiration. CO₂ turns limewater cloudy. Hydrogencarbonate indicator changes colour (from red to yellow) in the presence of increased carbon dioxide levels.
(b)(iv) Diazine green is an indicator that is blue when oxygen is present and pink when it is absent (reduced). The initial blue colour indicates there is oxygen dissolved in the solution, and the yeast is likely respiring aerobically. As the yeast cells respire, they use up the oxygen in the solution for aerobic respiration. The change in colour from blue to pink indicates that the oxygen concentration is decreasing. Once the oxygen is depleted and the solution turns pink, it shows that the yeast has switched to anaerobic respiration (fermentation) to continue producing energy.
(c) The rate of respiration in yeast changes with temperature due to the effect on enzymes, which control the metabolic reactions of respiration.
As temperature increases from a low value, the kinetic energy of the enzyme and substrate molecules increases. This causes them to move faster and collide more frequently. More collisions lead to the formation of more enzyme-substrate complexes, which increases the rate of respiration.
This increase continues up to an optimum temperature, where the respiration rate is at its maximum because enzymes are working most efficiently.
Beyond this optimum temperature, the high energy causes the hydrogen and ionic bonds that hold the enzyme’s shape to break. This alters the specific 3D shape of the enzyme’s active site. The substrate can no longer fit into the denatured active site, meaning fewer enzyme-substrate complexes can form. This causes the rate of respiration to decrease rapidly and eventually stop.
▶️ Answer/Explanation
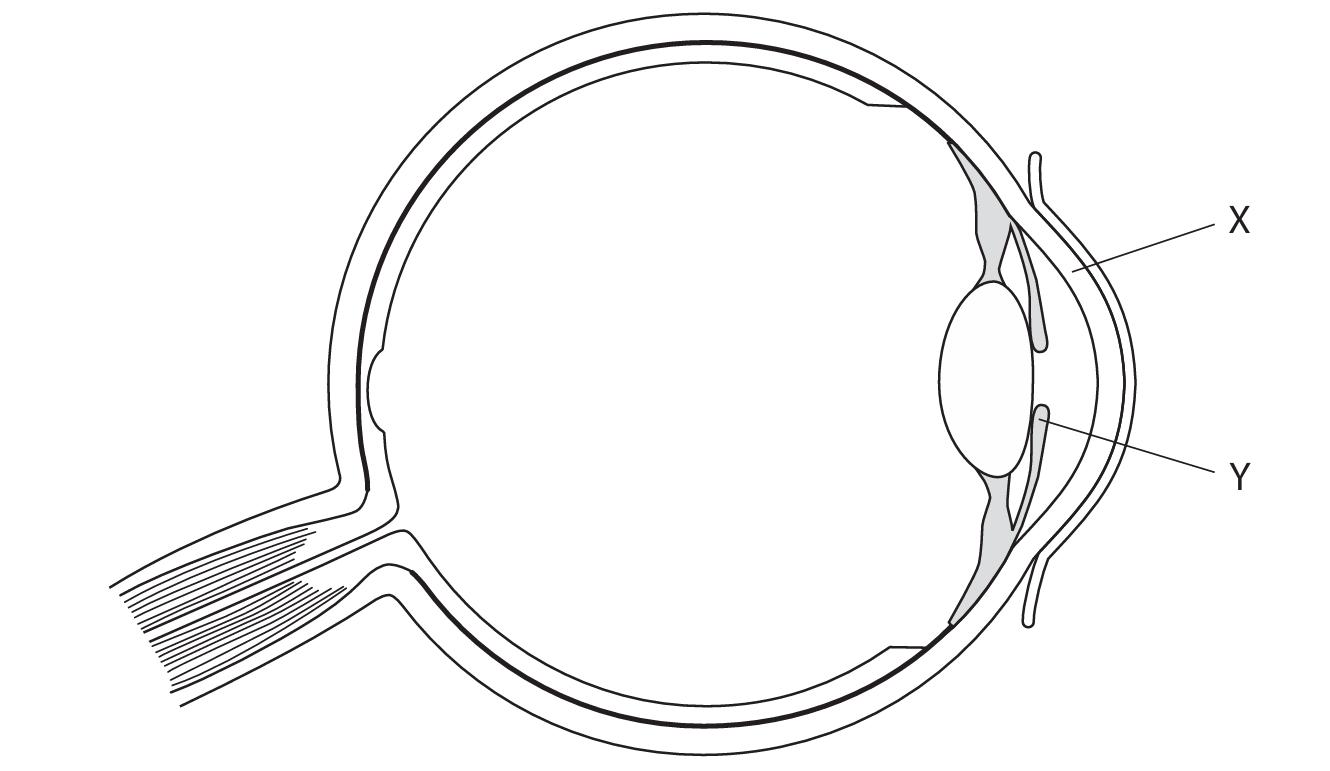
(a)(i) B – cornea
Explanation: The cornea is the transparent layer at the very front of the eye that helps to focus light. The conjunctiva is a thin membrane covering the front of the eye and inner eyelids, the lens is behind the pupil, and the retina is at the back of the eye. Structure X is at the front, identifying it as the cornea.
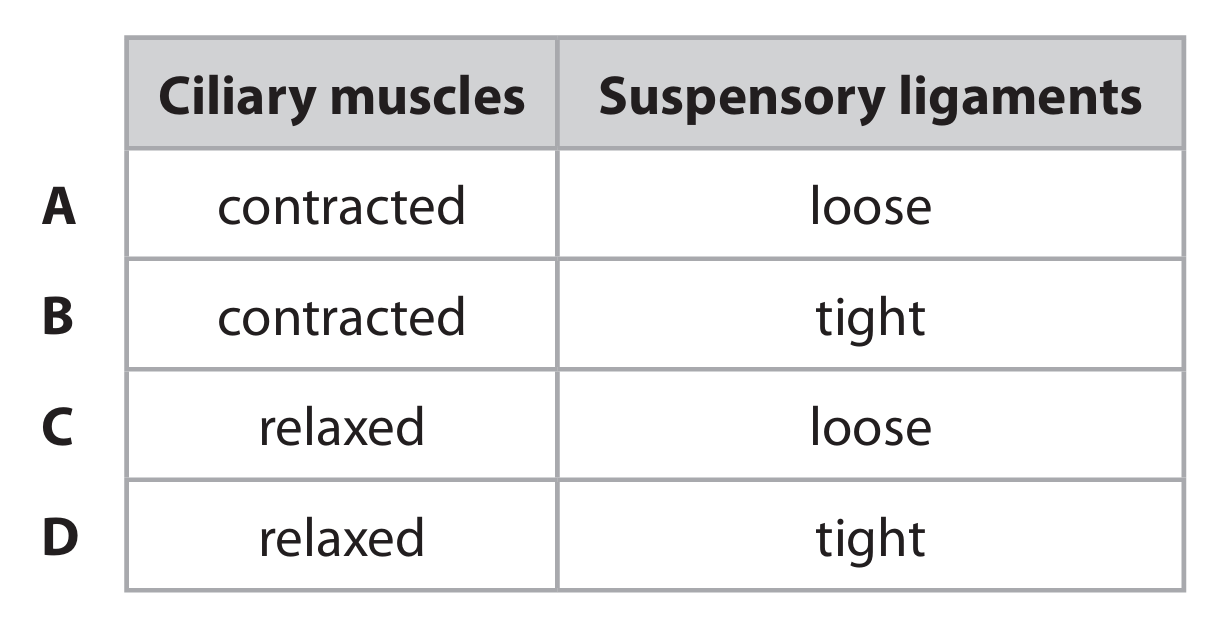
(a)(ii) A – contracted, loose
Explanation: When looking at a close object, the ciliary muscles contract. This contraction reduces the tension on the suspensory ligaments, causing them to become slack or loose. This allows the lens to become more rounded and thicker, increasing its refractive power to focus on near objects.
(a)(iii)
Explanation: Structure Y is the iris, which contains muscles that control the size of the pupil. When someone walks into a dark room, the light intensity decreases. In response, the radial muscles in the iris contract. Simultaneously, the circular muscles in the iris relax. This combined action causes the pupil to dilate (widen), allowing more light to enter the eye so that you can see better in the dim conditions.
(b)(i) 27 m/s
Explanation: First, we need to find the speed of the impulse for the person with multiple sclerosis (MS). Speed is calculated using the formula: speed = distance / time.
The total length of the neurones (distance) is 25 cm. We need to convert this to metres to match the units of the answer (m/s). 25 cm = 0.25 m.
The time taken for the impulse is 0.0050 s.
So, speedMS = distance / time = 0.25 m / 0.0050 s = 50 m/s.
The speed for a person without MS is given as 77 m/s.
The difference in speed is: 77 m/s – 50 m/s = 27 m/s.
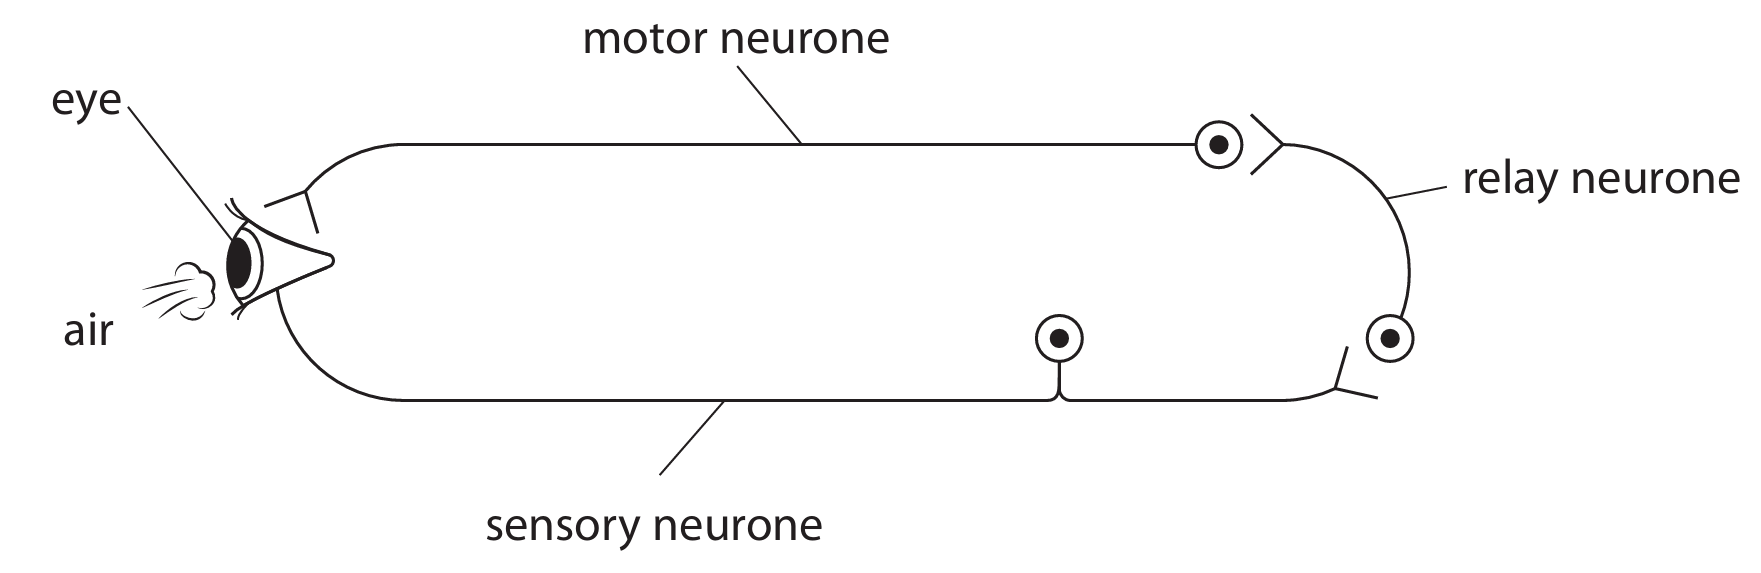
(b)(ii)
Explanation: The overall speed along the entire reflex arc (77 m/s) is slower than the speed along just the motor neurone (120 m/s) because the reflex arc includes synapses. Synapses are the junctions between neurones where impulses are transmitted using chemical messengers called neurotransmitters. This chemical diffusion process across the synaptic cleft is much slower than the electrical transmission of the impulse along a single neurone. Therefore, the presence of multiple synapses in the pathway (sensory to relay to motor) introduces delays, reducing the overall calculated speed of the reflex.

▶️ Answer/Explanation
(a)(i) A mitochondrion
Explanation: Aerobic respiration is the process that releases energy from glucose in the presence of oxygen. In eukaryotic cells, like yeast cells, this process occurs specifically in the mitochondria. The mitochondria are often called the “powerhouses” of the cell because they generate most of the cell’s supply of ATP, the energy currency. The nucleus (B) contains genetic material, the ribosome (C) is the site of protein synthesis, and the vacuole (D) is used for storage; none of these are the primary site for aerobic respiration.
(a)(ii) B chitin
Explanation: The cell wall of fungi, which includes yeast, is primarily made of a complex carbohydrate called chitin. Chitin is a strong and flexible polysaccharide that also forms the exoskeletons of insects. Cellulose (A) is the material that makes up plant cell walls. Glycogen (C) is a polysaccharide used for energy storage in animals and fungi, and starch (D) is used for energy storage in plants.
(a)(iii) A cell membrane
Explanation: Prokaryotic cells, such as bacteria, lack membrane-bound organelles. Therefore, they do not have a true nucleus (C), mitochondria (B), or vacuoles (D) like eukaryotic cells do. However, all cells, both prokaryotic and eukaryotic, are surrounded by a cell membrane (also called the plasma membrane). This phospholipid bilayer controls the movement of substances in and out of the cell and is a fundamental structure for life.
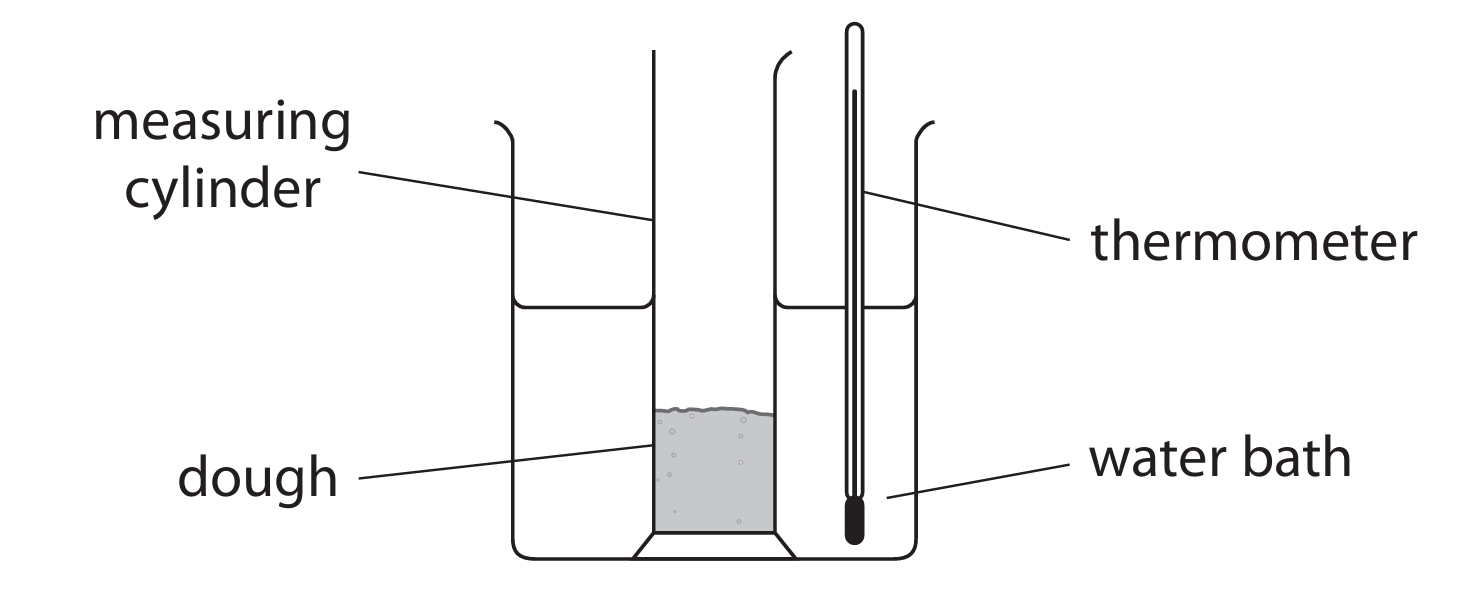
(b)(i) 80%
Explanation: The percentage increase is calculated using the formula:
\[ \text{Percentage Increase} = \left( \frac{\text{Final Value} – \text{Initial Value}}{\text{Initial Value}} \right) \times 100\]
Plugging in the values from the experiment at 35°C:
\[ \left( \frac{45 – 25}{25} \right) \times 100 = \left( \frac{20}{25} \right) \times 100 = 0.8 \times 100 = 80\%\]
So, the dough increased in height by 80% after two hours at 35°C.
(b)(ii) Yeast respires anaerobically (a process called fermentation) using the sugar in the dough as a substrate. This respiration produces carbon dioxide (\(CO_2\)) gas. The gas bubbles become trapped within the stretchy, elastic network of gluten proteins in the dough. As more and more gas is produced, these bubbles expand, causing the entire dough mixture to inflate and rise in height.
(b)(iii) Temperature affects the rate of enzyme-controlled reactions, such as respiration in yeast. At 25°C, the temperature is further from the optimum temperature for the yeast’s enzymes. The yeast cells and their enzymes have less kinetic energy, leading to fewer successful collisions between enzymes and substrates. This results in a slower rate of respiration, less carbon dioxide gas being produced, and consequently, a smaller rise in the dough (40% increase) compared to the rise at 35°C (80% increase).
(b)(iv) At 65°C, the temperature is likely too high and has denatured the enzymes in the yeast. Denaturation is a process where the enzyme’s active site changes shape permanently, and it can no longer bind to its substrate. With the enzymes denatured, respiration stops entirely or occurs at a very minimal rate. Very little carbon dioxide is produced, so the dough rises very little (only 8%). In contrast, at 35°C, the temperature is likely close to the optimum for the yeast’s enzymes, allowing for a high rate of respiration and gas production, leading to the greatest rise.
▶️ Answer/Explanation
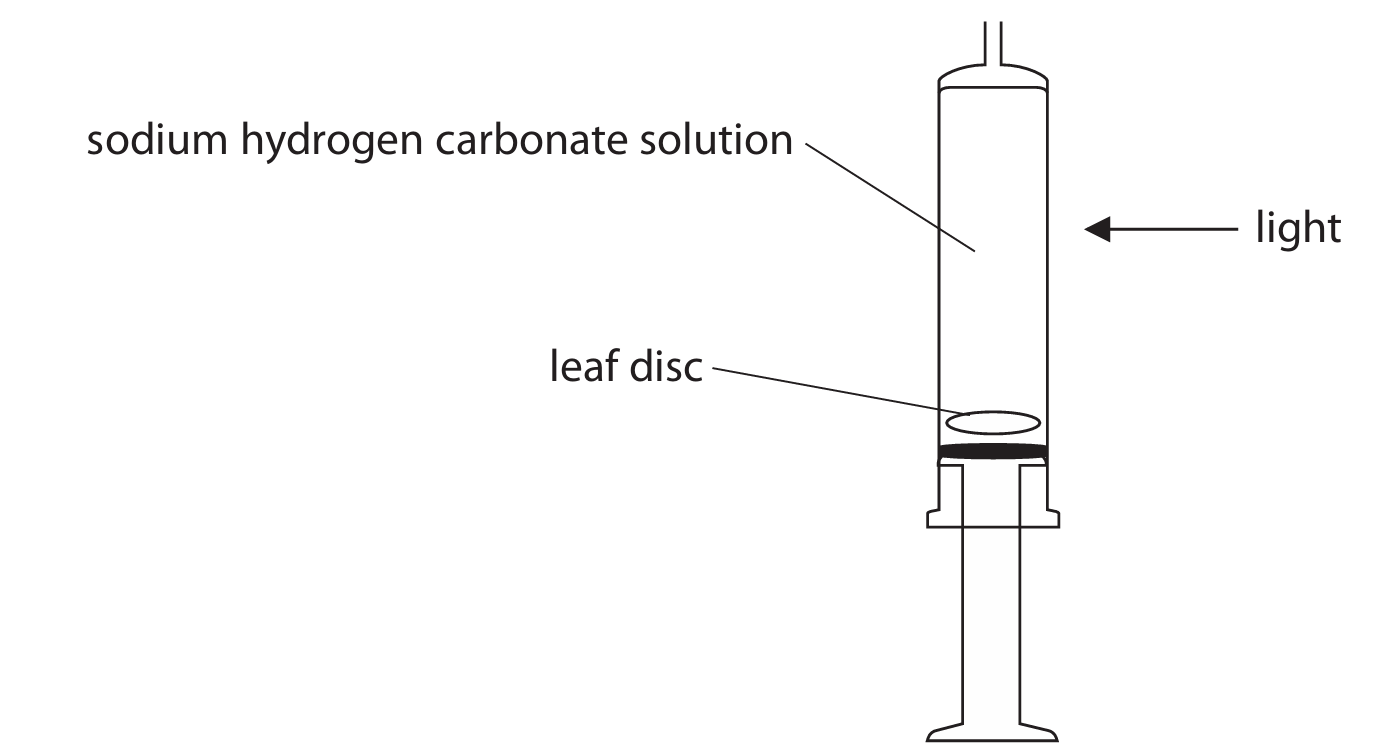
(a) \( 6CO_2 + 6H_2O \rightarrow C_6H_{12}O_6 + 6O_2 \)
Explanation: This is the balanced equation for photosynthesis. It shows that six molecules of carbon dioxide and six molecules of water, in the presence of light energy (absorbed by chlorophyll), are converted into one molecule of glucose and six molecules of oxygen. The oxygen gas produced is what causes the leaf discs to rise in the experiment.
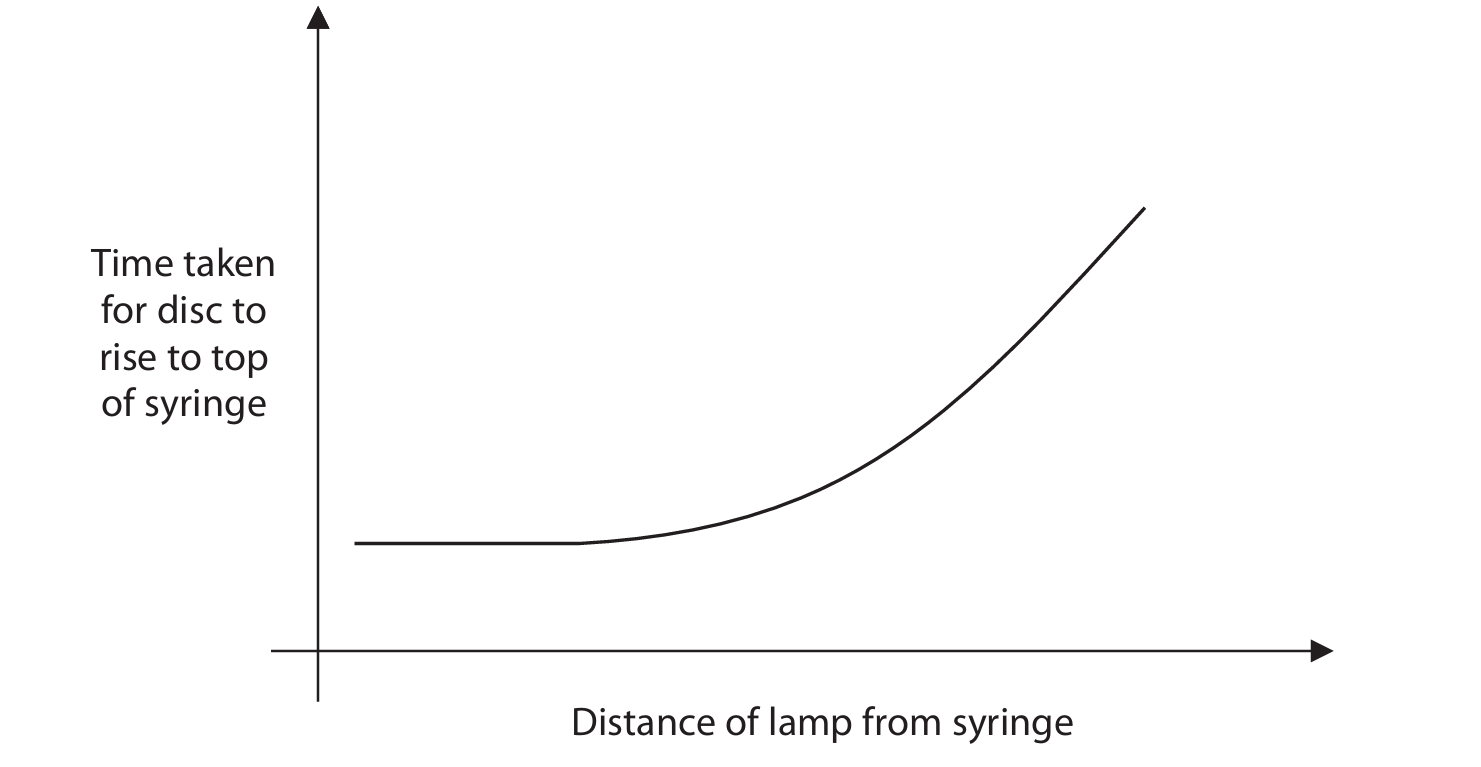
(b)(i) Repeat the experiment and calculate a mean time for each distance.
Explanation: Repeating the experiment multiple times for each lamp distance helps to identify and reduce the effect of random errors. Calculating a mean (average) time for the disc to rise at each distance provides a more reliable and accurate value than a single measurement, making the results more trustworthy.
(b)(ii) The time taken for the leaf disc to rise.
Explanation: The dependent variable is what is measured in the experiment. In this case, the student is changing the independent variable (the distance of the lamp, which affects light intensity) and measuring how this change affects the time it takes for the disc to rise to the top of the syringe.
(c) As the distance of the lamp increases, the time taken for the leaf disc to rise increases.
Explanation: This happens because light intensity is inversely proportional to the square of the distance (Inverse Square Law). So, as the lamp is moved further away, the light intensity reaching the leaf disc decreases significantly. A lower light intensity means the rate of photosynthesis slows down. Photosynthesis produces oxygen gas. A slower rate of photosynthesis means oxygen is produced more slowly. The oxygen gas becomes trapped in the leaf’s air spaces, increasing its buoyancy and causing it to rise. If oxygen is produced more slowly, it takes longer for enough gas to accumulate to make the disc buoyant enough to rise. At very close distances (high light intensity), the rate of photosynthesis might be limited by another factor, such as carbon dioxide concentration or temperature, which is why the graph may level off or the time may not decrease infinitely.
(d)
- Place the leaf disc in boiling water for about one minute. This kills the leaf and stops all chemical reactions.
- Transfer the leaf to a test tube containing ethanol (alcohol). Heat the test tube in a water bath (e.g., a beaker of hot water) until the leaf loses its green colour (the chlorophyll is extracted into the ethanol). This step decolorizes the leaf, making the colour change easier to see.
- Rinse the decolorized leaf in warm water to soften it and remove the ethanol. Place the leaf on a white tile and add a few drops of iodine solution.
- If starch is present, the area where the iodine is added will turn blue-black. If no starch is present, the area will remain a yellowish-brown colour.
Explanation: This is the standard iodine test for starch. The process is necessary to break down the cell membranes (boiling), remove the masking green pigment (ethanol), and then apply the iodine reagent. Iodine reacts with starch to produce a characteristic blue-black colouration, indicating that photosynthesis has occurred and glucose has been converted into stored starch.


▶️ Answer/Explanation
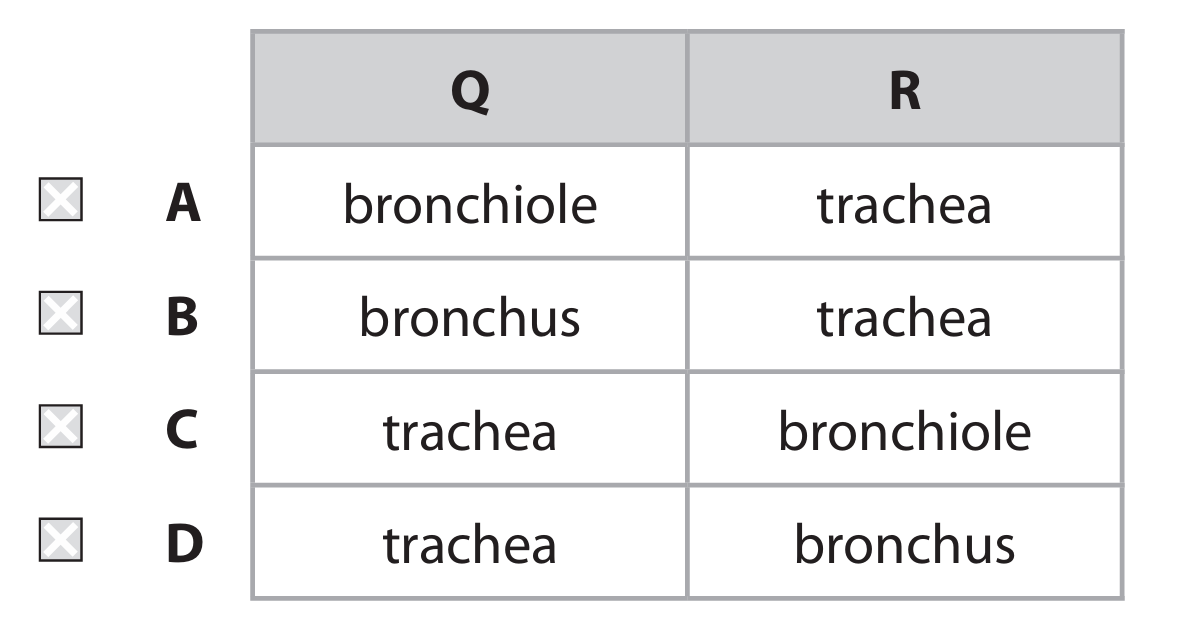
(a) (i) D
Explanation: Structure Q is the trachea (windpipe), which is the main airway leading from the larynx to the bronchi. Structure R is a bronchus (plural: bronchi). The trachea splits into two main bronchi, one leading to each lung. Option A is incorrect because Q is not a bronchiole (which are smaller branches) and R is not the trachea. Option B is incorrect because while R is the trachea, Q is a bronchus, not a bronchiole. Option C is incorrect because while Q is the trachea, R is a bronchus, not a bronchiole.
(a) (ii)
Explanation: Structure S is the diaphragm. During exhalation, the diaphragm relaxes. As it relaxes, it moves upwards, returning to its domed shape. This upward movement decreases the volume of the thoracic cavity (the chest). According to the principles of gas pressure, when the volume of a container decreases, the pressure inside it increases. This increased pressure in the lungs forces air out down the pressure gradient, from the high pressure in the lungs to the lower pressure of the outside atmosphere.
(b)
Explanation: The graph shows that a person with lung disease has a significantly lower vital capacity (the maximum volume of air they can exhale) and a slower rate of exhalation compared to a healthy person. This is often due to conditions like asthma or COPD which cause the airways to become narrowed or obstructed. The narrowed airways make it physically harder to move air out of the lungs quickly and completely. This means that during exercise, the person cannot expel carbon dioxide or take in fresh oxygen efficiently. The build-up of CO₂ and lack of O₂ leads to a low oxygen level in the blood (hypoxia) and a high carbon dioxide level. The body perceives this distress, triggering feelings of breathlessness (dyspnea) to make the person slow down and breathe more. Because their respiratory system cannot meet the increased oxygen demand of their muscles during exercise, they become fatigued very quickly and are unable to sustain physical activity.
▶️ Answer/Explanation
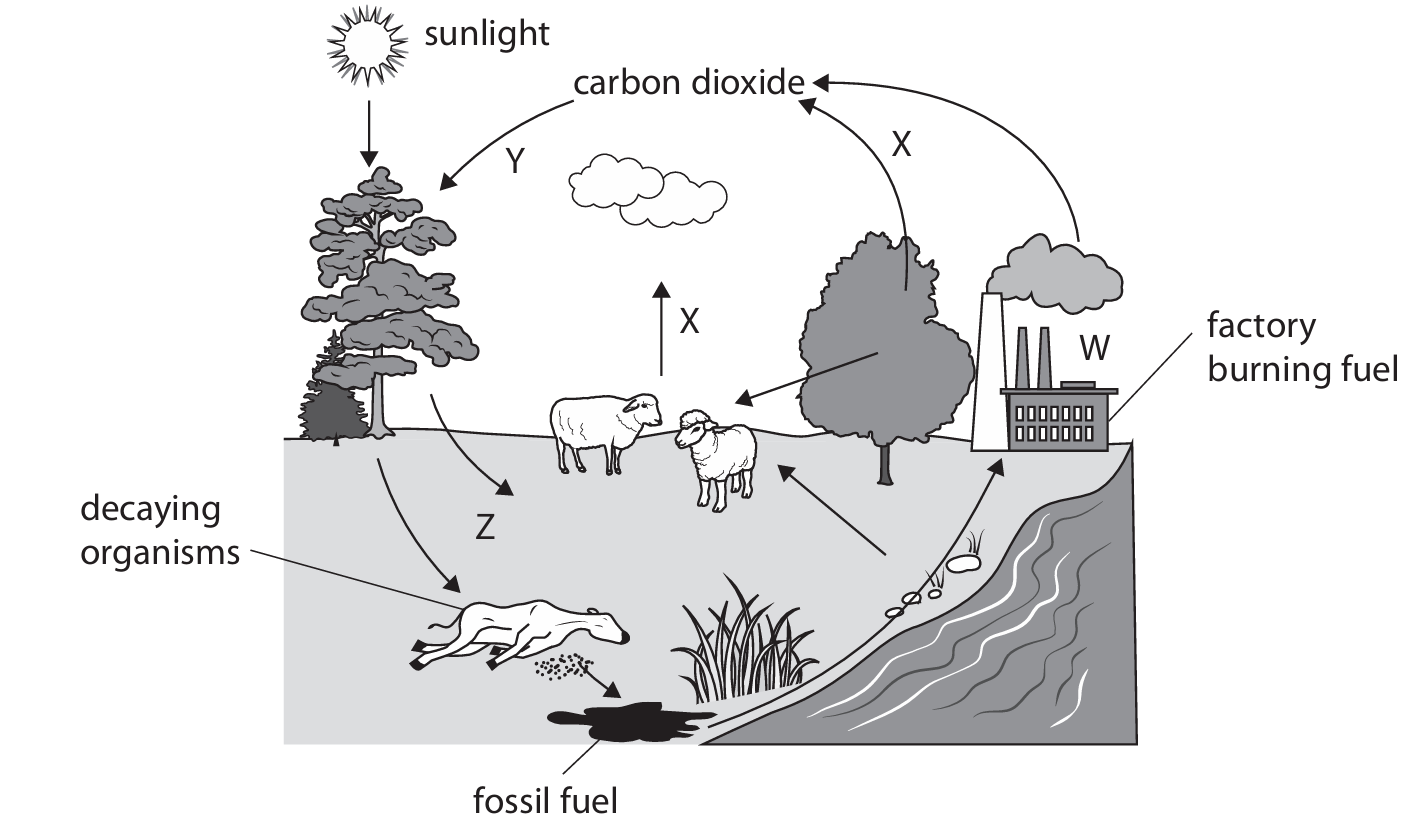
(a) Carbon cycle.
Explanation: The diagram depicts the movement of carbon between the atmosphere, organisms, and the Earth, which is the fundamental process of the carbon cycle. Carbon is exchanged between reservoirs such as the atmosphere (as CO2), living organisms, fossil fuels, and decomposing matter.
(b)(i) A (combustion)
Explanation: The letter W points to the process where a factory is burning fuel. This is a classic representation of combustion, a process where organic material (like fossil fuels) is burned, reacting with oxygen to release carbon dioxide back into the atmosphere.
(b)(ii) D (respiration)
Explanation: The letter X is likely pointing from the decaying organisms or the general biosphere to the CO2 in the atmosphere. This represents respiration, the process by which living organisms (including decomposers) break down organic molecules to release energy, producing carbon dioxide as a waste product.
(c) Bacteria or Fungi.
Explanation: Decomposition is primarily carried out by saprophytic organisms. The two main groups responsible are bacteria (microscopic prokaryotes) and fungi (like mushrooms and moulds). These organisms secrete enzymes that break down complex organic matter in dead plants and animals into simpler substances.
(d) Investigation Design:
Hypothesis: Changing the pH of organic material will affect the rate of decomposition.
Variables:
- Independent Variable: The pH of the organic material environment. This will be changed by adding different buffers, acids, or alkalis to separate samples.
- Dependent Variable: The rate of decomposition. This can be measured by the change in mass of the organic material over a fixed period (e.g., one week) or by the volume of carbon dioxide produced.
- Control Variables (to be kept constant):
- Type and mass of organic material: Use the same plant material (e.g., 10g of chopped lettuce leaves) for all samples.
- Temperature: Incubate all samples in an incubator or water bath at a constant temperature (e.g., 25°C).
- Moisture level: Ensure all samples have the same amount of water.
- Oxygen availability: Use containers that allow air exchange or seal them if investigating anaerobic decomposition.
- Time: Measure the change after the same duration for all samples.
- Microorganism population: Ideally, add a standardised amount of decomposer inoculum (e.g., soil extract) to each sample to ensure a similar starting population of bacteria/fungi.
Method:
- Prepare several identical containers (e.g., conical flasks).
- Add equal masses of the same organic material to each container.
- Prepare solutions at different pH values (e.g., pH 3, pH 5, pH 7 (neutral control), pH 9, pH 11) using buffers.
- Add the same volume of a different pH solution to each container, ensuring the organic material is moistened.
- Add a standard amount of decomposer inoculum (e.g., 1 cm³ of soil suspension) to each container.
- Seal the containers with a bung holding a tube leading to a gas syringe (to measure CO2) or use cotton wool plugs to allow air exchange if measuring mass loss.
- Place all containers in the same constant temperature environment.
- If measuring mass loss, weigh each container at the start and then after a fixed period (e.g., 7 days). Calculate the percentage mass loss for each pH. If measuring CO2, record the volume in the gas syringe at regular intervals.
- Repeat the entire experiment to ensure reliability.
Expected Analysis: Plot a graph of rate of decomposition (mass loss or CO2 production) against pH. This will show if there is an optimal pH for decomposition (likely near neutral for most soil bacteria) and how acidic or alkaline conditions slow it down.

▶️ Answer/Explanation
(a)(i) D
Explanation: The nucleus is the control center of the cell, containing genetic material. In the diagram, structure D is correctly identified as the nucleus. The other options are incorrect: A is the vacuole, B is the cytoplasm, and C is the cell membrane.
(a)(ii) A
Explanation: Human white blood cells do not contain a large, permanent vacuole, which is a characteristic feature of plant cells. Structure A represents the vacuole. The other structures – cytoplasm (B), cell membrane (C), and nucleus (D) – are all present in human white blood cells.
(a)(iii) D
Explanation: Starch is the main storage carbohydrate in plant cells, including root cells. Glucose (A) is a simple sugar used for energy, not storage. Glycerol (B) is a component of lipids, not a carbohydrate. Glycogen (C) is the storage carbohydrate in animal and fungal cells, not plants.
(b) magnification = ×400
Explanation: To calculate magnification, we use the formula:
Magnification = Image Size ÷ Actual Size
First, we measure the image width (from P to Q) in the diagram. Let’s assume the measured length is 50 mm.
Next, we convert the actual width from micrometers to millimeters for consistent units:
125 μm = 125 ÷ 1000 = 0.125 mm
Alternatively, we can convert the image size to micrometers:
50 mm = 50 × 1000 = 50,000 μm
Now we apply the formula:
Magnification = 50 mm ÷ 0.125 mm = 400
Or:
Magnification = 50,000 μm ÷ 125 μm = 400
Therefore, the magnification of the diagram is ×400.
▶️ Answer/Explanation
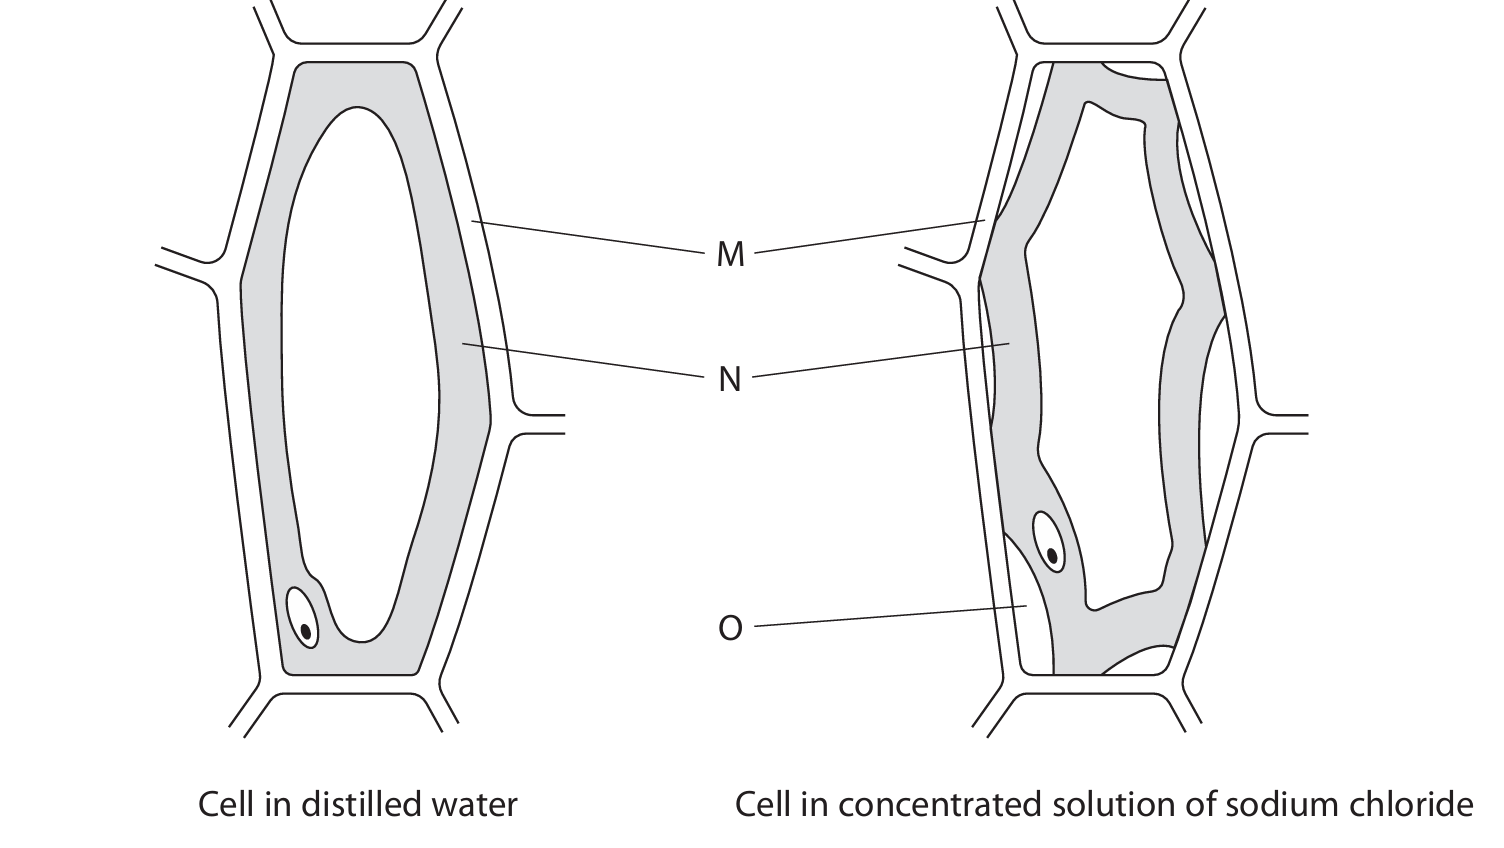
(a)(i) B cell wall
Explanation: Structure M is the rigid outer layer that maintains the cell’s shape. In both diagrams, this structure remains unchanged, which is characteristic of the cell wall. The cell wall provides structural support and prevents the cell from bursting, unlike the cell membrane which is more flexible.
(a)(ii) C cytoplasm
Explanation: Structure N is the gel-like substance inside the cell where most cellular activities occur. It contains the cell organelles and is enclosed by the cell membrane. In the cell placed in concentrated sodium chloride solution, the cytoplasm appears to have shrunk away from the cell wall, which is a key observation in this experiment.
(b)(i) Sodium chloride (solution) / salt solution / bathing solution
Explanation: The gap labelled O appears when a plant cell is placed in a hypertonic solution (like concentrated sodium chloride). This gap contains the external solution that the cell was bathed in, which in this case is the sodium chloride solution. The cell loses water to this external solution through osmosis.
(b)(ii)
Explanation: The differences occur due to osmosis – the movement of water across a partially permeable membrane from a region of higher water potential to a region of lower water potential.
In distilled water (a hypotonic solution):
- Water enters the cell by osmosis because the distilled water has higher water potential than the cell contents
- The cytoplasm pushes against the cell wall, making the cell appear turgid (swollen and firm)
- The cell membrane remains pressed against the cell wall
In concentrated sodium chloride solution (a hypertonic solution):
- Water leaves the cell by osmosis because the salt solution has lower water potential than the cell contents
- The cytoplasm shrinks away from the cell wall, creating a gap (O)
- The cell becomes plasmolysed (flaccid and shrunken)
- This process is called plasmolysis and demonstrates the movement of water out of the cell
(c)
Explanation: To investigate how different salt concentrations affect plant cells, you could conduct the following experiment:
- Obtain thin epidermal layers from onion or rhubarb stem – these are ideal because they’re only one cell thick and transparent
- Prepare several different concentrations of sodium chloride solution (e.g., 0%, 2%, 5%, 10%) using distilled water and sodium chloride crystals
- Place equal volumes of each concentration into separate watch glasses or petri dishes
- Add a piece of epidermal tissue to each solution and leave them all for the same amount of time (e.g., 15 minutes)
- Remove each tissue sample and mount on microscope slides
- Observe each slide under a microscope at medium magnification
- Draw or photograph the cells to record their appearance
- Compare the degree of plasmolysis in each concentration – cells in higher salt concentrations will show more shrinkage
This experiment would clearly demonstrate that as salt concentration increases, more water leaves the cells by osmosis, causing increasing plasmolysis.
▶️ Answer/Explanation
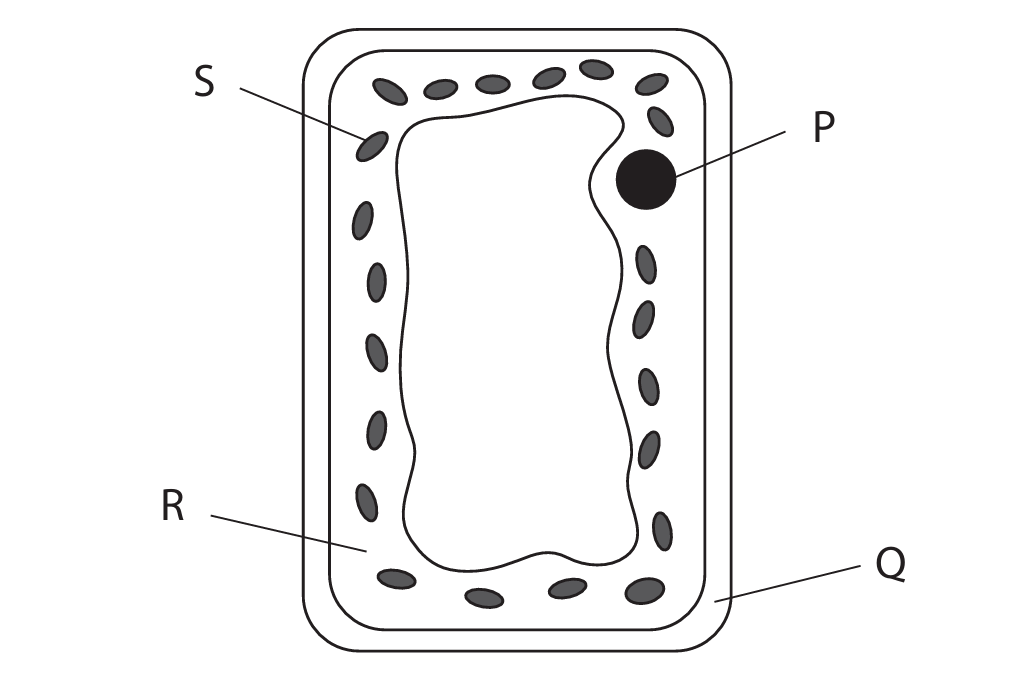
1 (a)(i) D S
Explanation: In plant cells, chlorophyll is found in the chloroplasts, which are represented by structure S in the diagram. Chloroplasts are the organelles responsible for photosynthesis and contain the green pigment chlorophyll that captures light energy.
1 (a)(ii) C magnesium
Explanation: Chlorophyll molecules contain magnesium ions at their center. The magnesium atom is coordinated to four nitrogen atoms in the porphyrin ring structure of chlorophyll, which is essential for its light-absorbing properties during photosynthesis.
1 (a)(iii) Chlorophyll absorbs/traps light energy for photosynthesis to produce carbohydrates.
Detailed Explanation: Chlorophyll plays a crucial role in photosynthesis by absorbing light energy, primarily from the blue and red regions of the visible spectrum. This absorbed light energy is then converted into chemical energy through the process of photosynthesis. During photosynthesis, carbon dioxide and water are converted into glucose and oxygen using this captured energy. The glucose produced can then be used by the plant for energy or converted into starch for storage.
1 (b) C a plant stem growing towards light
Explanation: Positive phototropism refers to the growth movement of a plant part toward a light source. Plant stems exhibit positive phototropism as they grow toward light, which maximizes their exposure to sunlight for photosynthesis. This directional growth is controlled by the hormone auxin, which accumulates on the shaded side of the stem, causing those cells to elongate more rapidly.
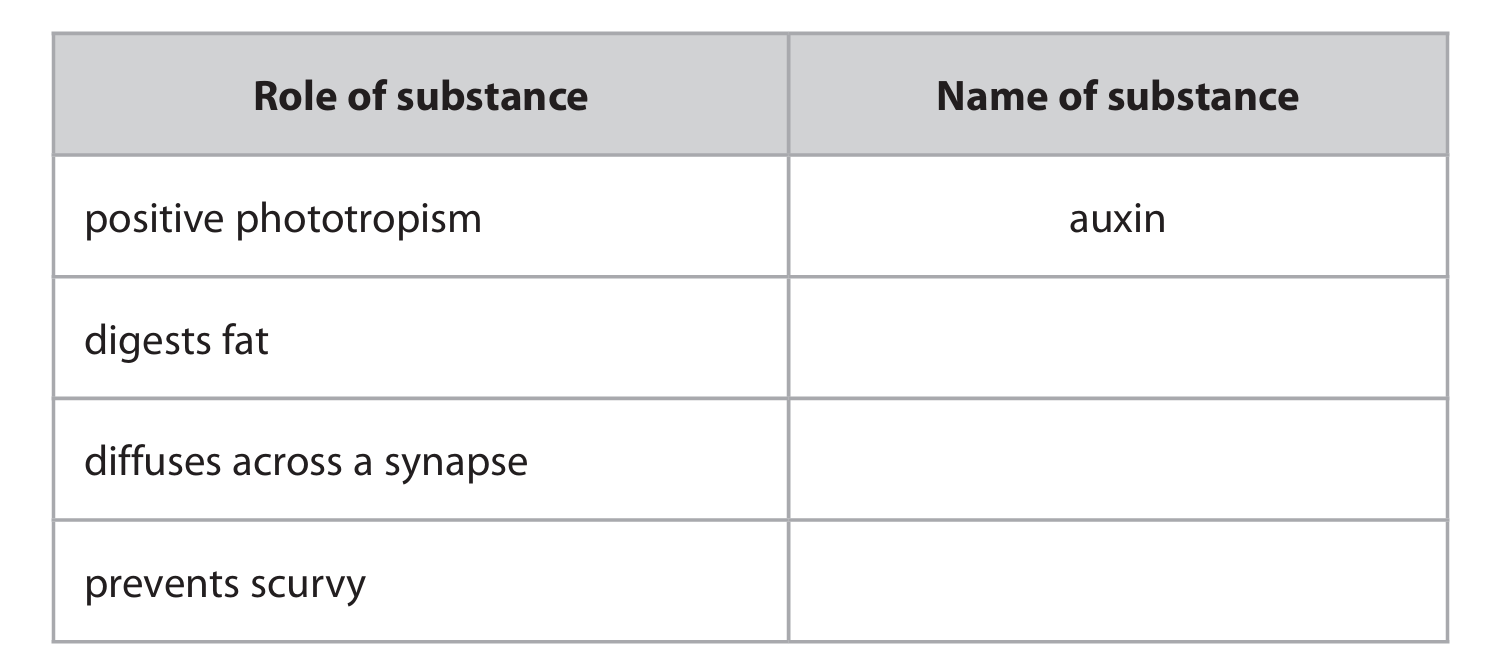
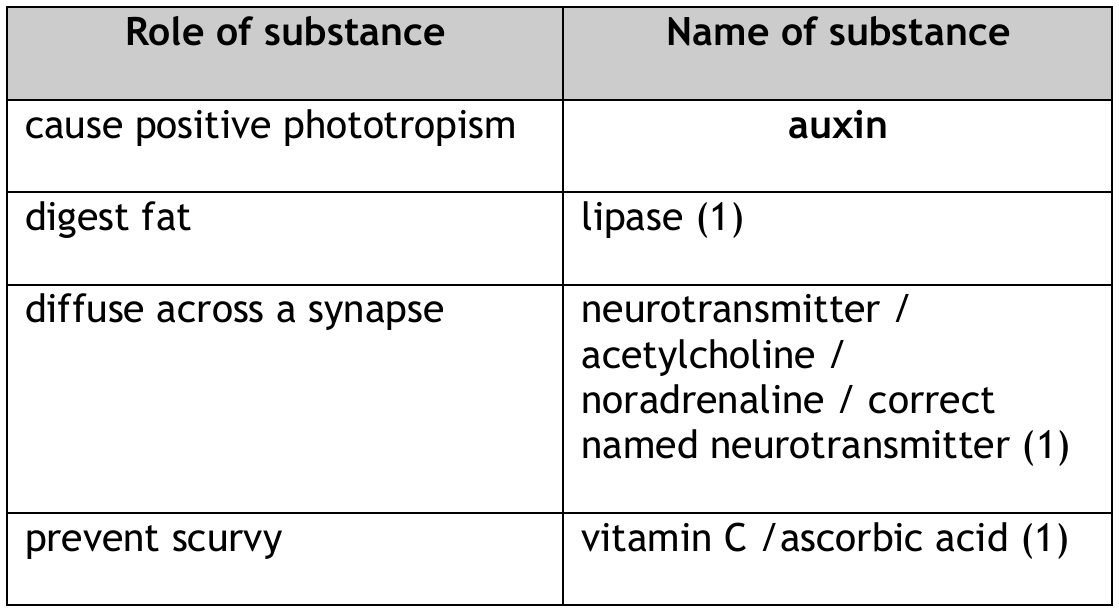
1 (c)
Detailed Explanation:
Lipase is an enzyme that breaks down fats (lipids) into fatty acids and glycerol during digestion. It’s produced by the pancreas and works in the small intestine.
Neurotransmitter is a chemical messenger that diffuses across the synaptic cleft (the gap between neurons) to transmit nerve impulses from one neuron to another. Examples include acetylcholine and noradrenaline.
Vitamin C (ascorbic acid) is essential for preventing scurvy, a disease characterized by bleeding gums, joint pain, and fatigue. Vitamin C is necessary for collagen synthesis, which is important for maintaining healthy connective tissues.
▶️ Answer/Explanation
(a) Plasma transports substances such as glucose from the intestine or liver to body cells, amino acids from the ileum or liver to body cells, fatty acids, vitamins, and minerals from the intestine to cells, hormones from endocrine glands to target organs, urea from the liver to the kidneys, carbon dioxide from cells to the lungs, antibodies to infection sites, and clotting proteins like fibrinogen to wounds.
Explanation: Plasma, the liquid component of blood, acts as a transport medium. It carries dissolved nutrients like glucose and amino acids from the digestive system to cells throughout the body for energy and growth. It also transports waste products: carbon dioxide from tissues to the lungs for exhalation, and urea from the liver to the kidneys for excretion. Hormones, chemical messengers produced by endocrine glands, travel in plasma to their target organs to regulate bodily functions. Additionally, plasma proteins have specific roles: antibodies help fight infection, and clotting proteins are essential for wound healing.
(b)(i) Magnification = approximately 4615
Explanation: To calculate magnification, you divide the measured diameter of the cell in the diagram by its actual diameter. Assuming the diagram’s cell diameter is measured as 60 mm (or 6 cm), the calculation is: Magnification = 60 mm / 0.013 mm ≈ 4615. This means the cell is drawn about 4615 times larger than its actual size. (Note: The exact value depends on the measured diagram diameter, and answers between 4307 and 4616 are typically accepted).
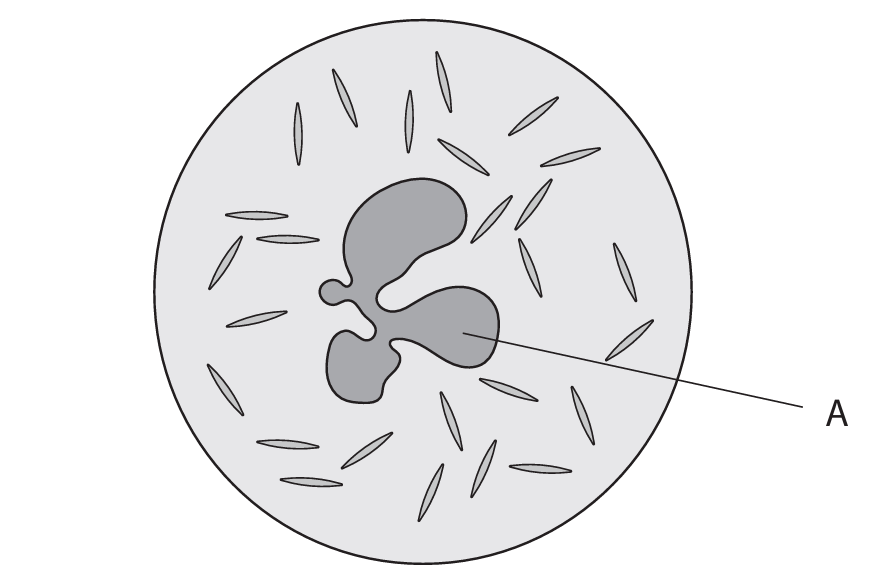
(b)(ii) Nucleus
Explanation: The structure labelled A is the nucleus. In a phagocyte (a type of white blood cell), the nucleus is often lobed or has multiple parts, which helps the cell to squeeze through small gaps in capillary walls to reach sites of infection.
(b)(iii) The phagocyte engulfs pathogens and digests them.
Explanation: Phagocytes defend the body by a process called phagocytosis. They first recognize and move towards foreign invaders like bacteria (a process called chemotaxis). Then, they extend their cell membrane around the pathogen to engulf it, forming a vesicle called a phagosome inside the cell. This phagosome then fuses with a lysosome, which contains powerful digestive enzymes. These enzymes break down and destroy the engulfed pathogen, effectively neutralizing the threat.
(c) Use the Biuret test.
Explanation: To test for the presence of protein in a plasma sample, you would use the Biuret test. This involves adding a solution of sodium hydroxide (NaOH) to the sample to make it alkaline, followed by a few drops of copper(II) sulfate solution. If protein is present, the mixture will change color from blue to a purple or violet hue. A positive Biuret test (the color change) confirms the presence of peptide bonds, which are characteristic of proteins. Alternatively, a test strip like an Albustix could be used, which also changes color in the presence of protein.
▶️ Answer/Explanation
(a) B 1
Explanation: Human sperm cells are gametes produced by meiosis. They contain half the number of chromosomes (23) compared to body cells. Sex chromosomes in sperm can be either X or Y. The maximum number of X chromosomes a sperm can carry is therefore 1. If a sperm carries an X chromosome, the resulting offspring will be female (XX); if it carries a Y chromosome, the offspring will be male (XY). A sperm cannot have 0, 2, or 23 X chromosomes.
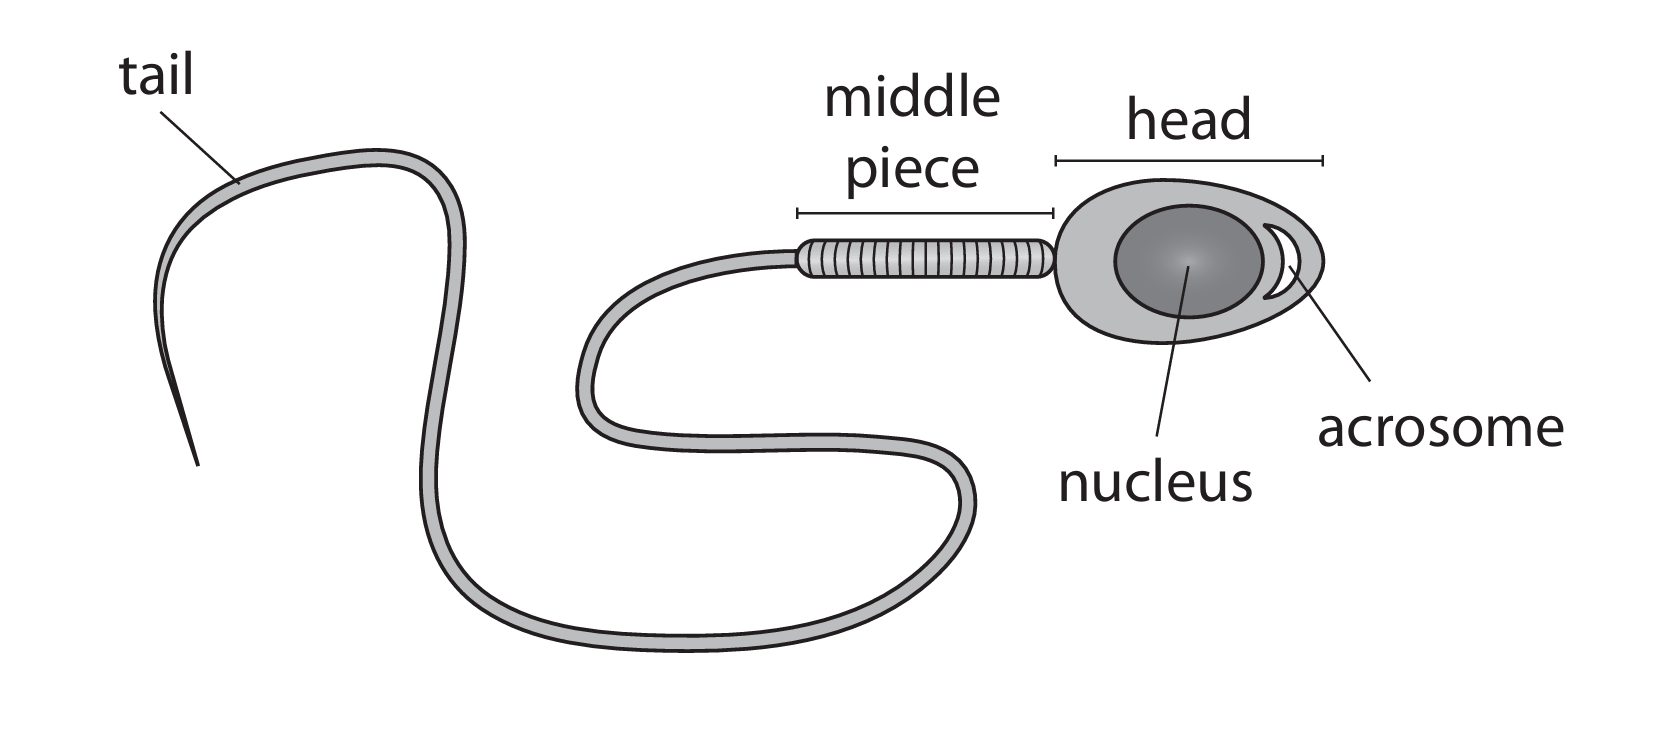
(b) The mitochondria in the middle piece provide the energy (in the form of ATP) required for the movement of the tail, enabling the sperm to swim towards the egg.
Explanation: The tail of the sperm is a flagellum whose movement is essential for propulsion through the female reproductive tract. This movement is an active process that requires a significant amount of energy. Mitochondria are the organelles responsible for aerobic respiration, where they break down energy-rich molecules to produce ATP (adenosine triphosphate). The ATP generated then fuels the motor proteins in the tail, allowing it to beat and propel the sperm forward in its journey to reach and fertilize the egg.
(c) The acrosome digests or breaks down the outer layers of the egg cell (the zona pellucida), allowing the sperm nucleus to penetrate and fuse with the egg nucleus for fertilization.
Explanation: The egg is surrounded by protective layers, including a thick glycoprotein layer called the zona pellucida. The acrosome, located at the tip of the sperm head, is a specialized cap-like structure filled with powerful digestive enzymes (e.g., hyaluronidase and acrosin). When the sperm reaches the egg, the acrosome releases these enzymes in a process known as the acrosome reaction. These enzymes chemically break down and dissolve a path through the zona pellucida, enabling the sperm to reach and fuse with the egg’s cell membrane, leading to fertilization.
(d) The sperm enters through the vagina, travels through the cervix into the uterus, and then moves into the oviduct (Fallopian tube) where fertilization occurs.
Explanation: The journey of the sperm is a long and challenging one. It begins when sperm are deposited in the vagina during sexual intercourse. From there, they must swim through the cervix (the opening to the uterus) and into the womb or uterus. The final and most specific part of the journey involves entering the correct oviduct (Fallopian tube). Fertilization typically takes place in the upper third of the oviduct. Only a tiny fraction of the millions of sperm released actually complete this entire route to reach the egg.

▶️ Answer/Explanation
(a)(i) A circle should be drawn around the axon terminals.
Explanation: The axon terminals are the end parts of the neurone that form synapses with the effector (e.g., a muscle). When the nerve impulse reaches the axon terminals, it triggers the release of neurotransmitters, which cross the synapse and stimulate the effector to respond.
(a)(ii) B motor
Explanation: A motor neurone carries electrical impulses from the central nervous system (CNS) to an effector, such as a muscle or gland. In this case, the neurone is part of a reflex arc that causes the finger to withdraw from the hot object, so it must be a motor neurone. Association neurones are found within the CNS, relay neurones connect sensory and motor neurones (also within the CNS), and sensory neurones carry impulses from receptors to the CNS.
(a)(iii) An explanation that makes reference to two of the following points:
- fast (1)
- no brain involvement / no thought / automatic / involuntary / eq (1)
- less damage / harm / eq (1)
Detailed Explanation: The withdrawal reflex is an involuntary and rapid response. Its main advantage is speed. Because the reflex arc bypasses the brain and involves only the spinal cord, the response happens much faster than if the brain had to process the information and decide on a response. This speed helps to minimize tissue damage by removing the finger from the harmful stimulus (the heat) as quickly as possible.
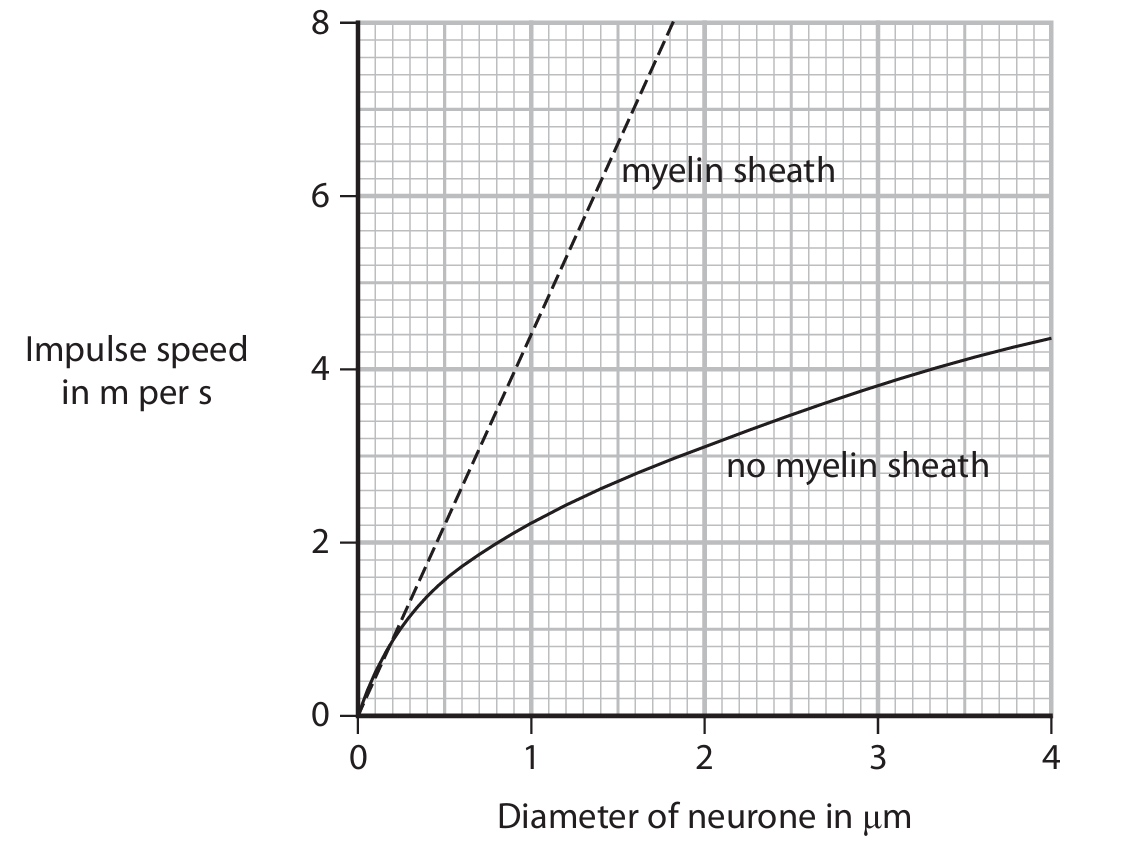
(b)(i) D wider neurones have faster impulses
Explanation: The graph shows that for both myelinated and unmyelinated neurones, as the diameter increases, the impulse speed also increases. Therefore, the conclusion that wider neurones have faster impulses is directly supported by the data. Option A is incorrect because the graph does not show that myelinated neurones are always faster (at very small diameters, the lines are close). Options B and C are not supported by the information in the graph.
(b)(ii) 4.4 m per s
Explanation: To find the speed, you locate 1.0 µm on the x-axis (Diameter of neurone). Then, you follow a vertical line up until it meets the line for “myelin sheath.” From that point, you move horizontally to the left to read the speed value on the y-axis (Impulse speed in m per s), which is 4.4 m/s.
(b)(iii) \(2.0 \times 10^{-1}\) s
Explanation: To calculate the time taken, we use the formula: \(\text{time} = \frac{\text{distance}}{\text{speed}}\).
First, ensure all units are consistent. The length is 90 cm, which is \(0.9\) m. The speed from part (b)(ii) is \(4.4\) m/s.
So, \(\text{time} = \frac{0.9}{4.4}\).
Performing the division: \(0.9 \div 4.4 = 0.204545…\) seconds.
Rounding to two significant figures (as appropriate for the data given) gives \(0.20\) seconds.
Finally, expressing \(0.20\) seconds in standard form is \(2.0 \times 10^{-1}\) s.

▶️ Answer/Explanation
(a)(i) Sickle shaped red blood cells stick to each other / caught / trapped in walls of blood vessels.
Explanation: In sickle cell anaemia, the red blood cells become rigid and crescent-shaped instead of being flexible and biconcave. These abnormally shaped cells are less flexible and can get stuck to each other or to the walls of small blood vessels. This creates blockages that restrict blood flow to various parts of the body, leading to pain and potential tissue damage.
(a)(ii) An explanation that includes:
- Cold temperatures reduce blood flow / cause more sickling
- Less oxygen at high altitude
- Less respiration / more anaerobic respiration
- More lactic acid
- Less energy / ATP
Explanation: Cold temperatures cause blood vessels to constrict, reducing blood flow and potentially triggering more red blood cells to sickle. At high altitudes, the lower oxygen concentration means less oxygen is available to tissues. This reduced oxygen supply leads to less efficient aerobic respiration in cells, forcing them to rely more on anaerobic respiration which produces lactic acid. The combination of reduced energy production (ATP) from less efficient respiration and the buildup of lactic acid exacerbates symptoms like tiredness and joint pain.
(b)(i) Only expressed when homozygous / two copies / no dominant allele present / not expressed in heterozygote.
Explanation: A recessive allele is one whose effect is masked or “hidden” when a dominant allele is present. For a recessive trait to be physically expressed in an individual, that person must inherit two copies of the recessive allele (one from each parent), making them homozygous recessive. If they have one dominant and one recessive allele (heterozygous), the dominant allele will determine the trait, and the recessive allele will not be visible but can be passed to offspring.
(b)(ii) 0.375 or 3/8 or 37.5%
Explanation: First, we need to find the probability of the child not having sickle cell anaemia. Since both parents are heterozygous (HbA Hbs), we can use a Punnett square:
Parental genotypes: HbA Hbs × HbA Hbs
Possible offspring genotypes:
- HbA HbA (normal) – 1/4 probability
- HbA Hbs (carrier, no disease) – 2/4 probability
- Hbs Hbs (sickle cell anaemia) – 1/4 probability
Probability of not having sickle cell anaemia = 1/4 + 2/4 = 3/4
Probability of being female = 1/2
Since these are independent events, we multiply the probabilities:
3/4 × 1/2 = 3/8 = 0.375 = 37.5%
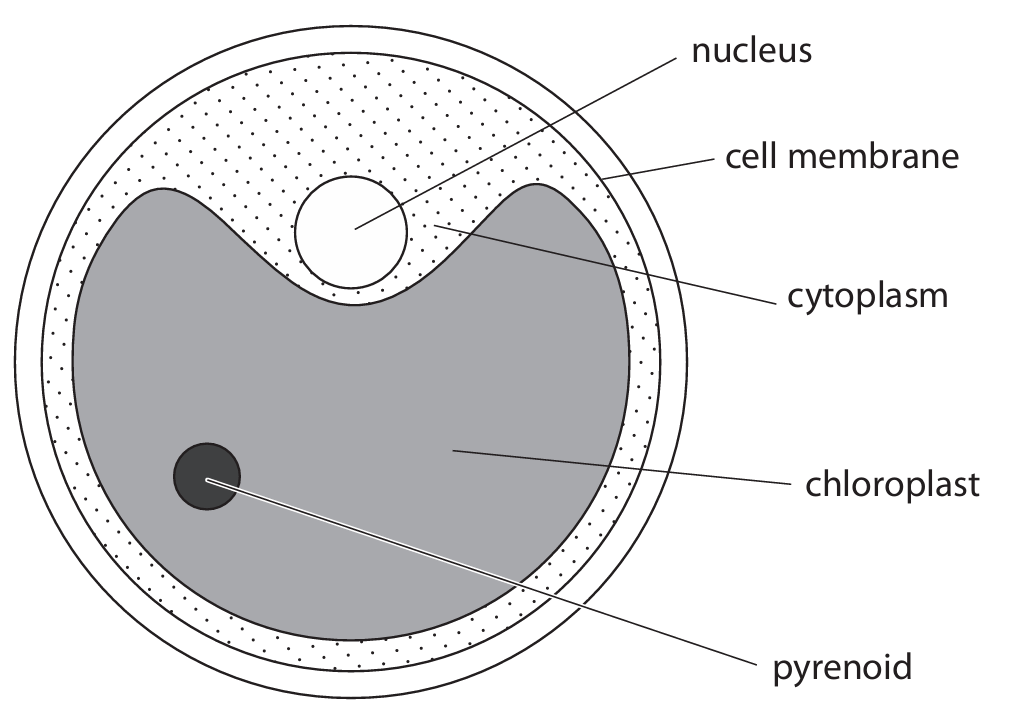
(c) D protoctist
Explanation: Malaria is caused by parasites belonging to the genus Plasmodium, which are single-celled eukaryotic organisms classified as protoctists (or protists). These are not bacteria (which are prokaryotic), fungi, or plants. The Plasmodium parasite is transmitted to humans through the bite of infected Anopheles mosquitoes.
(d) B haemoglobin
Explanation: Haemoglobin is the iron-containing protein pigment found in red blood cells that gives them their characteristic red color. Its crucial function is to bind with oxygen in the lungs and transport it to tissues throughout the body, while also helping to carry some carbon dioxide back to the lungs. Chlorophyll is found in plants, iron is a mineral component of haemoglobin but not the pigment itself, and magnesium is not the primary pigment in red blood cells.
(e) Two differences:
- Red blood cells are smaller than white blood cells
- Red blood cells have no nucleus while white blood cells do
- Red blood cells are biconcave in shape while white blood cells are spherical or irregular
Explanation: Red blood cells (erythrocytes) and white blood cells (leukocytes) have distinct structural differences that relate to their different functions. Red blood cells are smaller and lack a nucleus, which allows more space for haemoglobin and makes them more flexible for moving through narrow capillaries. Their biconcave disc shape provides a large surface area for efficient gas exchange. In contrast, white blood cells are generally larger, have a nucleus (essential for their immune functions), and can change shape to engulf pathogens or move through tissues.
▶️ Answer/Explanation
(a)(i) B (cell wall)
A is incorrect because it is not the cell membrane.
C is incorrect because it is not mitochondria.
D is incorrect because it is not the nucleus.
(a)(ii) D (starch)
A is incorrect because it is not chlorophyll.
B is incorrect because it is not glucose.
C is incorrect because it is not glycogen.
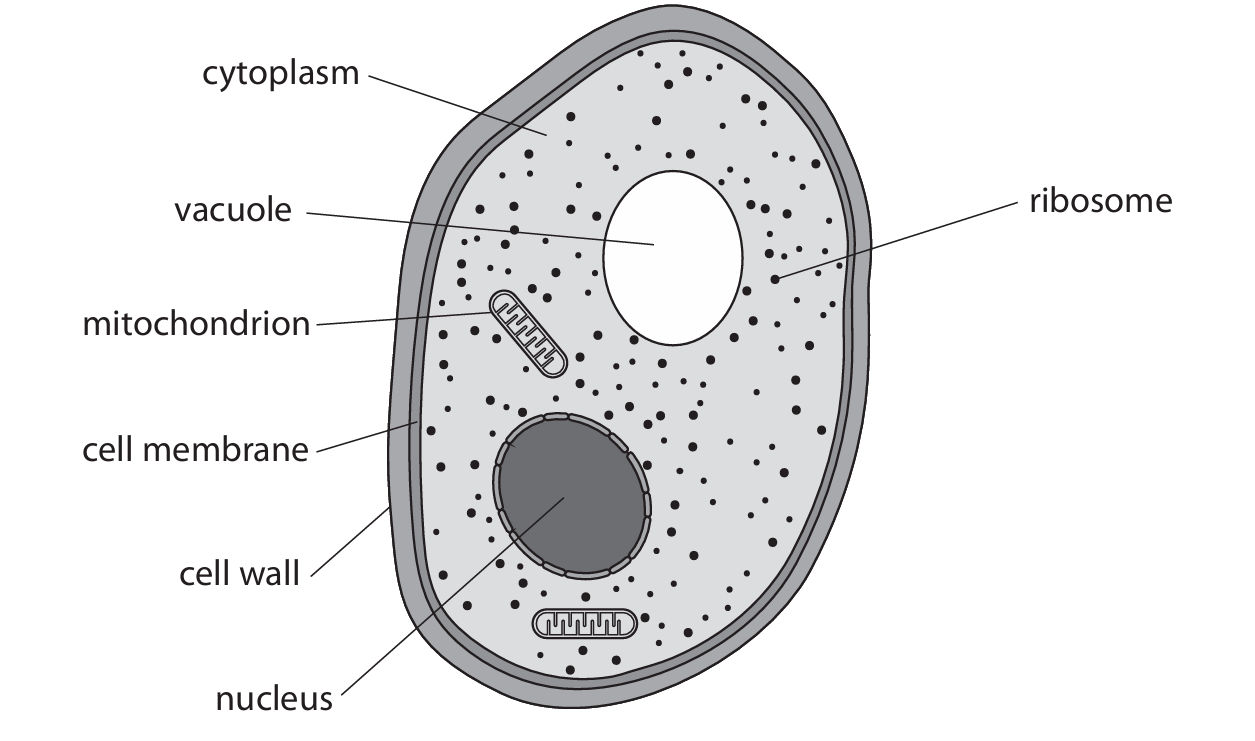
(b)(i) An answer that makes reference to the following points:
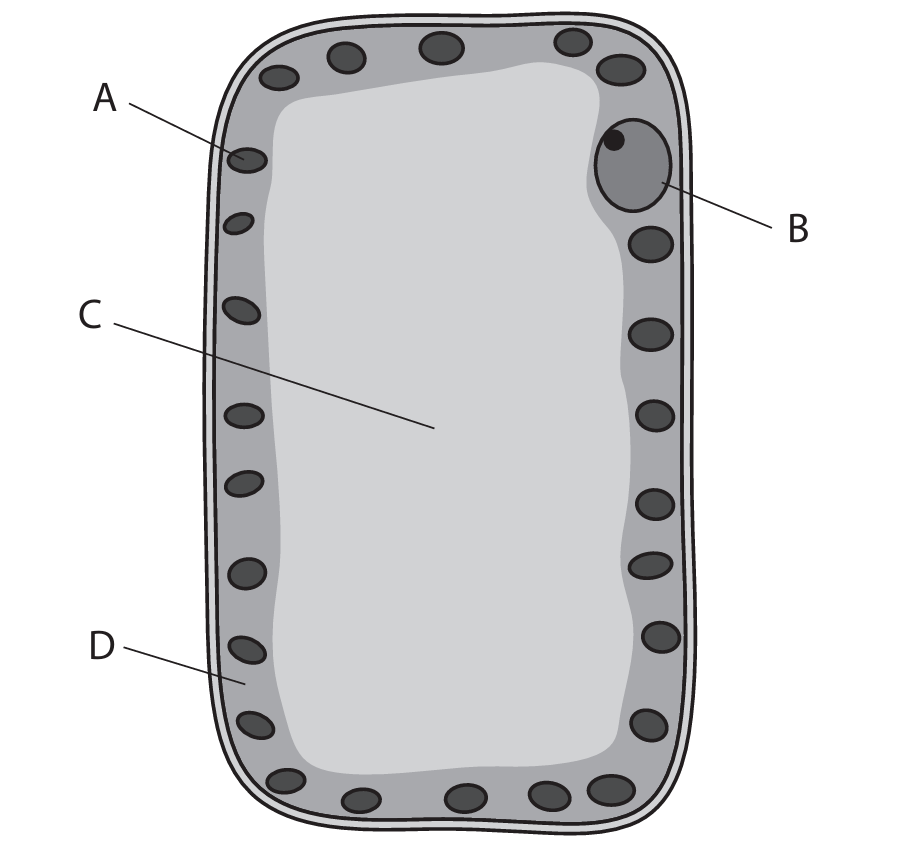
- A: (chloroplasts absorb light) for photosynthesis / absorb light energy to make carbohydrate / eq
- B: (nucleus) controls protein synthesis / contains DNA / contains genes / controls cell / eq
- C: (vacuole) contains cell sap eq
- D: (cytoplasm) where chemical reactions occur
Additional guidance: Allow starch / glucose / sugar for A; allow maintains turgor / stores water / salts / pigments / toxins for C; allow where protein synthesis occurs / respiration occurs / medium for reactions for D.
(b)(ii) An answer that makes reference to two of the following points:
- contains chloroplasts to absorb light / for photosynthesis eq
- long / arranged in a vertical plane / large surface area / rectangular shape, to absorb most light / eq
- large vacuole to store water


▶️ Answer/Explanation
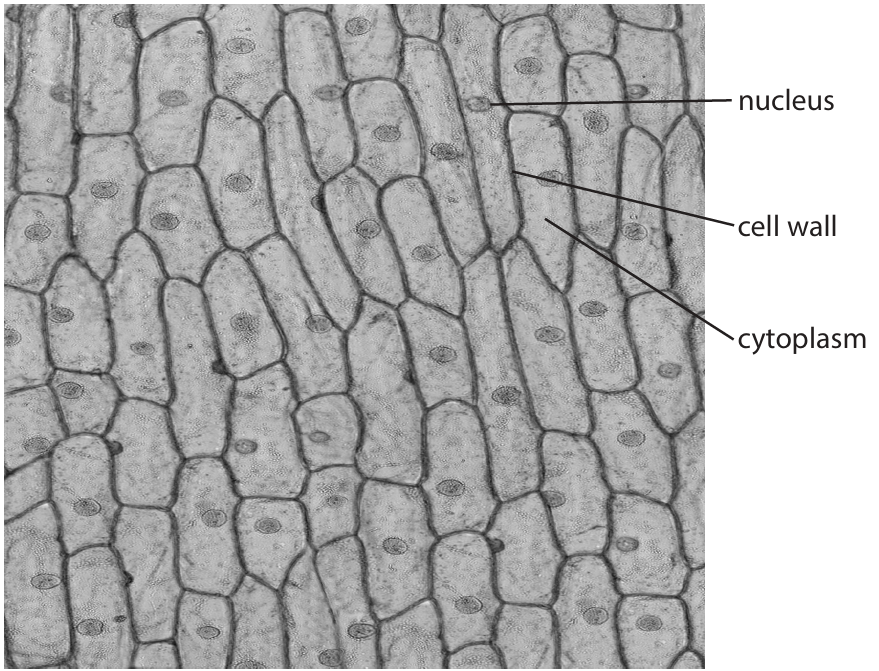
(a) Nucleus
Explanation: The drawing of the human cheek cell shows a large, prominent central organelle which is the nucleus. The nucleus is the control center of the cell, containing the cell’s genetic material (DNA). It is the most visible organelle in a typical animal cell when viewed under a light microscope.
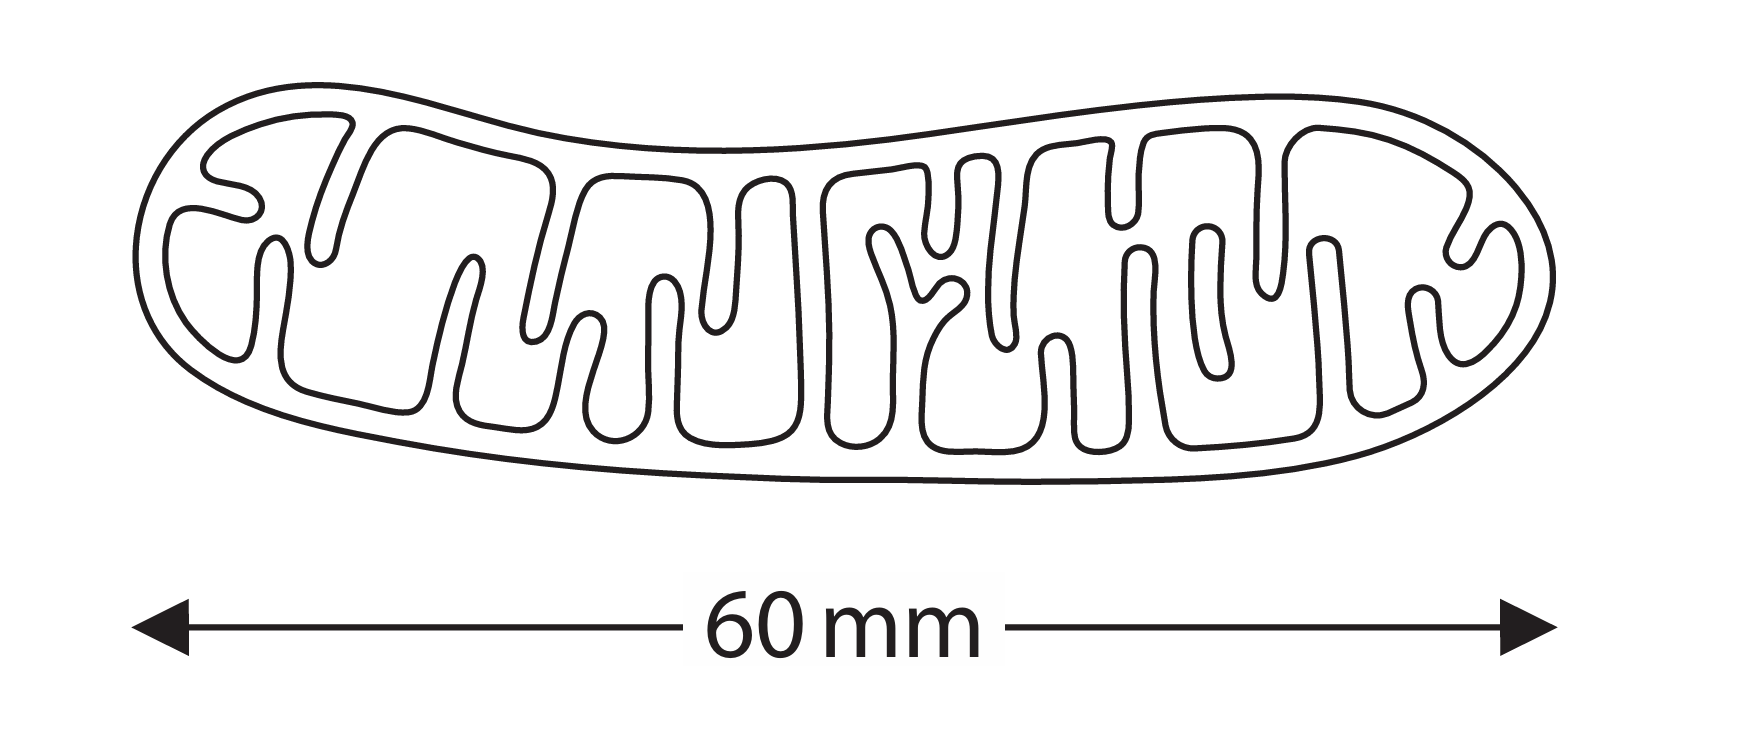
(b) Magnification = ×10 000
Explanation: To calculate the magnification, we use the formula:
\[ \text{Magnification} = \frac{\text{Size of Image}}{\text{Actual Size}} \]
First, ensure both measurements are in the same units. The actual size is 6 µm. Since 1 µm = 0.001 mm, the actual size in mm is \(6 \times 0.001 = 0.006\) mm. The image size is given as 60 mm.
\[ \text{Magnification} = \frac{60 \text{ mm}}{0.006 \text{ mm}} = 10 000 \]
Alternatively, you can convert the image size to µm: 60 mm = 60 000 µm.
\[ \text{Magnification} = \frac{60 000 \ \mu m}{6 \ \mu m} = 10 000 \]
So, the drawing of the mitochondrion has been magnified 10,000 times.
(c)(i) A 0.33
Explanation: To find the mean number of mitochondria per µm³ for the heart muscle cell, we divide the mean number of mitochondria by the mean cell volume:
\[ \frac{5000}{15000} = \frac{1}{3} \approx 0.33 \]
Therefore, there are approximately 0.33 mitochondria per cubic micrometre in a heart muscle cell.
(c)(ii)
Explanation: The data shows significant differences between sperm and egg cells regarding their mitochondria:
- Total Number: The egg cell has a vastly greater total number of mitochondria (600,000) compared to the sperm cell (only 75). This is because the egg provides the cytoplasm and organelles for the developing zygote after fertilization and needs a large energy reserve.
- Cell Volume: The egg cell is much larger in volume (4,000,000 µm³) than the sperm cell (30 µm³). The sperm cell is small and streamlined for motility.
- Density (Mitochondria per µm³): Despite having far fewer total mitochondria, the sperm cell has a much higher density of mitochondria per unit volume (2.50 per µm³) compared to the egg cell (0.15 per µm³). This high density is crucial for the sperm cell because it requires a lot of energy (ATP) to power the movement of its tail (flagellum) as it swims towards the egg for fertilization. The egg cell, being non-motile, does not require such a high density of mitochondria for immediate movement.
In summary, the sperm is a small, motile cell packed with mitochondria for energy, while the egg is a large, static cell with a massive total number of mitochondria to support early embryonic development, but they are less densely packed due to the cell’s enormous volume.


▶️ Answer/Explanation
(a) Control the movement (of substances) in/out of the cell.
Explanation: The cell membrane, also known as the plasma membrane, acts as a selective barrier. It regulates the passage of substances such as nutrients, ions, and waste products, allowing essential molecules to enter the cell while keeping harmful ones out. This maintains the internal environment necessary for the cell’s survival and function.
(b) 6.9 / 6.91 / 6.908 mm²
Explanation: First, we calculate the original area of the lumen. The diameter is 4.0 mm, so the radius \( r \) is half of that, which is 2.0 mm. Using the formula for the area of a circle, \( \pi r^2 \), and given \( \pi = 3.14 \), the original area is \( 3.14 \times (2.0)^2 = 3.14 \times 4 = 12.56 \, \text{mm}^2 \).
The fatty deposit covers 45% of this area, meaning the area available for blood flow is the remaining 55%. So, we calculate 55% of the original area: \( 0.55 \times 12.56 = 6.908 \, \text{mm}^2 \). Rounded appropriately, this gives an area of approximately 6.9 mm².
(c)(i) A bar chart with the following features:
- S: y-axis linear and uses at least half the grid.
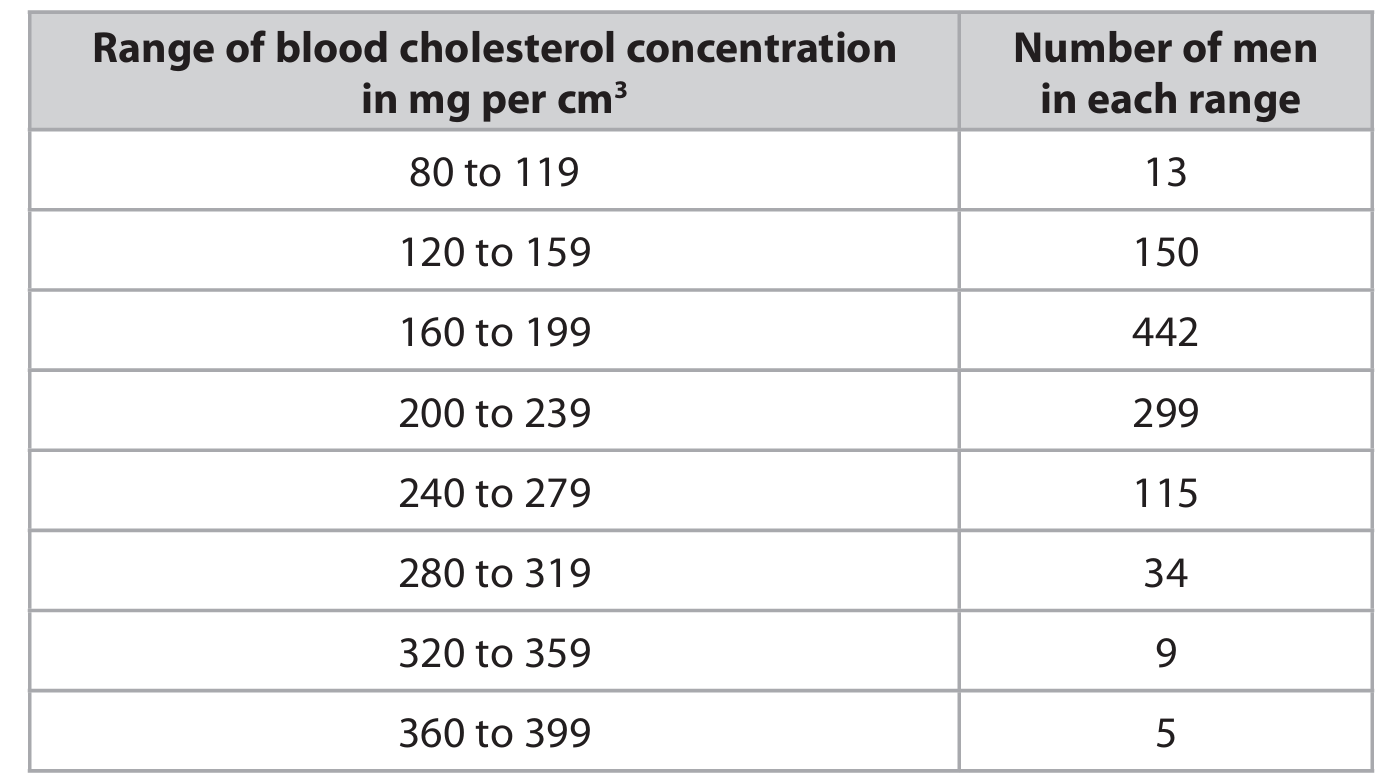
- L: labelled bars drawn for each cholesterol concentration range.
- A1: y-axis labelled “Number of men”.
- A2: x-axis labelled “Cholesterol concentration in mg/cm³” or similar.
- P: bar heights correct (within half a small square of the correct value).
Explanation: A bar chart is the most suitable way to represent this categorical data. The x-axis should show the different ranges of cholesterol concentration, and the y-axis should show the number of men in each range. Each bar’s height corresponds to the frequency (number of men) for that specific cholesterol range. The axes must be clearly labelled, and the scale should be chosen to make good use of the graph paper.
(c)(ii) C 160 to 199
Explanation: The mode is the value that appears most frequently in a data set. In this context, it’s the cholesterol range with the highest number of men. Looking at the table, the range 160 to 199 mg per cm³ has 442 men, which is the highest frequency among all the groups.
(c)(iii) 15.3% (accept 15.28%, 15.276%, or 15%)
Explanation: First, identify the men at higher risk. These are the men in the ranges greater than 239 mg per 100 cm³, which correspond to the ranges 240-279, 280-319, 320-359, and 360-399. Adding these up: 115 + 34 + 9 + 5 = 163 men.
Next, find the total number of men in the sample: 13 + 150 + 442 + 299 + 115 + 34 + 9 + 5 = 1067 men.
Finally, calculate the percentage: \( \frac{163}{1067} \times 100 \approx 15.28\% \).
(d) Discussion points include:
- The statin group shows a lower percentage of heart attacks (2.2%) than the control group (3.8%), which supports the claim.
- However, the conclusion might be limited because only one type of statin was tested.
- The study lasted only four years; long-term effects are unknown.
- The difference could be due to chance, and we don’t know the sample size to assess significance.
- The groups might not have been matched for other factors affecting heart disease risk (e.g., diet, exercise, age, genetics, pre-existing conditions).
Explanation: While the data suggests a benefit from statins, a critical evaluation is needed. The observed reduction in heart attacks is promising, but the study’s design limits the strength of the conclusion. Without knowing if the groups were identical in all other relevant aspects (like lifestyle and genetics), we cannot be sure the result is solely due to the statin. Furthermore, the duration of the study and the testing of only one specific statin mean the findings cannot be broadly generalized without further research.
▶️ Answer/Explanation
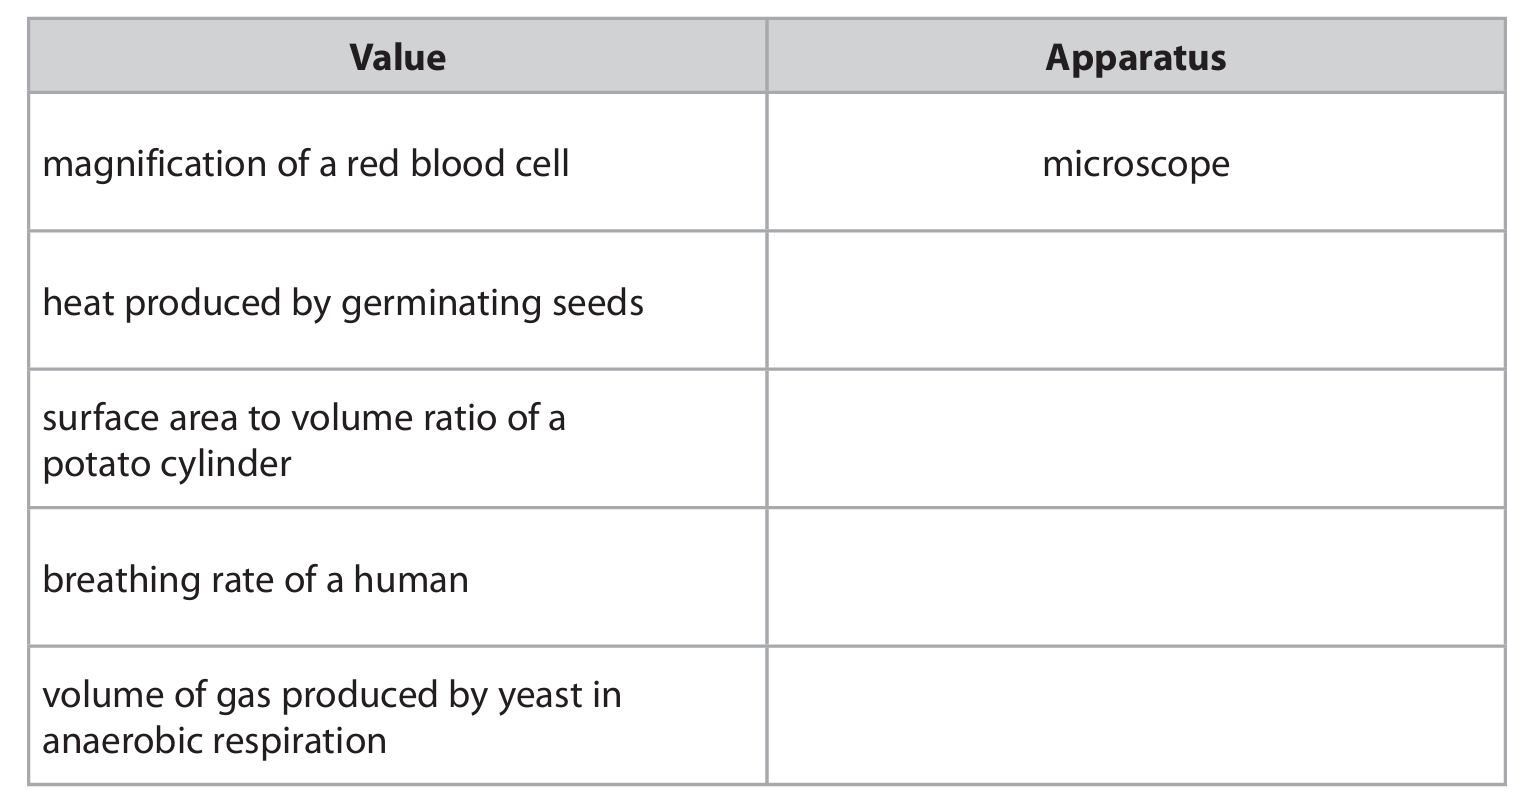
(a)
| Value | Apparatus |
|---|---|
| magnification of a red blood cell | microscope |
| heat produced by germinating seeds | thermometer / temperature probe / data logger |
| surface area to volume ratio of a potato cylinder | ruler |
| breathing rate of a human | clock / watch / timer / spirometer |
| volume of gas produced by yeast in anaerobic respiration | syringe / measuring cylinder / respirometer |
Explanation: To measure the heat produced by germinating seeds, a thermometer or temperature probe is used to detect the temperature change. For calculating the surface area to volume ratio of a potato cylinder, a ruler is essential to measure its length and diameter. To determine the breathing rate of a human, a timing device like a clock or watch is used to count breaths over a period, or a spirometer can measure lung volume changes. To measure the volume of gas produced by yeast during anaerobic respiration, apparatus like a syringe, measuring cylinder, or respirometer can collect and quantify the gas.
(b)
\[ \text{magnification} = \frac{5.3 \text{ cm}}{8 \mu\text{m}} \]
First, convert the units to be the same. Since 1 cm = 10,000 μm, 5.3 cm = 53,000 μm.
\[ \text{magnification} = \frac{53,000}{8} = 6625 \]
So, the magnification is approximately 6625.
Explanation: The formula for magnification is the width of the cell in the drawing divided by the actual width of the cell. The drawing width is measured as 5.3 cm, which is converted to micrometers (53,000 μm) to match the unit of the actual width (8 μm). Dividing these gives a magnification of 6625, meaning the drawing is 6625 times larger than the actual cell. Acceptable answers typically range from 6250 to 6750 due to slight variations in measuring the drawing.