▶️ Answer/Explanation
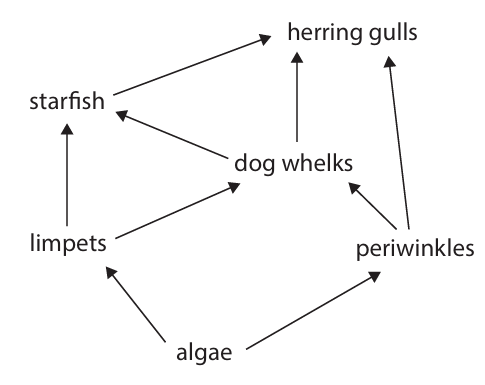
(a)(i) C (secondary consumer and tertiary consumer)
A is incorrect as it is not a primary consumer
B is incorrect as it is not a primary consumer
D is incorrect as it is also a tertiary consumer
(a)(ii) • all of (the organisms of) one / a species in an area (at one time)
(a)(iii) An explanation that makes reference to three of the following:
• (energy lost) from movement
• (energy lost) from respiration / heat loss
• (energy lost) as not some not eaten / are inedible
• (energy lost) as some not digested / indigestible / faeces / egestion
• (energy loss) due to death and decay / (energy lost) to other food chains
(b)(i) A description that makes reference to three of the following:
• quadrat / square in gridded area
• place randomly / choose random coordinates
• repeats
• count limpets (in quadrat / square)
• scale up for whole area multiply by area
(b)(ii) • time of day / location / area / position on shore / species of limpet / same day in August
(b)(iii) An answer that makes reference to five of the following:
1. fossil fuel use releases carbon dioxide
2. carbon dioxide is a greenhouse gas / may cause global warming
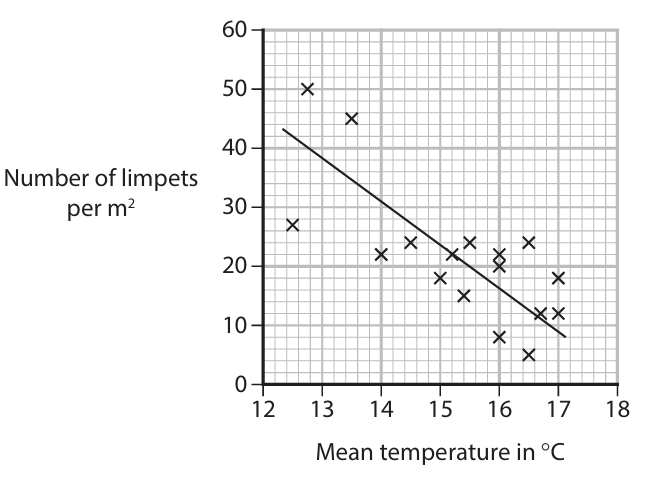
3. increased temperature reduces limpet number
4. less food / energy for starfish / dogwhelks / gulls
5. dogwhelks / gulls / starfish / secondary consumers would decrease
6. algae would increase / less algae eaten / more food for periwinkles
7. there are anomalies / outliers / not all close to line of best fit
8. other factors may affect limpet population / other greenhouse gases may have effect
9. not done for long enough time so less reliable OR done for long time / 17 years so reliable
10. data only for one month / only August / only one location / only one shore / only looks at one species


▶️ Answer/Explanation
(a)(i) C (Y)
Explanation: Respiration is the process where living organisms break down organic compounds to release energy, producing carbon dioxide (CO₂) as a waste product. The arrow labelled Y shows carbon moving from organic compounds in animals back to the atmosphere as CO₂, which represents this process.
(a)(ii) Photosynthesis
Explanation: Process W shows carbon dioxide being taken from the atmosphere and converted into organic compounds in plants. This is the fundamental process of photosynthesis, where plants use light energy to fix carbon into glucose and other molecules.
(b)(i) Water vapour / Chlorofluorocarbons (CFCs)
Explanation: Water vapour is the most abundant greenhouse gas in the atmosphere. Human-made gases like Chlorofluorocarbons (CFCs), used in refrigeration and aerosols, are also potent greenhouse gases, though their use is now restricted.
(b)(ii) Carbon dioxide is likely to contribute the most to global warming.
Explanation: Although carbon dioxide (CO₂) has the lowest Global Warming Potential (GWP=1), it is emitted in vastly larger quantities (77% of emissions) compared to methane (16%) and nitrous oxide (0.77%). Furthermore, its atmospheric lifetime is extremely long (1000 years), meaning its warming effect is persistent and cumulative. The combination of its massive volume and long lifespan means the total heat trapped by CO₂ outweighs the significant but shorter-term impact of the more potent but less abundant gases.

▶️ Answer/Explanation
(a)(i)
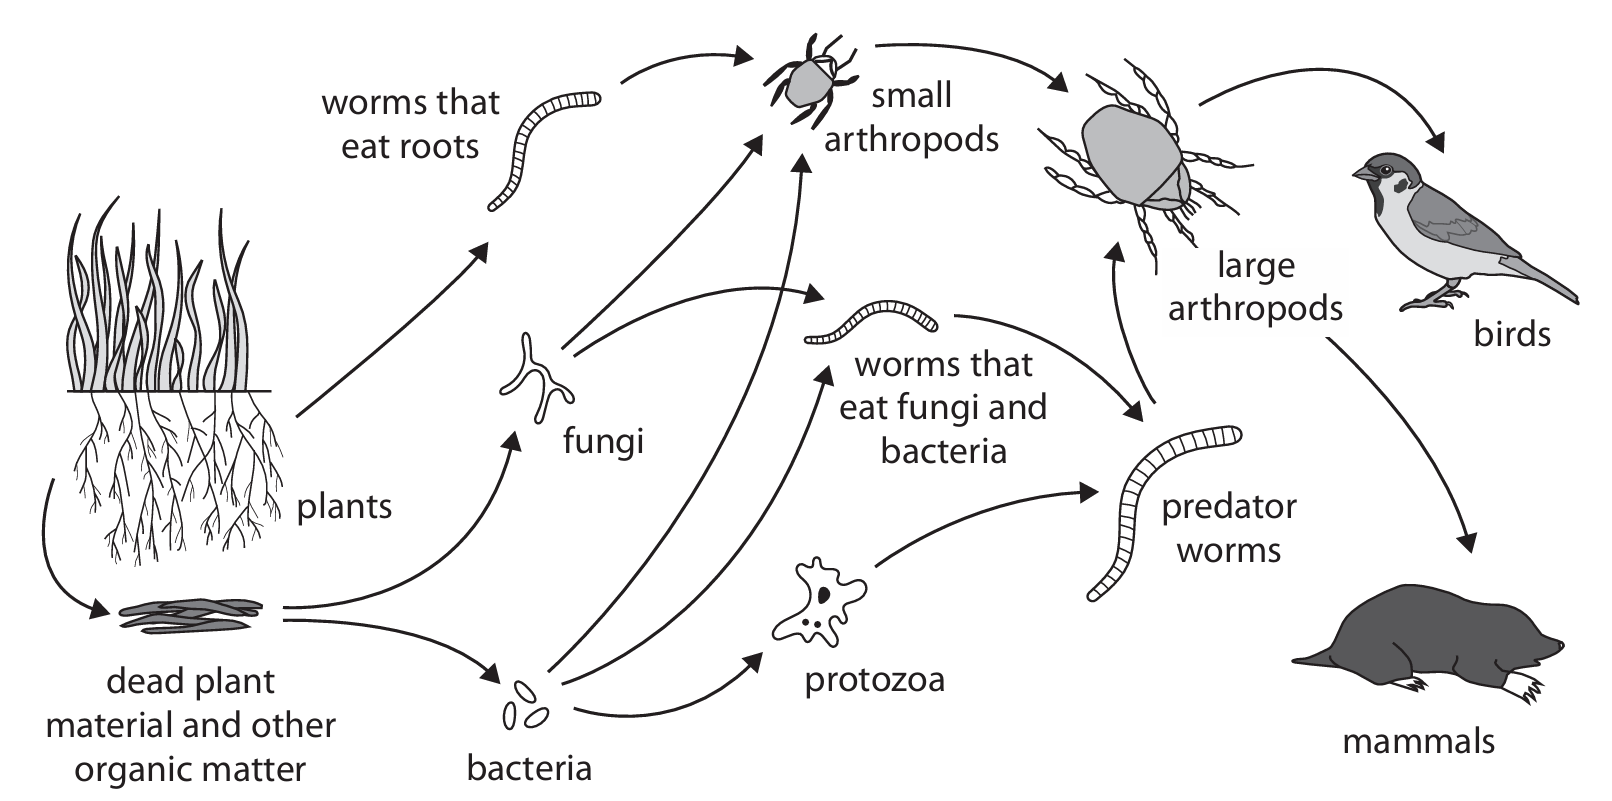
Answer: plants ⟶ worms (that eat roots) ⟶ small arthropods ⟶ large arthropods ⟶ birds
OR
(dead) plants ⟶ fungi ⟶ small arthropods ⟶ large arthropods ⟶ birds
Explanation: A food chain shows the transfer of energy from one organism to the next. Starting with plants (producers), energy moves to primary consumers (worms that eat roots), then to secondary consumers (small arthropods), then to tertiary consumers (large arthropods), and finally to quaternary consumers (birds). The arrows must point in the direction of energy flow, from the organism being eaten to the organism that eats it. The chain must include five trophic levels and end with birds.
(a)(ii)
Answer: Bacteria and fungi are decomposers. They digest/decompose/decay/break down organic matter using enzymes. They are saprophytic/saprotrophic (feed on dead matter). They respire to produce ATP/energy.
Explanation: Bacteria and fungi play a crucial role in ecosystems by breaking down dead organic material (like dead plants and animals). They secrete enzymes onto the organic matter. These enzymes break down complex molecules (like cellulose, proteins) into simpler, soluble substances. The decomposers then absorb these nutrients. The process of breaking down the material releases energy. This energy is used by the decomposers for their own life processes, primarily through respiration which produces ATP. This mode of nutrition, where organisms feed on dead and decaying matter, is called saprophytic or saprotrophic nutrition.
(b)
Answer: The bird population will decrease because there are fewer large arthropods to eat/less food. The population of worms that eat roots will increase because fewer of them are eaten by small arthropods/fewer predators of worms.
Explanation: The pesticide directly reduces the populations of small and large arthropods. Birds, which prey on large arthropods, will have less food available. This lack of food will likely lead to a decrease in the bird population due to starvation, reduced reproduction, or emigration. On the other hand, small arthropods are predators of worms that eat roots. With the population of small arthropods reduced, the predation pressure on the worms is lowered. This allows the worm population to thrive and increase in size, as fewer of them are being eaten.
(c)
Answer:
- More mites were collected in all types of traps compared to the other animal types.
- The fewest large arthropods were collected in all trap types.
- The cul-de-sac trap (C) collected the most mites.
- The pitfall trap (P) collected the fewest mites.
- The basket trap (B) collected the most springtails.
- The pitfall trap (P) collected the fewest springtails.
- There was little difference in the number of mites collected between the cul-de-sac and basket traps.
- There was little difference in the number of springtails collected between the cul-de-sac and basket traps.
- The cul-de-sac trap collected the most animals in total.
- The pitfall trap collected the fewest animals in total.
Explanation: By analyzing the graph data, we can discuss the effectiveness of each trap for different animals. The results show that mites are the most commonly collected animal group across all traps. The cul-de-sac trap is particularly effective for collecting mites, while the basket trap is best for springtails. The pitfall trap is the least effective for collecting both mites and springtails. The number of large arthropods collected is consistently low across all traps. The overall most effective trap for collecting a high total number of soil animals appears to be the cul-de-sac trap, while the pitfall trap is the least effective overall. These differences are likely due to the design of the traps, which target different animal behaviors (e.g., crawling, falling, being active on the surface).

▶️ Answer/Explanation
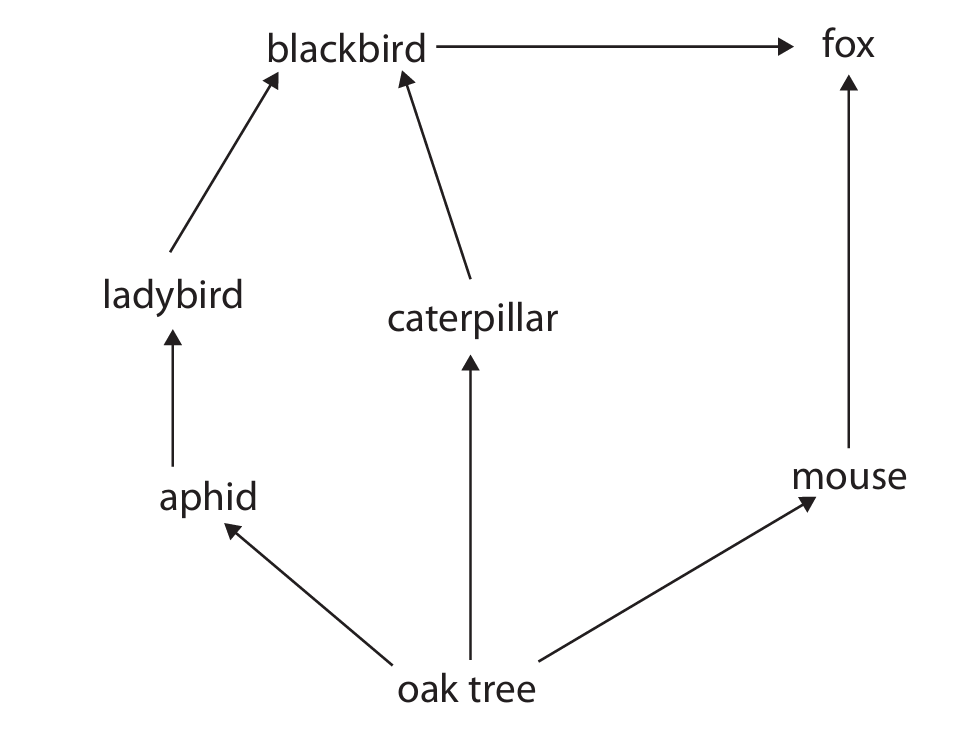
(a)(i) A (aphid)
Explanation: A primary consumer is an organism that eats producers. In this food web, the oak tree is the producer. The aphid feeds directly on the oak tree, making it the primary consumer. The blackbird and fox are consumers that eat other animals, so they are secondary or tertiary consumers.
(a)(ii) D (all the different species in the area)
Explanation: A community is defined as all the populations of different species living and interacting in a particular area at the same time. Option A describes an ecosystem (community + habitat). Option B describes a single population. Option C also describes an ecosystem.
(b)(i)
Answer: A pyramid of numbers represents the number of organisms at each trophic level. The base should be the producer (oak trees). Since there are 4 oak trees, the bar should be drawn to represent this number. The next level is the primary consumer (mice), with a bar for 20 mice. The top level is the secondary consumer (foxes), with a bar for 2 foxes. The pyramid should be drawn to scale, meaning the relative sizes of the bars should accurately reflect the numbers (e.g., the mouse bar should be 5 times wider than the fox bar, and the oak tree bar should be 5 times narrower than the mouse bar). The pyramid should be labelled with the names of the organisms and the trophic levels.
[A drawn pyramid with ‘Fox (2)’ at the top, ‘Mouse (20)’ in the middle, and ‘Oak Tree (4)’ at the bottom, all bars correctly scaled and labelled.]
(b)(ii) 100 kJ
Explanation: First, calculate the total energy transferred to all the mice. 8% of 25,000 kJ is transferred.
Calculation: \( \frac{8}{100} \times 25,000 = 2,000 \) kJ.
This is the total energy for 20 mice. To find the mean for one mouse, divide this total by 20.
Calculation: \( \frac{2,000}{20} = 100 \) kJ.
So, the mean amount of energy transferred to the biomass of one mouse each year is 100 kJ.
(b)(iii)
Explanation: Energy is lost at each stage of a food chain, which is why the percentage transferred is so low. The reasons include:
• Not all parts of the oak tree are eaten by the mice (e.g., deep roots, thick bark).
• Some of the energy absorbed by the mice is lost through respiration to fuel metabolic processes like movement and maintaining body temperature. This energy is lost as heat.
• Some of the ingested material is egested as faeces because it cannot be digested or absorbed.
• Energy is also lost in excretory materials, such as urine.
These losses mean that only a small fraction (in this case, 8%) of the energy from the oak trees’ biomass is available to be stored in the mice’s biomass for growth.
▶️ Answer/Explanation
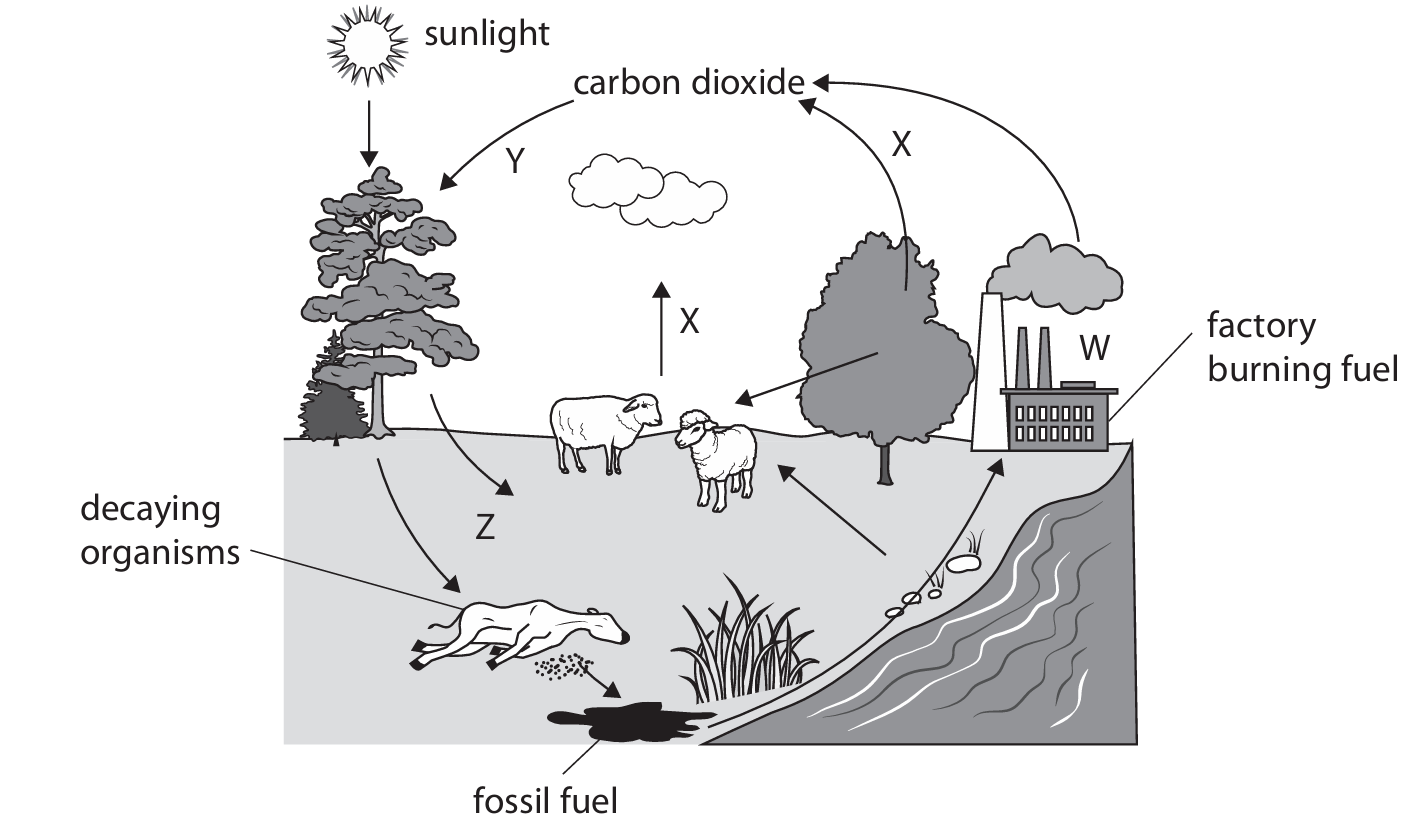
(a) Carbon cycle.
Explanation: The diagram depicts the movement of carbon between the atmosphere, organisms, and the Earth, which is the fundamental process of the carbon cycle. Carbon is exchanged between reservoirs such as the atmosphere (as CO2), living organisms, fossil fuels, and decomposing matter.
(b)(i) A (combustion)
Explanation: The letter W points to the process where a factory is burning fuel. This is a classic representation of combustion, a process where organic material (like fossil fuels) is burned, reacting with oxygen to release carbon dioxide back into the atmosphere.
(b)(ii) D (respiration)
Explanation: The letter X is likely pointing from the decaying organisms or the general biosphere to the CO2 in the atmosphere. This represents respiration, the process by which living organisms (including decomposers) break down organic molecules to release energy, producing carbon dioxide as a waste product.
(c) Bacteria or Fungi.
Explanation: Decomposition is primarily carried out by saprophytic organisms. The two main groups responsible are bacteria (microscopic prokaryotes) and fungi (like mushrooms and moulds). These organisms secrete enzymes that break down complex organic matter in dead plants and animals into simpler substances.
(d) Investigation Design:
Hypothesis: Changing the pH of organic material will affect the rate of decomposition.
Variables:
- Independent Variable: The pH of the organic material environment. This will be changed by adding different buffers, acids, or alkalis to separate samples.
- Dependent Variable: The rate of decomposition. This can be measured by the change in mass of the organic material over a fixed period (e.g., one week) or by the volume of carbon dioxide produced.
- Control Variables (to be kept constant):
- Type and mass of organic material: Use the same plant material (e.g., 10g of chopped lettuce leaves) for all samples.
- Temperature: Incubate all samples in an incubator or water bath at a constant temperature (e.g., 25°C).
- Moisture level: Ensure all samples have the same amount of water.
- Oxygen availability: Use containers that allow air exchange or seal them if investigating anaerobic decomposition.
- Time: Measure the change after the same duration for all samples.
- Microorganism population: Ideally, add a standardised amount of decomposer inoculum (e.g., soil extract) to each sample to ensure a similar starting population of bacteria/fungi.
Method:
- Prepare several identical containers (e.g., conical flasks).
- Add equal masses of the same organic material to each container.
- Prepare solutions at different pH values (e.g., pH 3, pH 5, pH 7 (neutral control), pH 9, pH 11) using buffers.
- Add the same volume of a different pH solution to each container, ensuring the organic material is moistened.
- Add a standard amount of decomposer inoculum (e.g., 1 cm³ of soil suspension) to each container.
- Seal the containers with a bung holding a tube leading to a gas syringe (to measure CO2) or use cotton wool plugs to allow air exchange if measuring mass loss.
- Place all containers in the same constant temperature environment.
- If measuring mass loss, weigh each container at the start and then after a fixed period (e.g., 7 days). Calculate the percentage mass loss for each pH. If measuring CO2, record the volume in the gas syringe at regular intervals.
- Repeat the entire experiment to ensure reliability.
Expected Analysis: Plot a graph of rate of decomposition (mass loss or CO2 production) against pH. This will show if there is an optimal pH for decomposition (likely near neutral for most soil bacteria) and how acidic or alkaline conditions slow it down.
▶️ Answer/Explanation
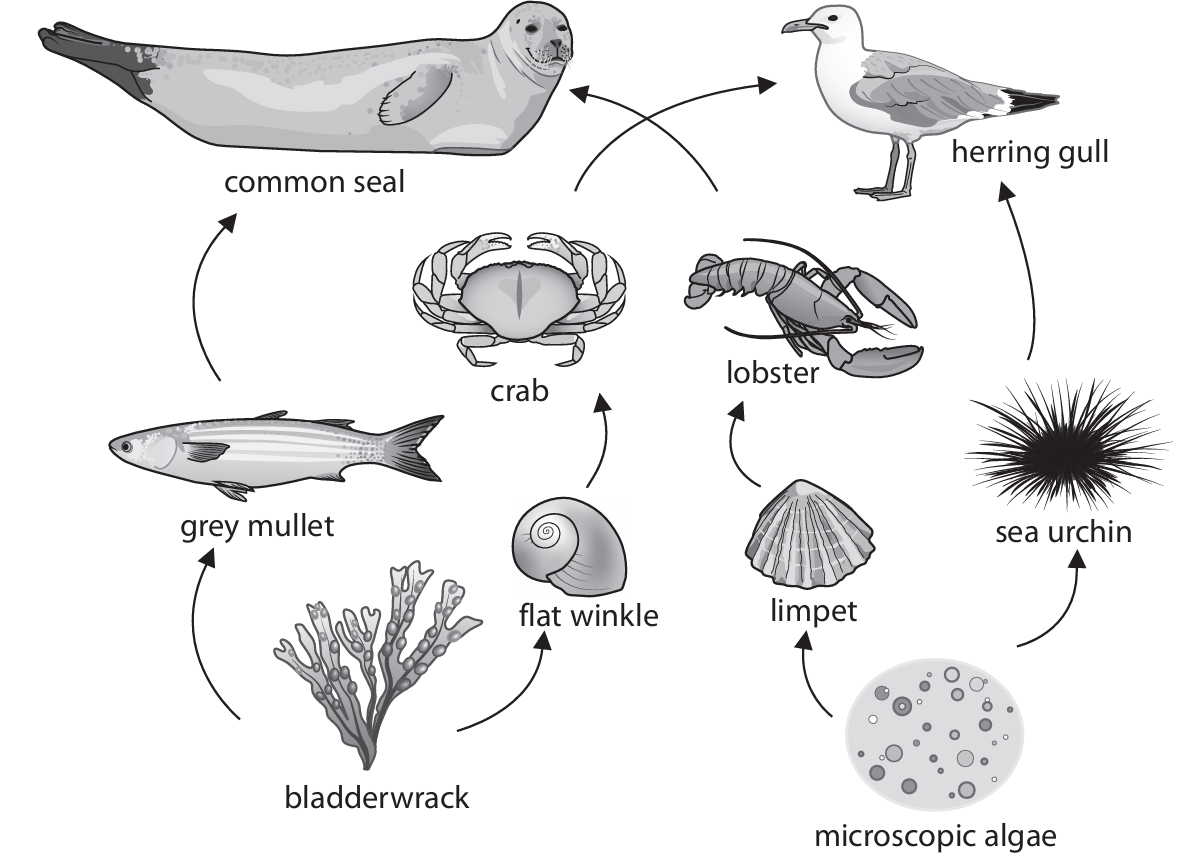
(a) (i) Microscopic algae and bladderwrack.
Explanation: Producers are organisms that can make their own food, usually through photosynthesis. In this food web, microscopic algae and bladderwrack (a type of seaweed) are the primary producers. They convert sunlight energy into chemical energy stored in organic compounds, forming the base of the food web.
(a) (ii) Crab and lobster. (Accept: common seal, herring gull)
Explanation: Secondary consumers are organisms that eat primary consumers (herbivores). In this web, primary consumers include limpets, winkles, and sea urchins (which eat the producers). Therefore, animals like the crab and lobster, which feed on these primary consumers, are secondary consumers. The common seal and herring gull, which can eat the crab or lobster, are tertiary consumers.
(a) (iii) One possible answer: bladderwrack → flat winkle → crab → herring gull
Explanation: A food chain shows a single pathway of energy flow. To create a four-organism chain including the herring gull (a top predator), we start with a producer (e.g., bladderwrack), which is eaten by a primary consumer (e.g., flat winkle), which is then eaten by a secondary consumer (e.g., crab), which is finally eaten by the herring gull (tertiary consumer). The arrows indicate the direction of energy transfer.
(b) (i)
A pyramid shape with four horizontal layers. The bottom layer (producers) is widest, labeled “Microscopic Algae”. The next layer up (primary consumers) is narrower, labeled “Limpet”. The third layer (secondary consumers) is narrower still, labeled “Lobster”. The top layer (tertiary consumers) is the smallest, labeled “Common Seal”.
Explanation: A pyramid of energy represents the amount of energy stored in the biomass of each trophic level at a given time. It is always pyramid-shaped because energy is lost at each transfer. The base (producers) contains the most energy, and each successive level (primary, secondary, tertiary consumers) contains less.
(b) (ii) The amount of energy decreases because energy is lost at each trophic level. This loss occurs as heat from respiration, energy used for movement and other life processes, and energy contained in waste products (e.g., faeces and urine) and uneaten parts. Only a fraction of the energy stored in an organism is transferred to and becomes stored in the organism that consumes it.
Detailed Explanation: As energy moves through the food chain from producers to various levels of consumers, it does so inefficiently. A significant portion of the energy an organism consumes is used for its own metabolic processes, such as respiration, which releases energy as heat that is lost to the environment. Additionally, energy is used for activities like hunting, moving, and reproducing. Not all parts of a consumed organism are digested and absorbed; some energy remains in the indigestible materials that are egested as faeces. Furthermore, not all individuals at one level are eaten by the next; some die and are decomposed, with that energy also being lost from the food chain. This constant loss at every step means that the amount of energy available to support biomass decreases dramatically with each trophic level, which is why food chains are rarely longer than four or five levels.