▶️ Answer/Explanation
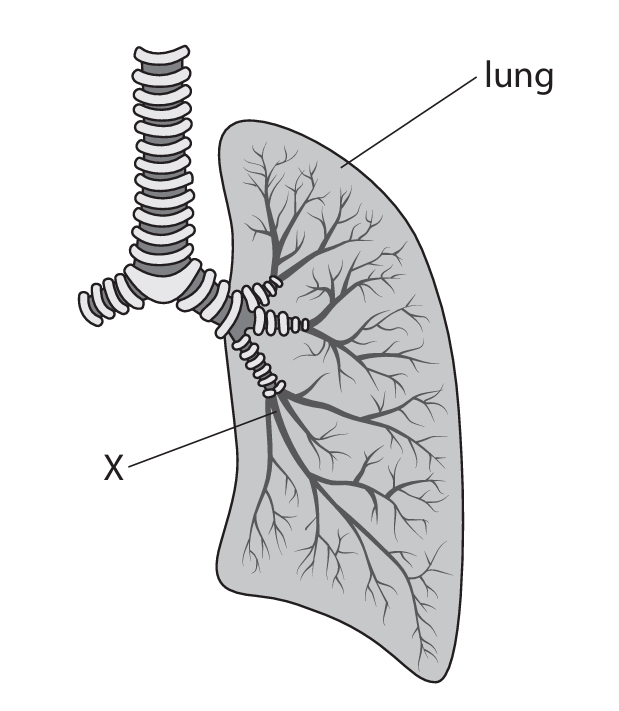
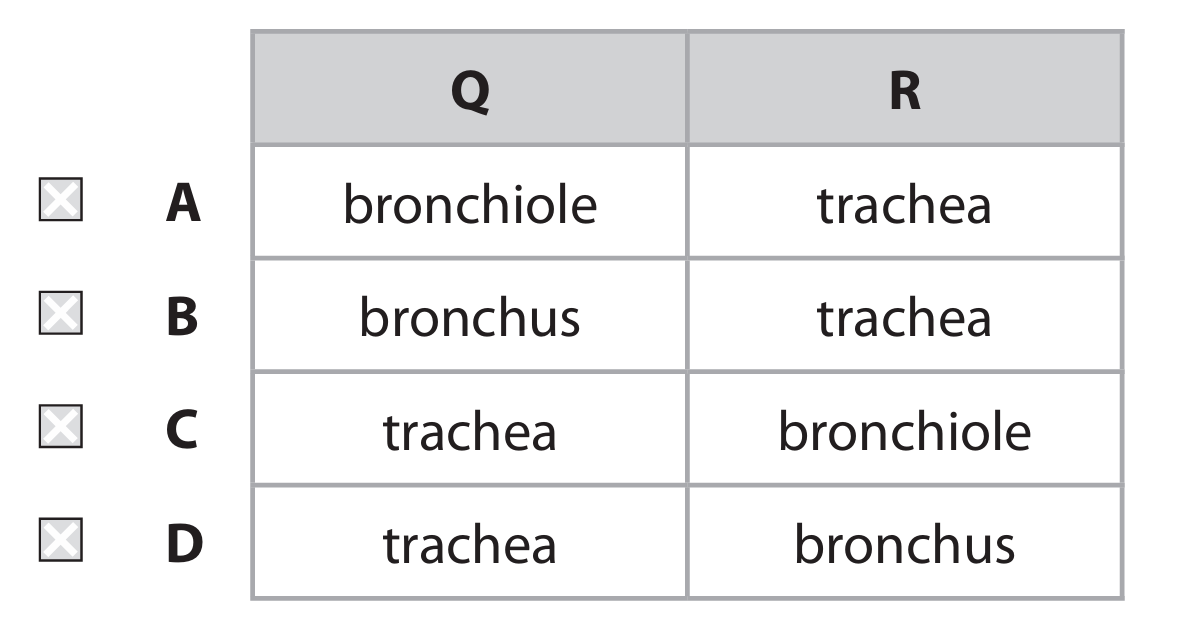
(a)(i) B (bronchiole)
A is incorrect as it is not an alveolus
C is incorrect as it is not a bronchus
D is incorrect as it is not a trachea
(a)(ii) An answer that makes reference to the following:
• it has more than one tissue / is a group of tissues / is a collection of tissues / made of multiple tissues (1)
(a)(iii) An explanation that makes reference to the following:
• diaphragm moves down / flattens (1)
• (chest / thorax) volume increases (1)
• (chest / thorax) pressure decreases / air flows from high pressure to low pressure / down a pressure gradient (1)
(b)(i) • \(35 \times 70 \times 30 = 73,500\) cm³ (2)
One mark for ×35 or ×70 or ×30 or 2450 or 1050 or 2100
Accept 74,000 or 73,000 for two marks
Correct answer gains both marks
(b)(ii) An explanation that makes reference to three of the following:
1. oxygen use lower in smokers / lower rate of oxygen use (1)
2. tar (in cigarettes) (1)
3. causes emphysema / mucus builds up / mucus not removed / cilia damaged (1)
4. less surface area (of alveoli) (1)
5. less diffusion of oxygen (into blood) (1)
6. carbon monoxide binds to haemoglobin (reducing oxygen) (1)
7. causes narrowing of arteries / blocks blood vessels (reducing flow of oxygenated blood) (1)

▶️ Answer/Explanation
(a)(i) diaphragm
(a)(ii) C (increases, decreases)
A is incorrect because the volume increases.
B is incorrect because the volume increases.
D is incorrect because the pressure decreases.
(a)(iii) Two from:
• jar cannot expand / is rigid (ribcage can move)
• no intercostal muscles / no ribs
• no pleural membrane / no pleural fluid / balloons do not touch sides of jar
(b)(i) D (trachea → bronchus → bronchiole → alveolus)
A is incorrect because bronchiole is not first.
B is incorrect because bronchus is not first.
C is incorrect because bronchiole is not second.
(b)(ii) \( 4.8 \times 10^8 \times 4.0 \times 10^{-3} = 1.92 \times 10^6 \) mm2 (or \( 1.9 \times 10^6 \) mm2)
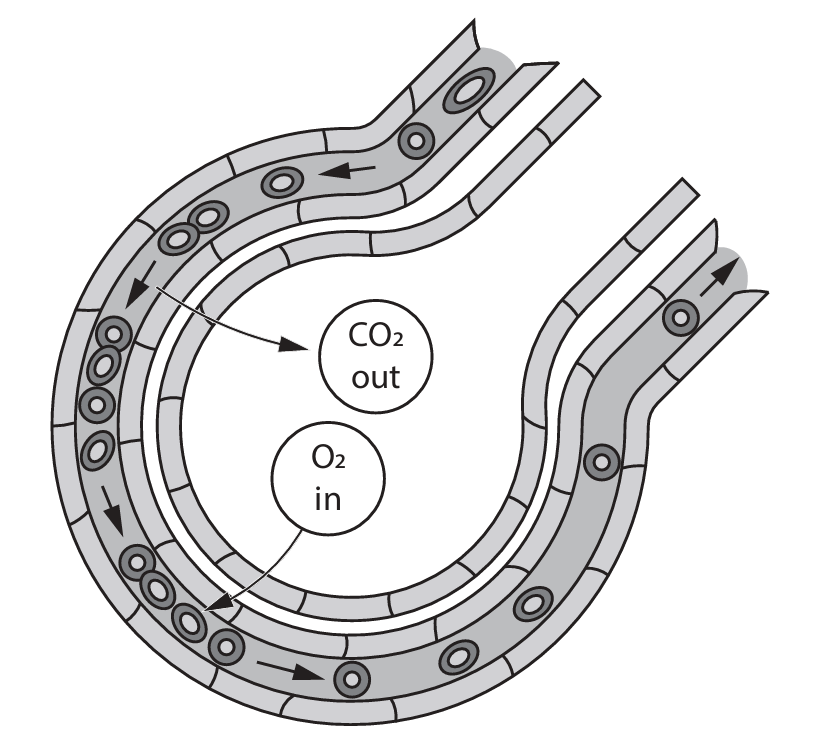
(b)(iii) Two adaptations, each with explanation:
1. One cell thick / thin walls → short diffusion pathway / rapid diffusion.
2. Surrounded by capillaries / good blood supply → maintains concentration gradient.
3. Moist surface → gases dissolve for easier diffusion.
(b)(iv) Description including three of:
• Use limewater or hydrogen carbonate indicator.
• Measure time for limewater to go cloudy / indicator to change.
• Compare results with and without exercise / before and after.
• Control variables (same volume, temperature, person).
• Repeat and calculate mean.

▶️ Answer/Explanation
(a)(i) An explanation that makes reference to four of the following points (marked in pairs):
- Artery wall has a thick layer of elastic tissue / more elastic (1) as blood pressure is higher / for the wall to recoil / to expand / to smooth blood flow (1).
- Artery wall has a thick layer of muscle / more muscle (1) to control blood flow (1).
- Artery has no valves (1) as blood pressure is sufficient to prevent backflow (1).
Accept converse statements for veins. Credit thick wall due to high pressure (two marks) if other points are not given.
(a)(ii) An explanation that makes reference to three of the following points:
- The artery in CHD has a blockage / is narrower / has a narrower lumen (1).
- Less blood / less oxygen can flow to the heart muscle (1).
- This leads to less aerobic respiration / more anaerobic respiration (1).
- Less energy / less ATP is produced (1).
- Therefore, the heart is unable to beat faster / contract as effectively during exercise (1).
(b)(i) An answer that makes reference to one of the following:
- High cholesterol / high-fat diet (1)
- Lack of exercise (1)
- Stress (1)
- High salt diet (1)
- High BMI / obesity (1)
- Diabetes (1)
- Age (1)
- Sex (1)
- High blood pressure (1)
Ignore “diet”, “bad diet”, “unbalanced diet” without specific link.
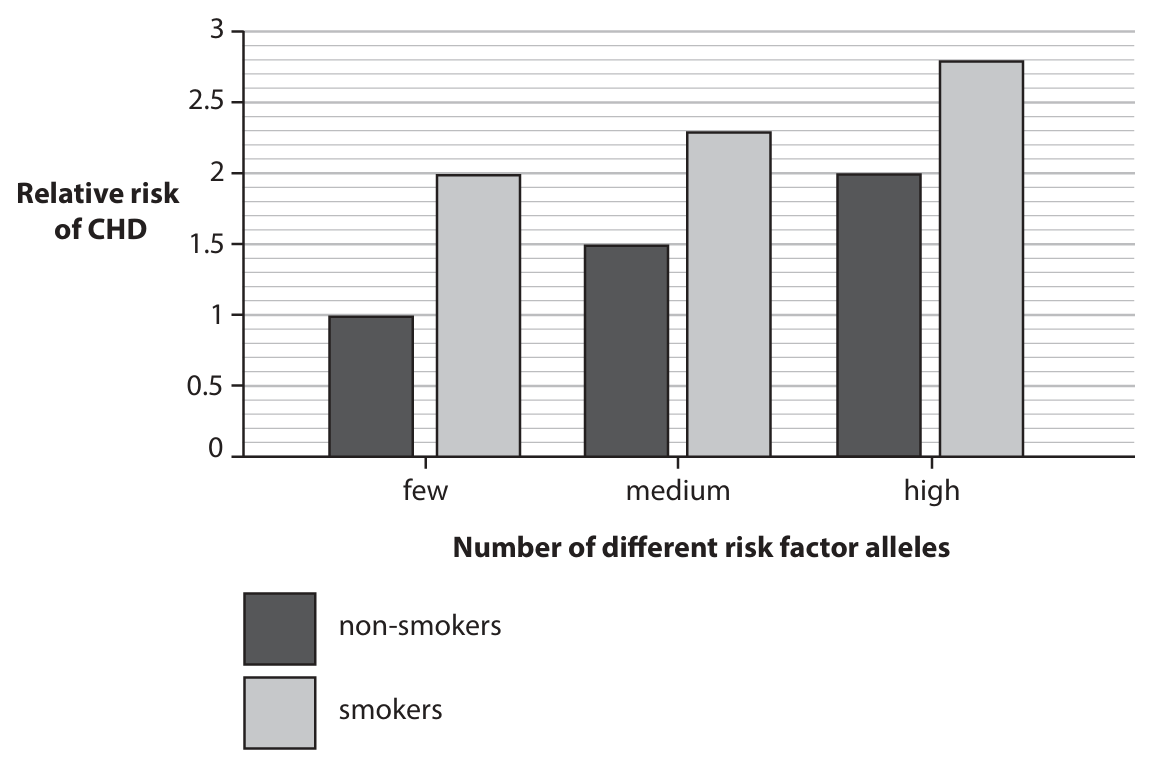
(b)(ii) An answer that makes reference to five of the following points:
- Smoking increases the risk of CHD for all allele groups (1).
- Having more risk factor alleles increases the risk of CHD (1).
- The highest risk is for smokers with a high number of alleles / The lowest risk is for non-smokers with few alleles (1).
- The biggest increase in risk from smoking is seen in those with few risk alleles / The increase from smoking is lower for the medium or high allele groups (1).
- Smokers with few alleles have a similar risk to non-smokers with many alleles (1).
- Credit use of data, e.g., smoking increases risk by approximately 1 for the low allele group (1).
- Carbon monoxide in cigarette smoke contributes to CHD (1).
- Smoking causes plaque / cholesterol build-up / blocks the coronary artery (1).
- Limitation: group size / sample size may be small (1).
- Limitation: other factors like age, sex, diet, frequency of smoking were not considered (1).
Accept: The increase in risk from smoking is similar for medium and high allele groups.

▶️ Answer/Explanation
(a)(i) • limewater / hydrogen carbonate indicator / sodium hydrogen carbonate / sodium bicarbonate / bicarbonate indicator / eq
Explanation: Limewater (calcium hydroxide solution) is a standard test for carbon dioxide, turning cloudy/milky. Hydrogen carbonate indicator is also commonly used, changing color based on \(CO_2\) concentration (e.g., from red to yellow with high \(CO_2\)).
(a)(ii) An explanation that makes reference to three of the following:
• Tube A (inhaled air) stays clear / shows no (significant) change / eq (1)
• Tube B (exhaled air) goes cloudy / milky / turns yellow (if using hydrogen carbonate indicator) / eq (1)
• Because exhaled air has a much higher concentration of carbon dioxide / \(CO_2\) / eq (1)
• The carbon dioxide reacts with the limewater to form insoluble calcium carbonate (which causes the cloudiness) / eq (1)
Explanation: Inhaled air contains approximately 0.04% \(CO_2\), while exhaled air contains about 4% \(CO_2\). The higher \(CO_2\) in exhaled air produces a visible reaction with the indicator solution.
(a)(iii) • (exhaled air is) warmer / has less oxygen / has more water vapour / eq (1)
Explanation: During respiration in the body, energy is released as heat, warming the exhaled air. Also, oxygen is used up, and the air is saturated with water vapour from the moist lining of the respiratory system.
(b)(i) • duration (of exercise) / time / eq (1)
Explanation: The independent variable is the one that is deliberately changed or manipulated by the investigator. Here, it’s the duration of exercise in seconds.
(b)(ii) A line graph that scores marks for:
• Scales linear and covering at least 2 big squares on the y-axis and 3 on the x-axis (1)
• Points correctly plotted within a small square tolerance (1)
• Straight lines drawn connecting all points in order (1)
• Axes correct way round: Duration (s) on x-axis, Breathing rate (breaths/min) on y-axis (1)
• Both axes labelled with correct quantity and unit (1)
Note: A sketch would show a generally increasing trend from 0s to 180s, peaking at 42 breaths/min, then a slight dip and plateau from 210s to 240s at 40 breaths/min.
(b)(iii) A description that includes two of the following:
• Breathing rate increases (with duration) until 180 seconds / up to 42 breaths per minute / eq (1)
• (After 180 seconds) it decreases slightly / from 42 to 40 breaths per minute (between 180 and 210 seconds) / eq (1)
• (After 210 seconds) it then levels out / becomes constant / plateaus at 40 breaths per minute / eq (1)
Explanation: The initial increase is due to the body’s demand for more oxygen and removal of \(CO_2\) during exercise. The slight decrease and plateau may indicate the body reaching a steady state or the subject tiring.
(b)(iv) • repeat (the investigation) / use more students / people / take more readings / eq (1)
Explanation: Repeating the investigation and calculating a mean, or using more subjects, improves reliability by reducing the effect of random errors or individual variation.

▶️ Answer/Explanation
(a)(i) B (bronchiole)
(a)(ii) A (diaphragm contracts and moves downwards)
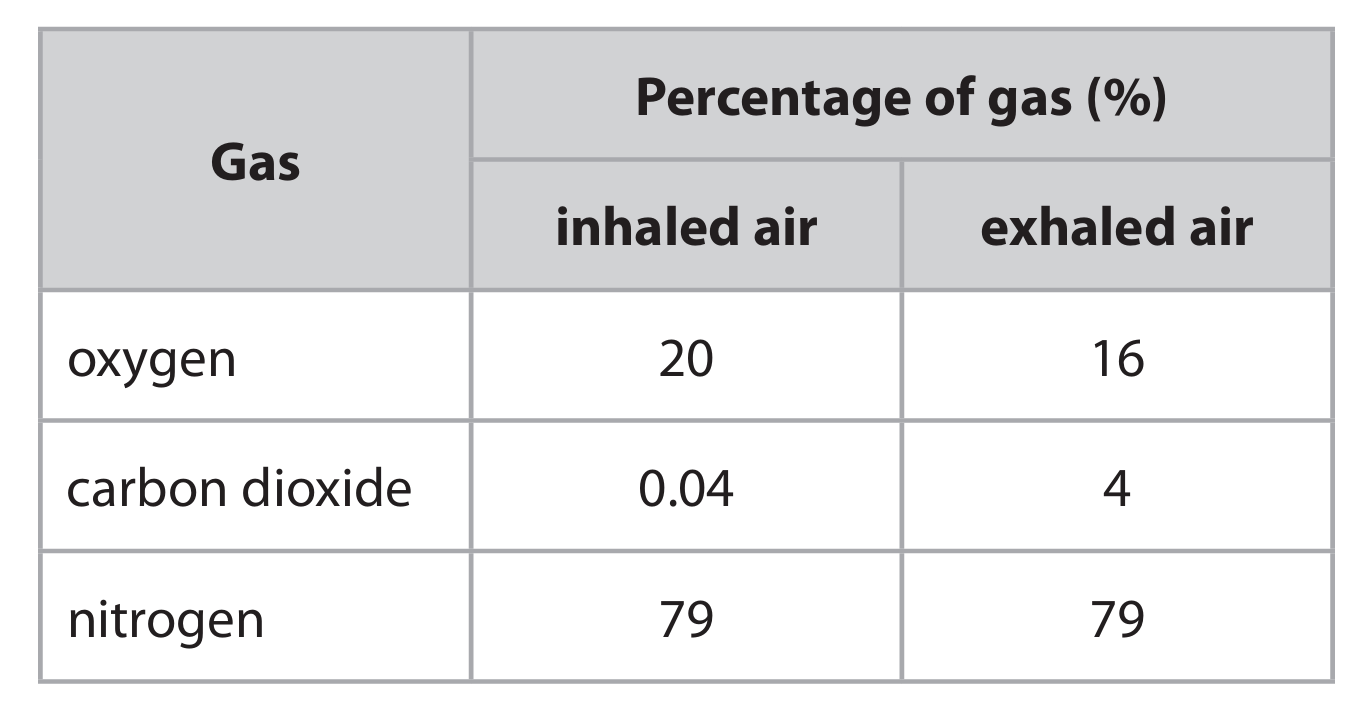
(b)(i) Explanation that includes:
• Oxygen decreases from 20% to 16% because it is used in respiration / diffuses into blood
• Carbon dioxide increases from 0.04% to 4% because it is produced in respiration / diffuses out of blood
• Nitrogen remains unchanged at 79% because it is not used in respiration
(b)(ii) Suggestion that includes:
• Exhaled air is a mixture of alveolar air and air from the dead space (trachea, bronchi, bronchioles)
• Dead space air has not undergone gas exchange and dilutes the alveolar air during exhalation
• Therefore exhaled air has higher oxygen and lower carbon dioxide than pure alveolar air
▶️ Answer/Explanation
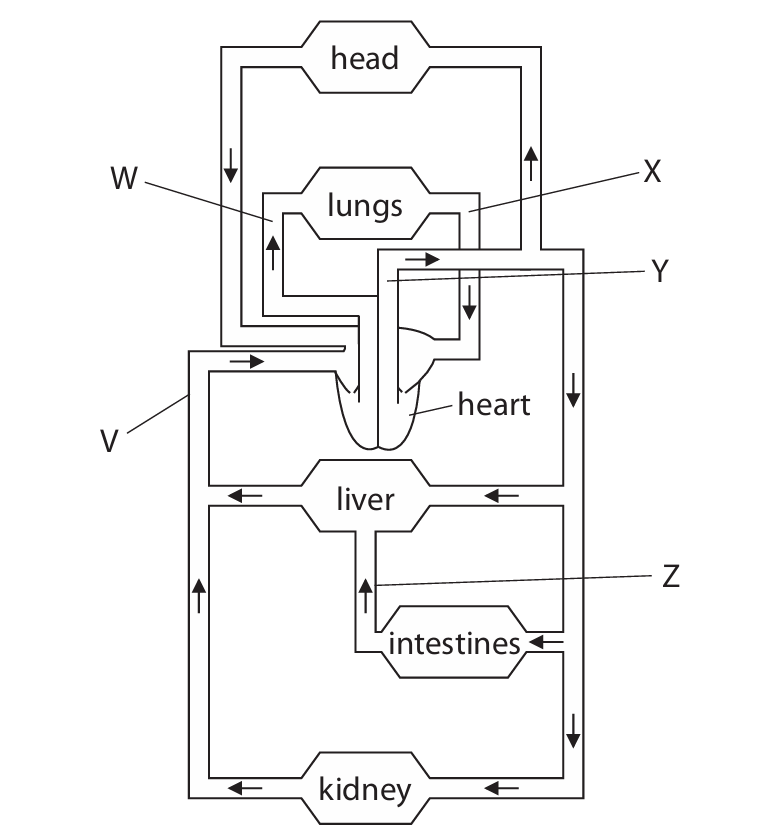
(a)(i) Hepatic portal vein
Explanation: Blood vessel Z is identified as the hepatic portal vein. This is a major vein that carries blood rich in digested nutrients from the intestines and spleen to the liver for processing. The liver then metabolizes these nutrients before the blood re-enters the general circulation via the hepatic vein.
(a)(ii) B (X)
Explanation: Blood vessel X contains blood with the lowest concentration of carbon dioxide. Vessel X is the pulmonary vein, which carries oxygenated blood from the lungs back to the heart. Since gas exchange occurs in the lungs, carbon dioxide is diffused out and oxygen is diffused in, resulting in blood that is high in oxygen and low in carbon dioxide entering the pulmonary vein.
Option A (W) is the pulmonary artery, which carries deoxygenated blood high in CO₂ to the lungs. Option C (Y) is the aorta, which carries oxygenated blood but has a higher CO₂ concentration than pulmonary vein blood because it has delivered oxygen to tissues. Option D (Z) is the hepatic portal vein, which carries blood from the gut that may have varying CO₂ levels but is not the lowest.
(b)
1. V (vein) has a thinner wall, while Y (artery) has a thicker wall.
2. V (vein) has valves present to prevent backflow of blood, while Y (artery) does not have valves.
Explanation: V is a vein (likely the vena cava) and Y is an artery (the aorta). Veins have thinner walls composed of less muscle and elastic tissue compared to arteries because they carry blood at a lower pressure back to the heart. The thick, muscular, and elastic walls of arteries like the aorta are necessary to withstand the high pressure of blood being pumped from the heart. Furthermore, veins contain valves to ensure blood flows in one direction against gravity, whereas the high pressure in arteries maintains flow without needing valves.
Other acceptable differences include: Veins have a wider lumen (internal space) compared to arteries. Arteries have more elastic fibers to allow for stretch and recoil.
(c)(i)
1. Smoking
2. High cholesterol diet / Obesity / Diabetes / Lack of exercise / High stress / Family history (genetics) / Age
Explanation: Coronary heart disease (CHD) is caused by the buildup of fatty plaques (atheroma) in the coronary arteries, reducing blood flow to the heart muscle. Many lifestyle and genetic factors increase this risk. Smoking damages the lining of arteries and promotes atherosclerosis. A diet high in saturated fats and cholesterol can lead to high blood cholesterol levels, contributing to plaque formation. Other significant risk factors include obesity, diabetes, physical inactivity, chronic stress, a family history of heart disease, and increasing age.
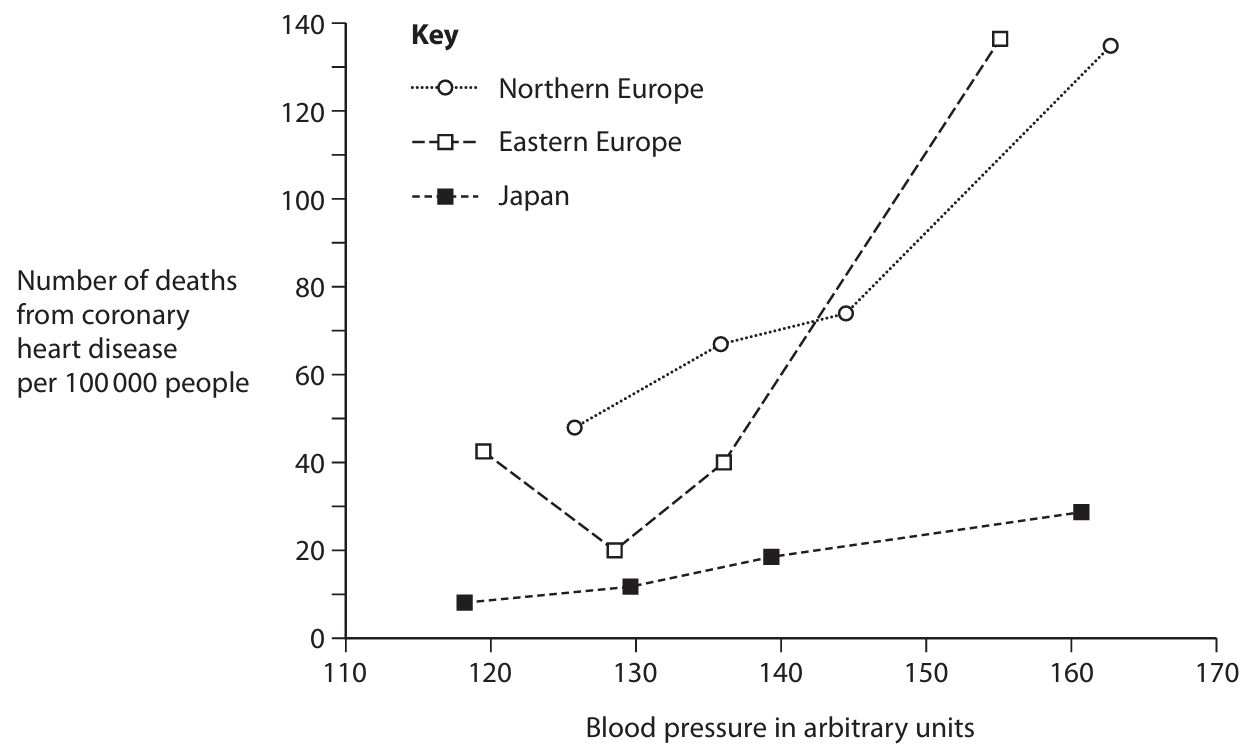
(c)(ii) Comments based on the graph and knowledge:
General Trend: The graph shows a positive correlation between blood pressure and the number of deaths from coronary heart disease (CHD) for all three regions. As blood pressure increases, so does the mortality rate from CHD. This is biologically expected because high blood pressure (hypertension) damages the inner lining of arteries, making them more susceptible to atherosclerosis, which is the primary cause of CHD.
Regional Comparisons:
- Japan: Japan consistently has the lowest number of deaths from CHD across all blood pressure levels shown on the graph. Even at higher blood pressures, the death rate in Japan is significantly lower than in European regions at similar pressures. This suggests that factors other than blood pressure are very effective at mitigating CHD risk in Japan. These factors likely include a traditional diet low in saturated fats (e.g., rich in fish, rice, vegetables), high consumption of omega-3 fatty acids, potentially lower obesity rates, and other genetic or lifestyle factors that protect cardiovascular health.
- Northern and Eastern Europe: Both European regions show higher death rates from CHD compared to Japan at equivalent blood pressures. Northern Europe generally has higher death rates than Eastern Europe at the highest blood pressures, though Eastern Europe may show a steeper increase or different pattern. The higher rates in Europe could be linked to diets higher in saturated fats and processed foods, higher rates of smoking and alcohol consumption, or other lifestyle factors that exacerbate the risks associated with high blood pressure.
Conclusion: While high blood pressure is a significant risk factor for CHD globally, the graph clearly indicates that its impact is modulated by other regional factors. Japan’s population seems to have protective elements in their diet, lifestyle, or genetics that reduce the overall risk and mortality from CHD, even in the presence of hypertension. In contrast, populations in Northern and Eastern Europe may have additional risk factors that compound the dangers of high blood pressure, leading to higher mortality rates. This highlights that CHD is a multifactorial disease, and public health strategies must address multiple risk factors simultaneously.

▶️ Answer/Explanation
(a) (i)
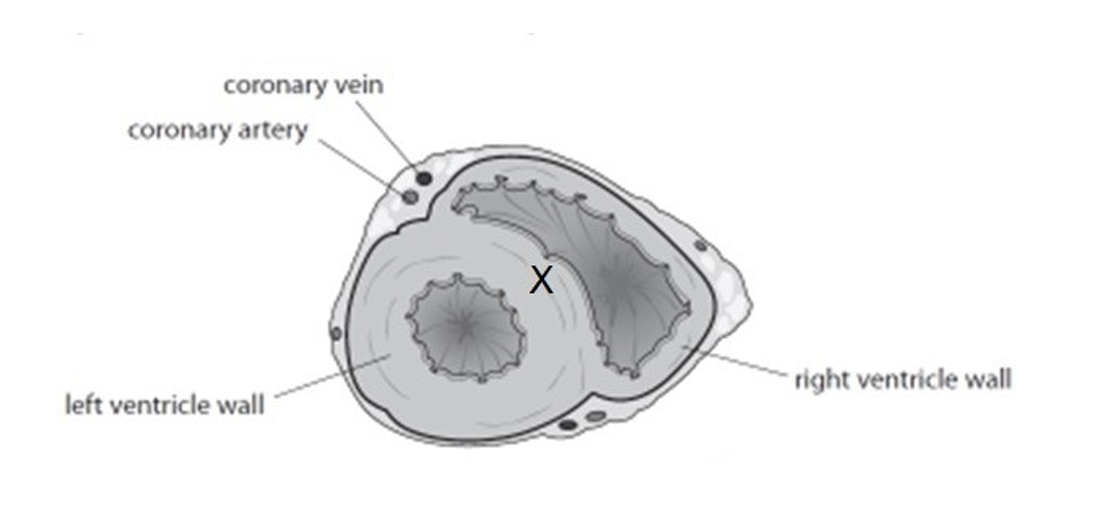
Answer: The X should be drawn on the vertical wall separating the left and right ventricles.
Explanation: The septum is the muscular wall that divides the left and right sides of the heart, specifically the ventricles. Its primary function is to prevent the mixing of oxygenated and deoxygenated blood. On a transverse section diagram, it appears as a thick, central wall between the two ventricles.
(a) (ii)
Answer:
1. The coronary artery contains oxygenated blood / has a high concentration of oxygen, whereas the coronary vein contains deoxygenated blood / has a low concentration of oxygen.
2. The coronary artery contains a low concentration of carbon dioxide, whereas the coronary vein contains a high concentration of carbon dioxide.
Explanation: The coronary artery is a branch of the aorta and carries oxygen-rich blood away from the heart to the heart muscle itself. After the heart muscle has used the oxygen for respiration, the now deoxygenated blood, which also contains a higher concentration of the waste product carbon dioxide, is collected by the coronary veins to be returned to the right atrium.
(a) (iii)
Answer: The wall of the left ventricle is much thicker and more muscular than the wall of the right ventricle.
Explanation: This structural difference is due to their different functions. The right ventricle only needs to pump deoxygenated blood a short distance to the lungs at relatively low pressure. In contrast, the left ventricle must generate enough force to pump oxygenated blood out through the aorta to the entire body against the high pressure of the systemic circulation. The thicker muscle in the left ventricle wall allows it to contract more powerfully to create this higher pressure.
(b)
Answer: Factors such as genetics, high blood pressure, a high-fat diet, smoking, stress, lack of exercise, and obesity can increase the risk of coronary heart disease.
Explanation: These factors contribute to the development of atherosclerosis, where fatty deposits (like cholesterol) build up and harden on the inner walls of the coronary arteries. This process, called atherosclerosis, narrows the arteries, reducing blood flow to the heart muscle.
– Genetics: Some individuals inherit genes that predispose them to high cholesterol levels or high blood pressure.
– High Blood Pressure: This puts extra strain on the artery walls, making them more susceptible to damage and the accumulation of fatty deposits.
– High-Fat Diet: A diet rich in saturated fats can lead to high levels of LDL cholesterol (‘bad’ cholesterol) in the blood, which is a key component of the fatty plaques.
– Smoking: Chemicals in tobacco can damage the lining of the arteries, encouraging plaque formation. Smoking also increases blood pressure and the risk of blood clots.
– Lack of Exercise: Regular exercise helps maintain healthy blood pressure, weight, and cholesterol levels. Without it, these risk factors can increase.
– Obesity: Being overweight increases the strain on the heart and is often linked to high blood pressure, high cholesterol, and diabetes.
The narrowed arteries can lead to angina (chest pain) or, if a clot forms and completely blocks an artery, a myocardial infarction (heart attack).


▶️ Answer/Explanation
(a) (i) D
Explanation: Structure Q is the trachea (windpipe), which is the main airway leading from the larynx to the bronchi. Structure R is a bronchus (plural: bronchi). The trachea splits into two main bronchi, one leading to each lung. Option A is incorrect because Q is not a bronchiole (which are smaller branches) and R is not the trachea. Option B is incorrect because while R is the trachea, Q is a bronchus, not a bronchiole. Option C is incorrect because while Q is the trachea, R is a bronchus, not a bronchiole.
(a) (ii)
Explanation: Structure S is the diaphragm. During exhalation, the diaphragm relaxes. As it relaxes, it moves upwards, returning to its domed shape. This upward movement decreases the volume of the thoracic cavity (the chest). According to the principles of gas pressure, when the volume of a container decreases, the pressure inside it increases. This increased pressure in the lungs forces air out down the pressure gradient, from the high pressure in the lungs to the lower pressure of the outside atmosphere.
(b)
Explanation: The graph shows that a person with lung disease has a significantly lower vital capacity (the maximum volume of air they can exhale) and a slower rate of exhalation compared to a healthy person. This is often due to conditions like asthma or COPD which cause the airways to become narrowed or obstructed. The narrowed airways make it physically harder to move air out of the lungs quickly and completely. This means that during exercise, the person cannot expel carbon dioxide or take in fresh oxygen efficiently. The build-up of CO₂ and lack of O₂ leads to a low oxygen level in the blood (hypoxia) and a high carbon dioxide level. The body perceives this distress, triggering feelings of breathlessness (dyspnea) to make the person slow down and breathe more. Because their respiratory system cannot meet the increased oxygen demand of their muscles during exercise, they become fatigued very quickly and are unable to sustain physical activity.
▶️ Answer/Explanation
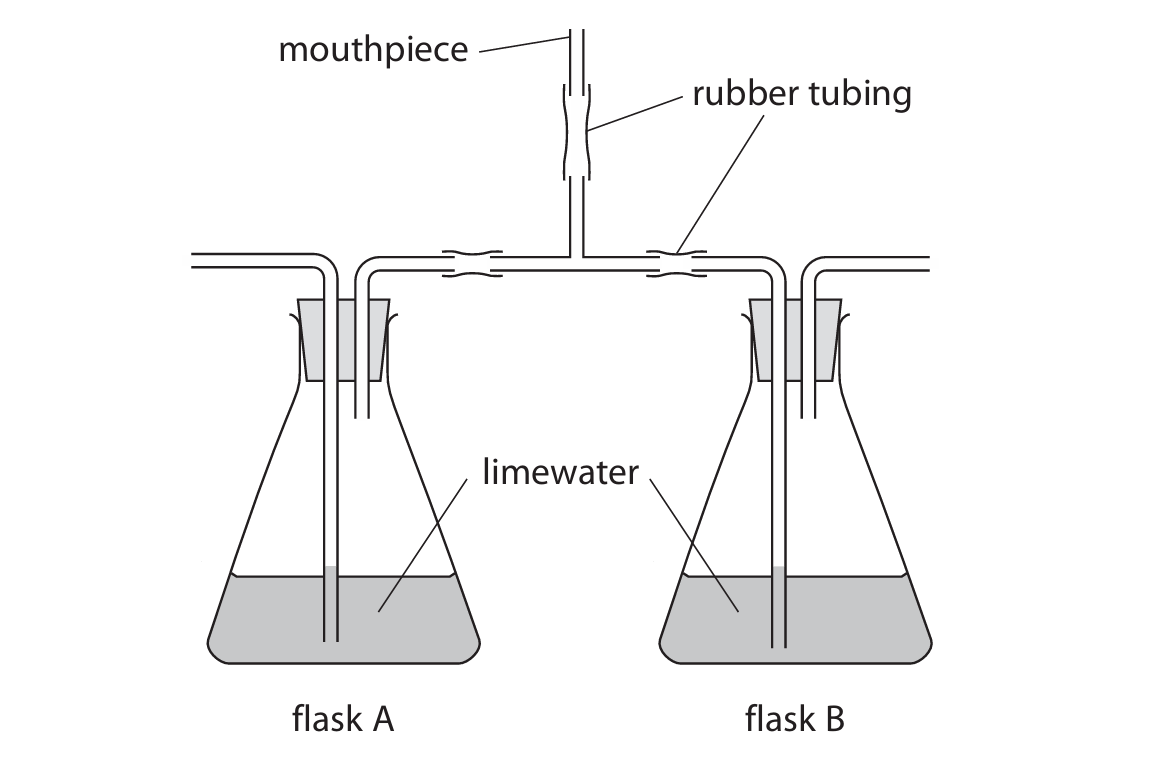
(a)(i) Exhaled air passes through Flask B.
Explanation: The mouthpiece is connected to a long tube that goes into the limewater in Flask B. When the student exhales, the air is forced down this tube and bubbles through the limewater in Flask B. The setup for Flask A is typically for drawing in inhaled air, and it wouldn’t have a tube submerged in the liquid to prevent limewater from being sucked into the mouth.
(a)(ii) The limewater in Flask A will stay clear or show little change, while the limewater in Flask B will turn cloudy/milky.
Explanation: Inhaled air (passing through or near Flask A) has a low concentration of carbon dioxide, so the limewater remains clear. Exhaled air (bubbled through Flask B) has a high concentration of carbon dioxide due to respiration. Carbon dioxide reacts with limewater (calcium hydroxide) to form insoluble calcium carbonate, which makes the solution appear cloudy or milky.
(a)(iii) An alternative substance is hydrogen-carbonate indicator (or bicarbonate indicator).
Explanation: Hydrogen-carbonate indicator is a solution that changes color in response to changes in carbon dioxide concentration. It turns from red to yellow as CO₂ concentration increases, which would happen when exhaled air is passed through it. This provides a visual, qualitative comparison similar to limewater.
(b) The roles are:
- The diaphragm contracts and flattens, moving downwards.
- The external intercostal muscles contract.
- This causes the rib cage to move upwards and outwards.
- These actions increase the volume of the thoracic cavity (chest cavity).
- The increase in volume causes a decrease in pressure inside the thoracic cavity compared to the atmospheric pressure outside.
- Due to this pressure difference, air is drawn into the lungs through the trachea, inflating them.
Explanation: Inhalation is an active process requiring muscle contraction. The diaphragm and intercostal muscles work together to expand the chest volume. According to Boyle’s Law, an increase in volume leads to a decrease in pressure. The higher atmospheric pressure outside then pushes air into the lower-pressure lungs until the pressures equalize. This coordinated action is essential for breathing in.
▶️ Answer/Explanation
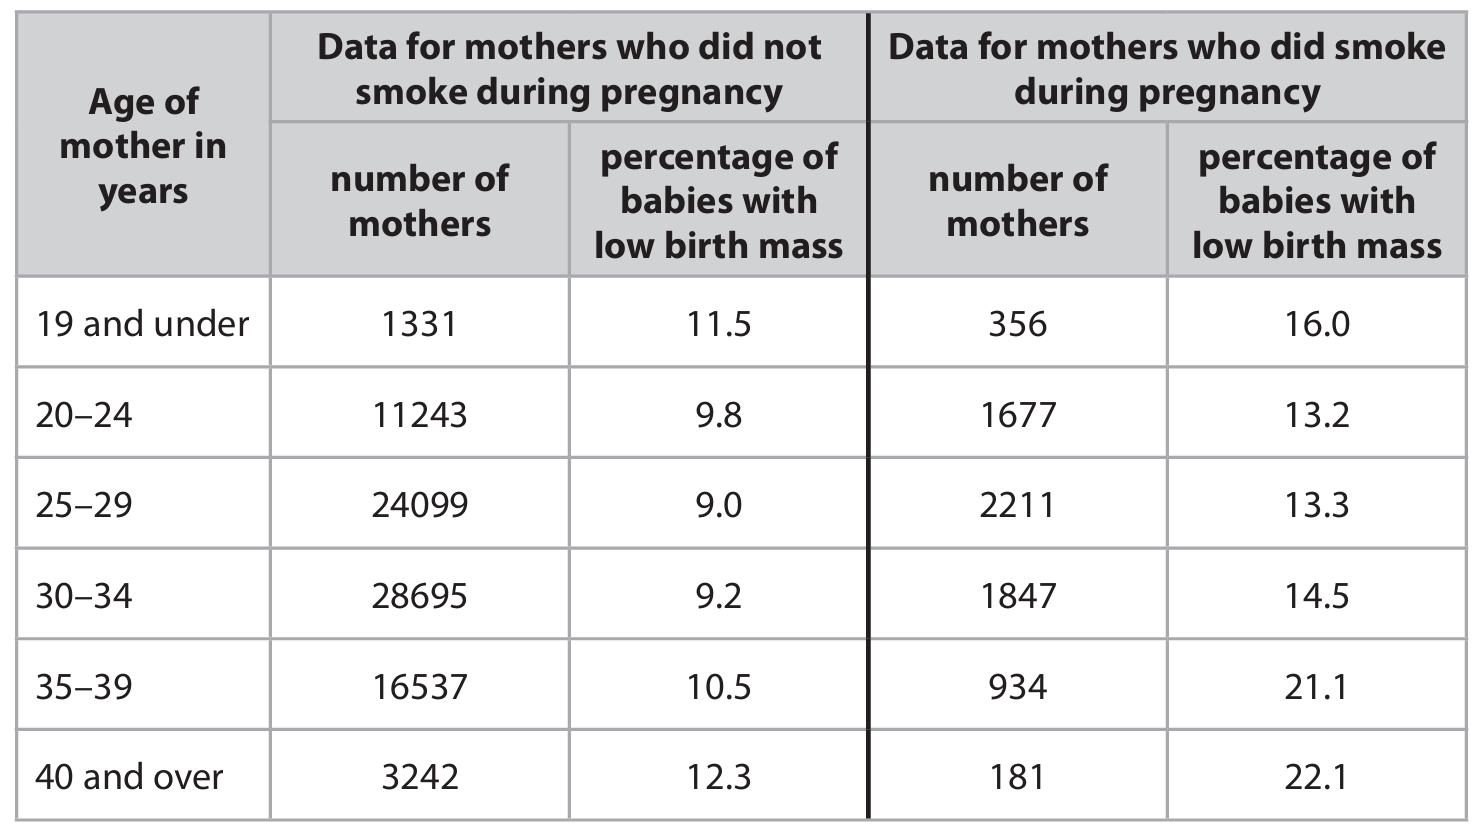
(a)(i) 21.1%
Explanation: To calculate the percentage of mothers aged 19 and under who smoked during pregnancy, we need to find the proportion of smokers in that age group. The number of smokers is 356, and the total number of mothers (smokers + non-smokers) is 1331 + 356 = 1687. The percentage is calculated as (356 ÷ 1687) × 100 = 21.1% (rounded to one decimal place).
(a)(ii) 12:1
Explanation: To determine the ratio of non-smokers to smokers, we first need to calculate the total number of non-smokers and smokers across all age groups. Total non-smokers = 1331 + 11243 + 24099 + 28695 + 16537 + 3242 = 85147. Total smokers = 356 + 1677 + 2211 + 1847 + 934 + 181 = 7206. The ratio of non-smokers to smokers is 85147:7206. To express this as n:1, we divide both sides by 7206: 85147 ÷ 7206 ≈ 11.82, which rounds to the nearest whole number as 12. So the ratio is 12:1.
(b)
Explanation: While the data shows a correlation between smoking and low birth mass, it would be premature to conclude that smoking is the main factor based solely on this data. Here’s a balanced analysis:
Evidence supporting the student’s conclusion:
- At every age group, the percentage of babies with low birth mass is higher for mothers who smoked compared to those who didn’t. For example, in the 35-39 age group, smokers had 21.1% low birth mass babies compared to 10.5% for non-smokers.
- The study involves a large sample size (over 92,000 mothers total), which adds credibility to the findings.
- Biologically, smoking reduces oxygen supply to the fetus due to carbon monoxide binding to hemoglobin more strongly than oxygen. This can impair fetal development and lead to lower birth weight.
Evidence challenging the student’s conclusion:
- The data shows that age is also a significant factor. For non-smokers, the percentage of low birth mass babies is higher at both extremes of age (11.5% for ≤19 and 12.3% for ≥40) compared to the middle age groups (9.0-10.5%).
- The effect of smoking appears to be more pronounced in older mothers. For mothers ≥40, smokers have 22.1% low birth mass compared to 12.3% for non-smokers – a difference of 9.8 percentage points, while for mothers 25-29, the difference is only 4.3 percentage points (13.3% vs 9.0%).
- The study doesn’t account for other potential factors that could influence birth mass, such as:
- Maternal nutrition and diet
- Maternal weight and overall health
- Alcohol consumption
- Quality of prenatal care
- Genetic factors
- Number of years the mother has been smoking
- The data is correlational, not experimental, so we cannot establish causation definitively.
In conclusion, while smoking appears to be a significant factor associated with low birth mass, the data suggests that it is not necessarily the main factor, as maternal age and other unmeasured variables also play important roles. A more comprehensive study controlling for these other factors would be needed to determine the primary cause of low birth mass.

▶️ Answer/Explanation
(a)(i) B (bronchus)
Explanation: Structure R is identified as the bronchus. The bronchi are the main passageways into the lungs, branching off from the trachea. Bronchioles (option A) are smaller branches further down the respiratory tree and lack cartilage, while the oesophagus (option C) is part of the digestive system leading to the stomach, and the trachea (option D) is the single windpipe before it splits into the bronchi.
(a)(ii)
Explanation: Structure S is the diaphragm. When a person breathes in (inspiration), the diaphragm contracts and flattens, moving downwards. This action increases the volume of the thoracic cavity. According to Boyle’s law, an increase in volume leads to a decrease in pressure inside the lungs compared to the atmospheric pressure outside. This creates a pressure gradient, causing air to flow from the high-pressure area (outside) to the low-pressure area (inside the lungs), enabling inhalation.
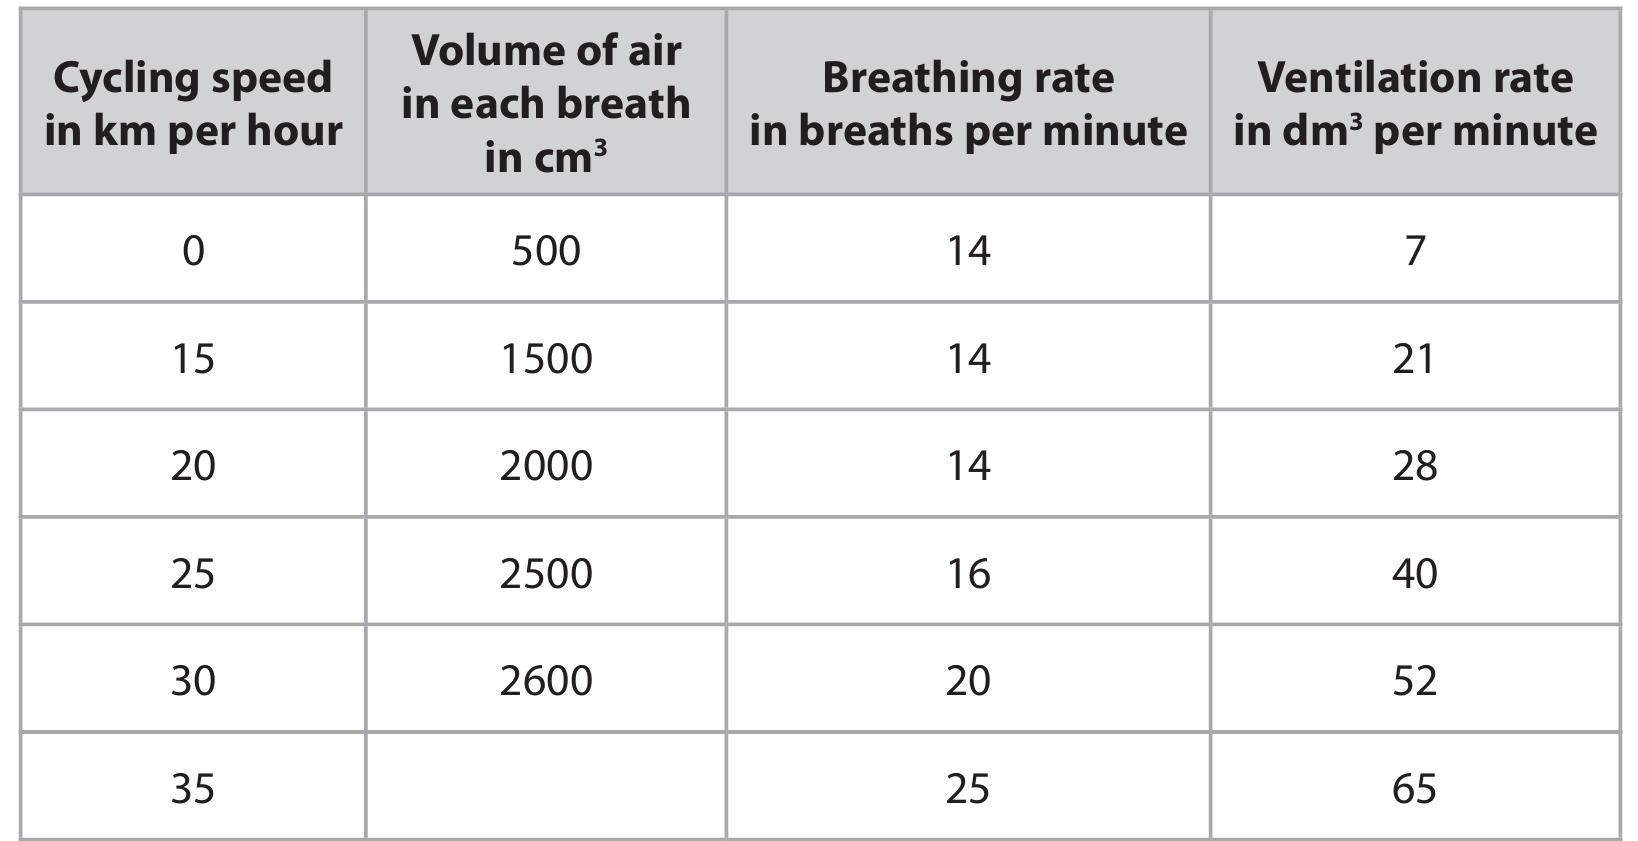
(b)(i) (Cycling) speed
Explanation: The independent variable is the factor that the scientist deliberately changes or manipulates during the investigation. In this experiment, the scientist systematically increases the cycling speed (from 0 km/h to 35 km/h) to observe its effect on the ventilation rate. Therefore, the cycling speed is the independent variable.
(b)(ii) 2600 cm3
Explanation: The ventilation rate is the total volume of air breathed out per minute. It is calculated by multiplying the volume of air per breath (tidal volume) by the breathing rate. The formula is: Ventilation rate = Tidal volume × Breathing rate.
We are given:
- Ventilation rate = 65 dm3/min
- Breathing rate = 25 breaths/min
- 1 dm3 = 1000 cm3
First, convert the ventilation rate to cm3/min: 65 dm3/min × 1000 = 65,000 cm3/min.
Then, rearrange the formula to find the tidal volume: Tidal volume = Ventilation rate ÷ Breathing rate.
So, Tidal volume = 65,000 cm3/min ÷ 25 breaths/min = 2,600 cm3.
Therefore, the volume of air in each breath at 35 km/h is 2600 cm3.
(b)(iii)
Explanation: The data shows a clear trend: as the cycling speed increases, the ventilation rate also increases. For example, at rest (0 km/h), the ventilation rate is 7 dm3/min, and it rises steadily to 65 dm3/min at 35 km/h. This happens because the muscles need more oxygen and must remove more carbon dioxide during increased exercise. Initially (from 0 to 20 km/h), the increase in ventilation rate is achieved mainly by increasing the volume of air in each breath (tidal volume), as the breathing rate remains constant at 14 breaths/min. At higher speeds (from 25 km/h onwards), both the tidal volume and the breathing rate increase to meet the heightened oxygen demand and energy production required for more intense muscle activity.
(b)(iv) Repeat the investigation and calculate a mean (average) / Use more people (cyclists).
Explanation: To improve reliability, the scientist should repeat the entire investigation several times with the same person or, even better, use a larger group of people with similar characteristics (e.g., age, fitness level). By collecting multiple sets of data and calculating the mean (average) ventilation rate at each cycling speed, the scientist can reduce the effect of random errors and anomalies, making the results more consistent and dependable.

▶️ Answer/Explanation
(a)(i) The middle value.
Explanation: The median is a measure of central tendency that represents the middle number in a sorted, ascending or descending, list of numbers. If there is an odd number of observations, the median is the middle one. If there is an even number, it is the average of the two middle numbers. It effectively splits the data set into two halves.
(a)(ii) Median used as each age has wide/high range / not (influenced by) affected by / any reference to / reduces effect of extreme values / data is skewed / less affected by anomalies.
Explanation: The median is preferred over the mean in this context because the data for each age group likely has a wide range or might be skewed by extreme values (outliers). The median is not affected by very high or very low values, making it a more reliable measure of the typical vital capacity for each age group than the mean, which can be pulled up or down by outliers.
(a)(iii) A description that makes reference to two of the following:
- Increases (steeply) up to 20-25 years
- Levels off / peaks 20-25 years
- Decreases (steadily at constant rate) from 20-25 years
Explanation: The graph shows that vital capacity increases quite steeply as age increases from childhood up to the age range of 20-25 years. At this point, it reaches its peak and levels off, meaning it stays relatively constant for a short period. After this peak, from around 25 years onwards, the vital capacity begins to decrease steadily at a fairly constant rate as age continues to increase.
(a)(iv) An explanation that makes reference to two of the following:
- (Increases) (up to 20 years) as body / size / mass / chest cavity / lungs / muscle increases / grows / develops
- No / little change (from 20) no further growth / stop growing
- (Decreases) (from 25 years) as diaphragm / intercostal muscle weaker / lungs less elastic / less recoil
Explanation: The increase in vital capacity during childhood and adolescence (up to around 20 years) is due to physical growth. As the body grows, the chest cavity enlarges, and the lungs and associated muscles (like the diaphragm and intercostal muscles) develop and increase in size, allowing for a greater maximum volume of air to be expelled. From around 20 to 25 years, growth stops, so vital capacity remains relatively stable. The gradual decrease after 25 years is associated with the natural aging process, where the respiratory muscles can become weaker, and the lung tissue loses some of its elasticity, reducing the efficiency and maximum capacity of the lungs.
(a)(v) An answer that makes reference to two of the following:
- Smoking
- Lung disease / infection / condition / asthma / bronchitis / emphysema
- Fitness / how active you are
- Body size / height / mass / genetics
- Sex
- Altitude at which you live
- Pregnancy
- Pollution
Explanation: Many factors other than age can influence a person’s vital capacity. Lifestyle choices like smoking can damage lung tissue and reduce capacity. Pre-existing lung diseases or conditions like asthma also have a significant impact. A person’s fitness level is crucial; more active individuals typically have stronger respiratory muscles and better lung function. Physical attributes such as body size, height, and sex are also determining factors, as larger body size and male sex are generally associated with a higher vital capacity. Environmental factors like the altitude you live at or exposure to pollution can also affect lung function and development.
(b) A description that makes reference to three of the following:
- Count number of breaths per minute / number of breaths in stated time (at rest)
- Breathing rate count per minute / number of breaths in stated time after / during exercise
- Repeat / using more participants / use group
- Control age / sex / fitness of subjects / amount / period of exercise
Explanation: To investigate the effect of exercise on breathing rate, you would first need to measure the resting breathing rate. This is done by counting the number of breaths a student takes in one minute while they are at rest. One breath consists of one inhalation and one exhalation. Then, the student would perform a standardised exercise, such as running on the spot or stepping onto a bench for a set amount of time (e.g., 5 minutes). Immediately after the exercise, you would count their breathing rate again for one minute. To make the results more reliable, you should repeat the experiment with the same student on different days and also use a group of students to collect more data. It is important to control variables that could affect the results, such as the age, sex, and fitness level of the participants, as well as the type, duration, and intensity of the exercise they perform.
▶️ Answer/Explanation
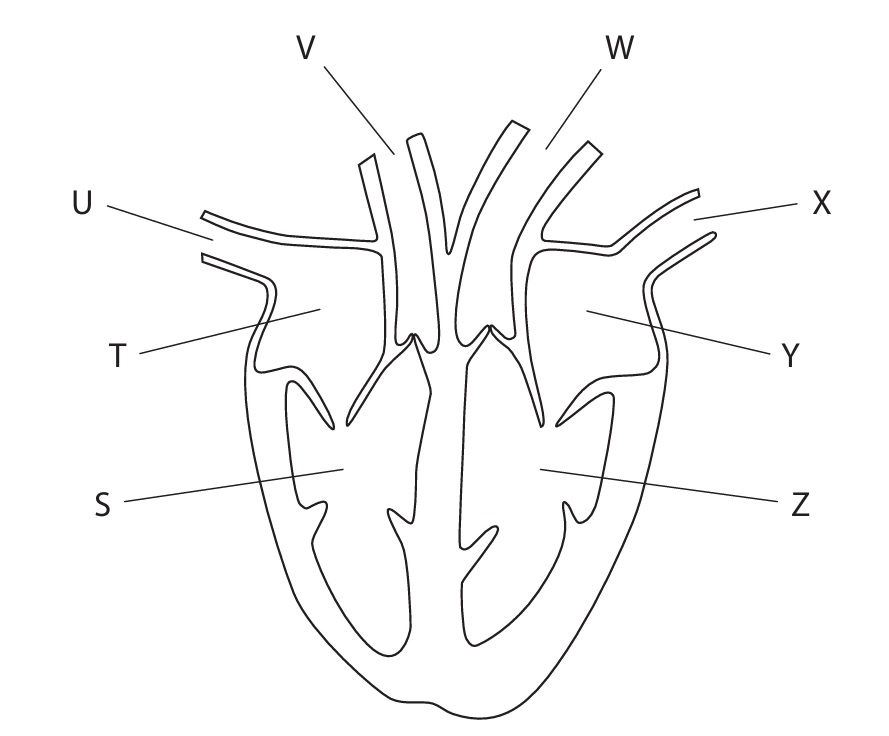
(a)(i) A U
Explanation: Blood vessel U is the vena cava, which brings deoxygenated blood from the body back to the right atrium of the heart. This is a fundamental part of the circulatory system where deoxygenated blood returns to the heart to be pumped to the lungs for oxygenation.
(a)(ii) D Z
Explanation: Chamber Z is the left ventricle, which is responsible for pumping oxygenated blood out of the heart to the rest of the body through the aorta. The left ventricle has the thickest muscular wall of all the heart chambers because it needs to generate enough pressure to circulate blood throughout the entire body.
(a)(iii)
Explanation: Chamber S (right ventricle) has a thinner wall compared to chamber Z (left ventricle). This difference exists because the right ventricle only needs to pump blood a short distance to the lungs, which requires less pressure. In contrast, the left ventricle must generate much higher pressure to pump blood throughout the entire body. The thicker, more muscular wall of the left ventricle enables it to create this greater force. Additionally, the right ventricle pumps deoxygenated blood to the lungs, while the left ventricle pumps oxygenated blood to all body tissues.
(b)
Explanation: Three essential components of a balanced diet and their functions are:
- Carbohydrates: Provide the primary source of energy for the body. They are broken down into glucose, which is used for cellular respiration to produce ATP, the energy currency of cells.
- Proteins: Essential for growth and repair of body tissues. They are used to build and maintain muscles, organs, skin, and hair. Proteins also form enzymes that catalyze biochemical reactions and antibodies for immune defense.
- Fats/Lipids: Serve as a concentrated energy store and provide insulation to help maintain body temperature. They also protect vital organs and are necessary for the absorption of fat-soluble vitamins (A, D, E, K).
Other important components include minerals like calcium for strong bones and teeth, vitamins like vitamin C for healthy connective tissue and immune function, fiber for proper digestion and bowel function, and water as a solvent for chemical reactions and transport medium.
(c)
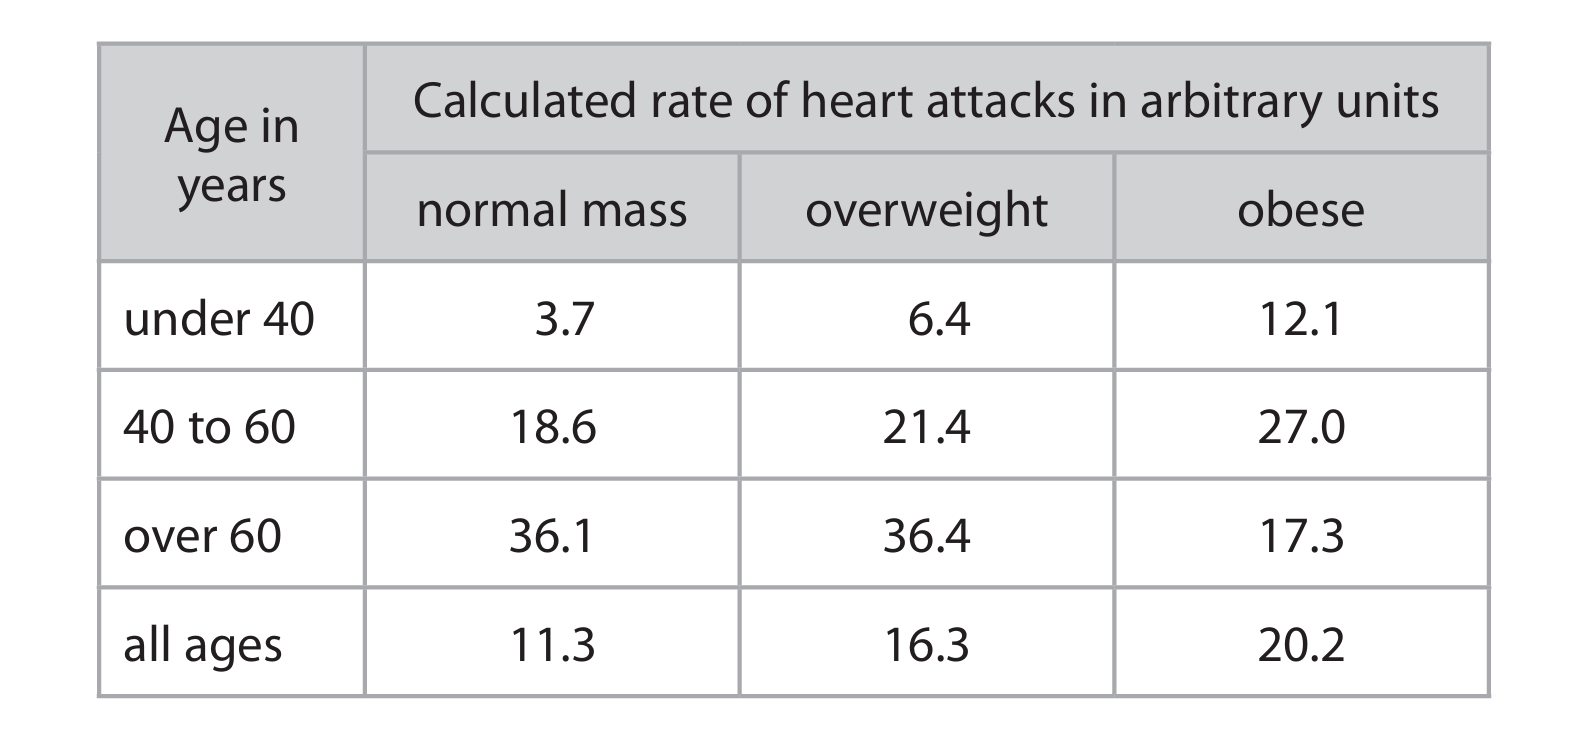
Explanation: The data reveals several important relationships between body mass, age, and heart attack risk. The study was large-scale (850 people) and long-term (20 years), which increases its reliability. Across all age groups combined, there’s a clear trend showing that as body mass increases from normal to overweight to obese, the rate of heart attacks also increases (11.3 → 16.3 → 20.2 arbitrary units).
However, when examining specific age groups, more nuanced patterns emerge. For people under 40, obesity is associated with a substantially higher heart attack rate (12.1) compared to normal mass (3.7) – more than three times the risk. In the 40-60 age group, the trend continues with obese individuals having the highest rates. Interestingly, for people over 60, the pattern reverses – obese individuals actually have the lowest heart attack rate (17.3) compared to normal mass (36.1) and overweight (36.4) individuals.
This surprising finding in the over-60 group suggests that other factors beyond body mass may become more important in determining heart attack risk in older age. The study has limitations though – it was conducted only in one Australian population, so the results might not apply universally. Other factors not accounted for in this data, such as smoking habits, exercise levels, genetic predisposition, stress, and specific dietary patterns, could also significantly influence heart attack risk and might explain some of the observed patterns.
▶️ Answer/Explanation
(a) oxygen + glucose → carbon dioxide + water + ATP
Explanation: The complete word equation for aerobic respiration is fundamental to understanding how cells produce energy. Glucose, derived from the food we eat, combines with oxygen we breathe in. Through a series of complex biochemical reactions in the mitochondria, these reactants are broken down to produce carbon dioxide (which we exhale), water, and ATP (adenosine triphosphate), which is the main energy currency used by cells for all their functions.
text
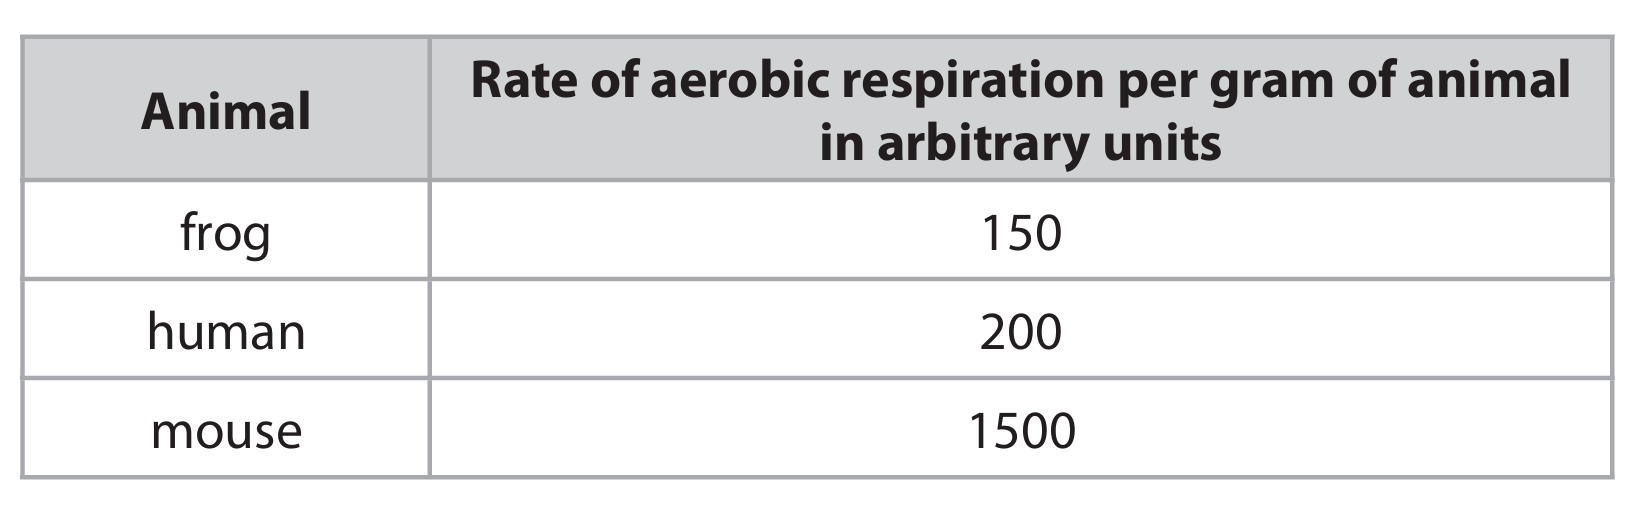
(b) A mouse has a higher metabolic rate and a larger surface area to volume ratio than a human, leading to greater heat loss that must be compensated for by increased respiration.
Explanation: When comparing animals of different sizes, the surface area to volume ratio plays a crucial role in physiological processes. A mouse, being much smaller than a human, has a relatively larger surface area through which it can lose heat to its environment. To maintain a constant body temperature (as both are mammals), the mouse must generate more heat internally. This requires a higher metabolic rate, meaning more cellular respiration occurs per gram of tissue. Since aerobic respiration consumes oxygen, the mouse consequently uses more oxygen per gram of body mass to fuel this increased metabolic activity and heat production.
(c)(i) C pulmonary vein
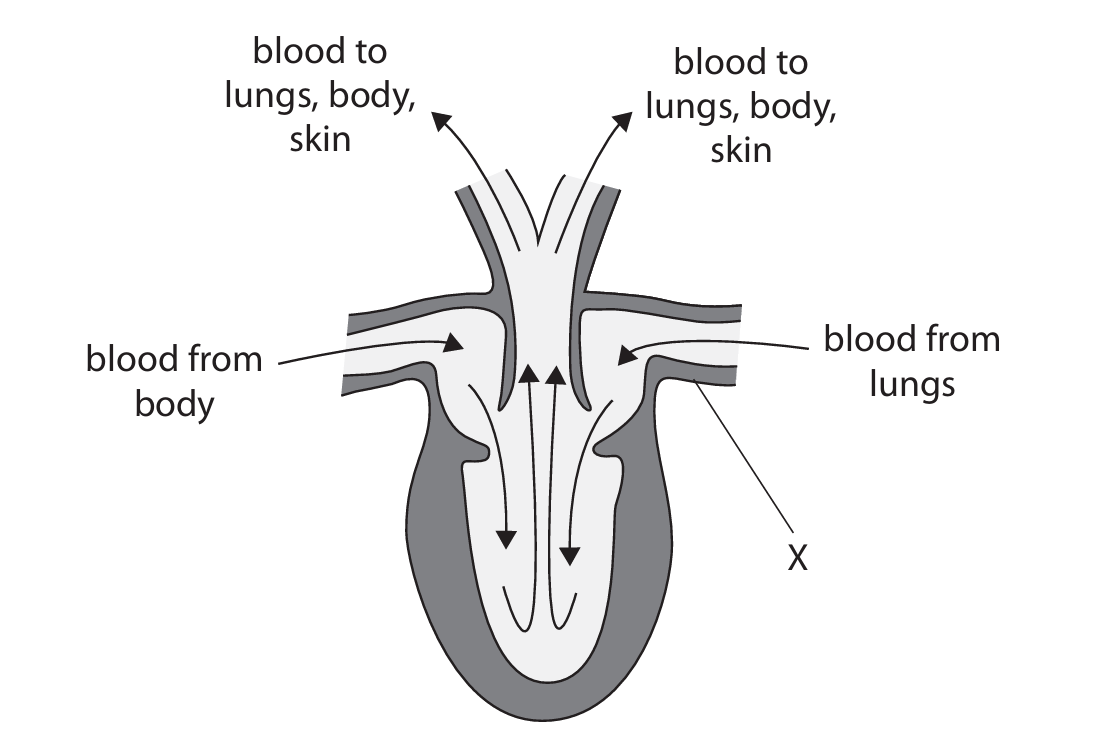
Explanation: In both frog and human circulatory systems, the pulmonary vein is responsible for carrying oxygenated blood from the lungs back to the heart. Looking at the diagram and the direction of blood flow, vessel X is bringing blood from the lungs into the heart chamber, which matches the function of the pulmonary vein.
(c)(ii) A frog heart has three chambers (two atria and one ventricle) while a human heart has four chambers (two atria and two ventricles).
Explanation: This structural difference is significant. The frog’s heart has a single ventricle that receives blood from both atria, whereas the human heart has a complete separation between the right and left ventricles. This separation in humans prevents the mixing of oxygenated and deoxygenated blood, making the circulatory system more efficient.
(c)(iii) The three-chambered heart of a frog causes mixing of oxygenated and deoxygenated blood in the single ventricle, resulting in less efficient oxygen delivery to tissues and limited endurance for sustained activity.
Explanation: The frog’s three-chambered heart presents several limitations for sustained activity. Since there’s only one ventricle, oxygenated blood returning from the lungs and skin mixes with deoxygenated blood returning from the body. This mixture is then pumped out to both the lungs and the body simultaneously. The blood going to the body therefore has a lower oxygen content than what would be delivered by a fully separated four-chambered heart. During exercise, muscles require more oxygen for aerobic respiration to produce ATP. The frog’s circulatory system cannot meet this increased demand effectively. Consequently, frog muscles resort to anaerobic respiration more quickly, leading to lactic acid buildup and fatigue. This explains why frogs are adapted for short bursts of activity (like jumping to escape predators) rather than endurance activities like long-distance running that humans are capable of.
▶️ Answer/Explanation
(a)(i) D (trachea)
A is incorrect because it is not the bronchiole
B is incorrect because it is not the bronchus
C is incorrect because it is not the oesophagus
(a)(ii) B (pulmonary artery)
A is incorrect because it is not the aorta
C is incorrect because it is not the pulmonary vein
D is incorrect because it is not the vena cava
(a)(iii) A (contract, contract)
B is incorrect because the external intercostals do not relax
C is incorrect because the diaphragm does not relax
D is incorrect because the diaphragm and the intercostals do not relax
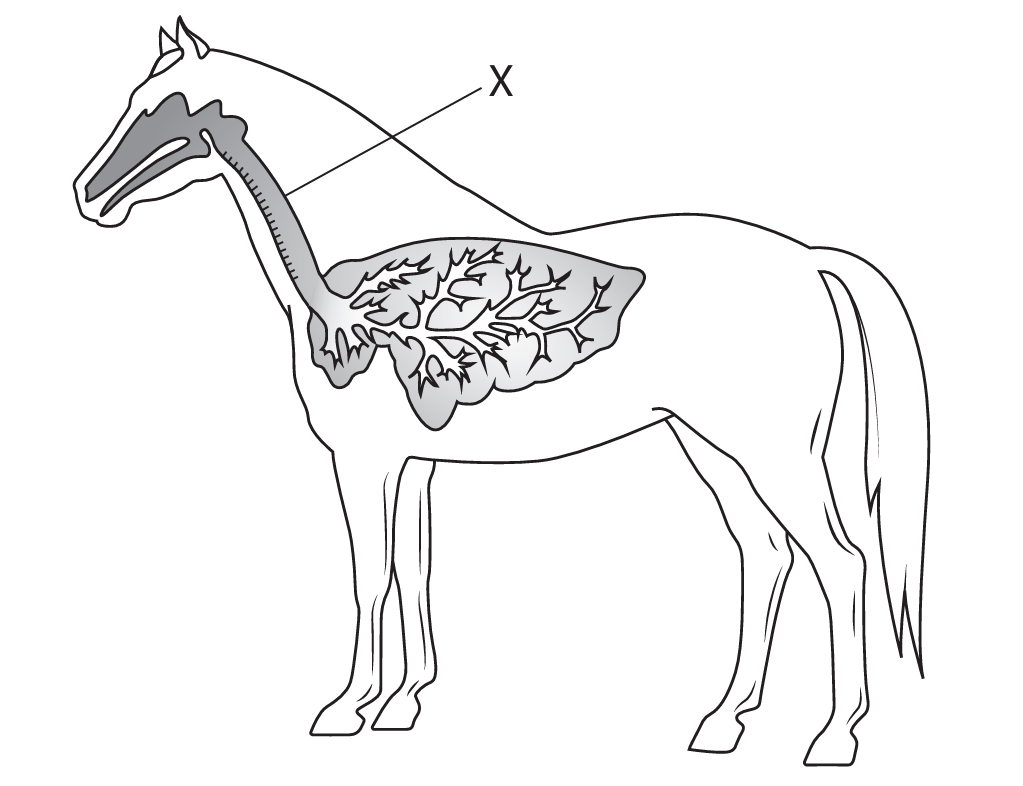
(b) An answer that makes reference to four of the following points:
• more blood to muscles / less blood to intestine (during exercise) / eq
• supply oxygen / oxygenated blood / glucose
• respiration
• energy / ATP
• muscle contraction
• less absorption of food / eq, in intestine when running /
Example full answer: When the horse runs, a much greater percentage of its total blood flow is directed to the leg muscles (increasing from 15% to 82%) to supply oxygen and glucose for aerobic respiration, which releases energy (ATP) for muscle contraction. Conversely, blood flow to the intestine decreases sharply (from 30% to 3%) because processes like digestion and absorption of food are less critical during intense physical activity. This redistribution ensures that the working muscles receive the oxygen and nutrients they need.
(c) An explanation that makes reference to two of the following points:
• (supply (more)) oxygen / there was a shortage of oxygen
• breakdown / remove lactic acid
• repay oxygen debt
• anaerobic respiration had occurred
Example full answer: The horse continues to breathe faster and deeply after running to repay an oxygen debt. During intense exercise, some muscles respire anaerobically, producing lactic acid. The continued high rate of breathing supplies extra oxygen to break down this lactic acid and to fully oxidise the remaining respiratory substrates.


▶️ Answer/Explanation
(a) A correct line graph should show:
• Linear scales on both axes, covering at least half the grid.
• Axes plotted the correct way round (Year on x-axis, Percentage on y-axis).
• Straight lines joining each consecutive data point for both e-cigarettes and normal cigarettes.
• Axes labelled ‘Year’ and ‘Percentage of students’.
• All points plotted accurately (within one small square of the correct position).
• A key or labelled lines to distinguish between ‘e-cigarettes’ and ‘normal cigarettes’.
(b) A description that makes reference to two of the following points:
• E-cigarette use increased (from 2011) up to 2015 then decreased / decreased in 2016.
• Smoking normal cigarettes decreased (from 2011 to 2016).
• At the start, e-cigarette use was lower than smoking / significantly low; by the end, e-cigarette use was higher than smoking / significantly high.
(c)
Method 1:
• Difference in percentage: \(15.8 – 8.0 = 7.8\%\)
• Change in number: \(\frac{7.8}{100} \times 60,000 = 4680\) students
OR Method 2:
• Number in 2011: \(\frac{15.8}{100} \times 60,000 = 9480\)
• Number in 2016: \(\frac{8.0}{100} \times 60,000 = 4800\)
• Change: \(9480 – 4800 = 4680\) students (2)
Award full marks for correct numerical answer (4680) without working.
(d)(i) An explanation that makes reference to four of the following points:
• Less tar.
• Fewer carcinogens / less risk of cancer.
• Less risk of emphysema / lung disease / damage to alveoli / chronic bronchitis / damage to cilia.
• Less carbon monoxide.
• Less risk of heart disease / strokes.
• Less risk of addiction / can control nicotine levels.
(d)(ii) An answer that makes reference to two of the following points:
• Non-smokers may start using e-cigarettes.
• E-cigarettes may lead to taking up smoking.
• E-cigarettes are addictive as they contain nicotine.
• Nicotine can increase risk of blood clots / increase blood pressure.
• E-cigarettes may also be harmful / damage lungs / long-term risks not yet known.

▶️ Answer/Explanation
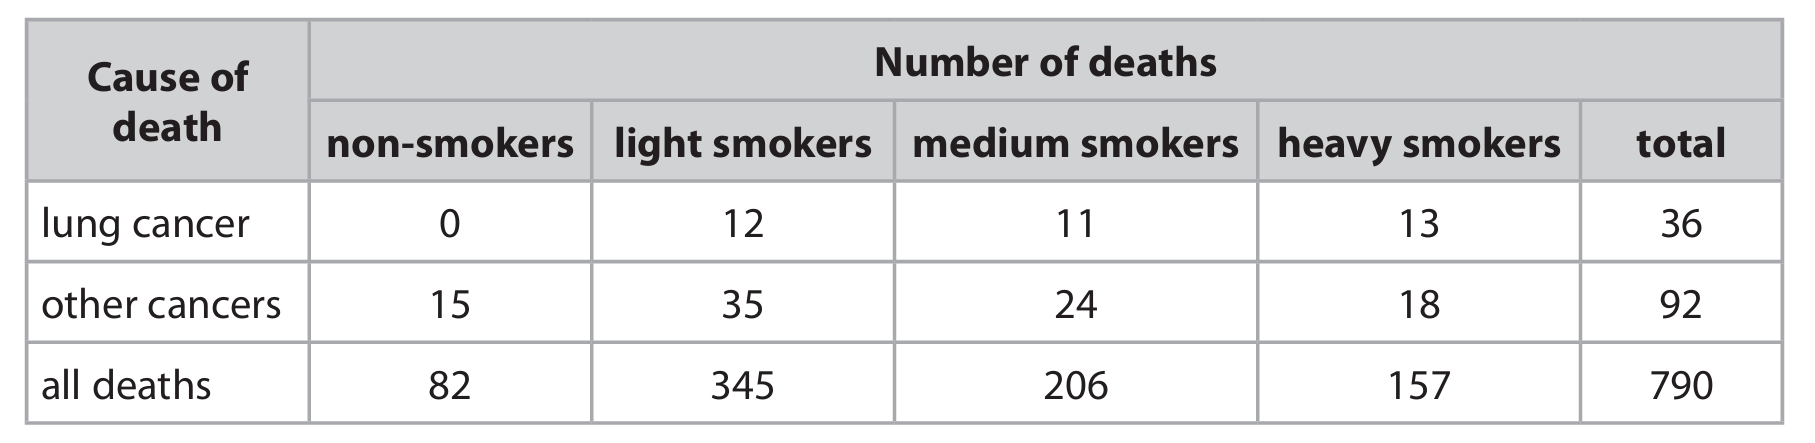
(a) (i)
Answer: A correctly drawn bar chart showing the number of deaths from lung cancer and other cancers for each smoking group.
Detailed Explanation:
To plot the bar chart correctly, you need to include the following elements:
- The y-axis should have a linear scale that covers at least half the grid and is labeled “Number of deaths”
- The x-axis should show the four smoking groups: non-smokers, light smokers, medium smokers, and heavy smokers
- Each smoking group should have two bars: one for lung cancer deaths and one for other cancer deaths
- A key should be included to distinguish between lung cancer and other cancer bars
- The bars should be plotted with accurate heights according to the data in the table
For non-smokers: lung cancer = 0, other cancers = 15
For light smokers: lung cancer = 12, other cancers = 35
For medium smokers: lung cancer = 11, other cancers = 24
For heavy smokers: lung cancer = 13, other cancers = 18

(a) (ii)
Answer: 4.8%
Detailed Explanation:
To calculate this difference, we need to find the percentage of all deaths caused by lung cancer in each group and then subtract them.
For heavy smokers:
Lung cancer deaths = 13
Total deaths = 157
Percentage = (13 ÷ 157) × 100 = 8.28% (approximately 8.3%)
For light smokers:
Lung cancer deaths = 12
Total deaths = 345
Percentage = (12 ÷ 345) × 100 = 3.48% (approximately 3.5%)
Difference = 8.28% – 3.48% = 4.8%
This calculation shows that heavy smokers had 4.8% more of their total deaths caused by lung cancer compared to light smokers.
(b)
Answer: Age may affect the likelihood of dying from lung cancer because older people have typically smoked for longer periods, their cells have had more time to accumulate mutations, and they may have weaker immune systems.
Detailed Explanation:
Age is an important factor in cancer development for several reasons:
- Longer exposure: Older individuals have typically been exposed to cigarette smoke for a longer period of time, giving more opportunity for cellular damage to accumulate
- Cumulative mutations: As we age, our cells undergo more divisions, increasing the chance of mutations occurring that could lead to cancer
- Weakened immune system: The immune system becomes less effective at identifying and destroying abnormal cells as we age
- Reduced DNA repair: Cellular repair mechanisms become less efficient with age, allowing DNA damage to persist
Without age information in the data, we cannot determine if the observed patterns are truly due to smoking alone or if age differences between the groups might be influencing the results.
(c)
Answer: Smoking can cause coronary heart disease due to narrowing and blocking of arteries, or it can cause bronchitis due to damage to the cilia and build-up of mucus in the airways.
Detailed Explanation:
Smoking has numerous harmful effects on health beyond lung cancer. One significant effect is on the cardiovascular system:
- Coronary Heart Disease (CHD): Smoking damages the lining of arteries, making them more susceptible to atherosclerosis (build-up of fatty deposits)
- This narrowing of arteries reduces blood flow to the heart muscle, which can lead to chest pain (angina) or heart attacks
- Chemicals in tobacco smoke also make blood more likely to clot, increasing the risk of blockages
Alternatively, smoking affects the respiratory system:
- Bronchitis: Smoking damages the cilia (tiny hair-like structures) that normally help clear mucus and debris from the airways
- This leads to a build-up of mucus, causing persistent coughing, shortness of breath, and increased susceptibility to lung infections
- Chronic bronchitis is characterized by a productive cough that lasts for at least three months in two consecutive years
Both of these conditions significantly reduce quality of life and can be fatal if smoking continues.