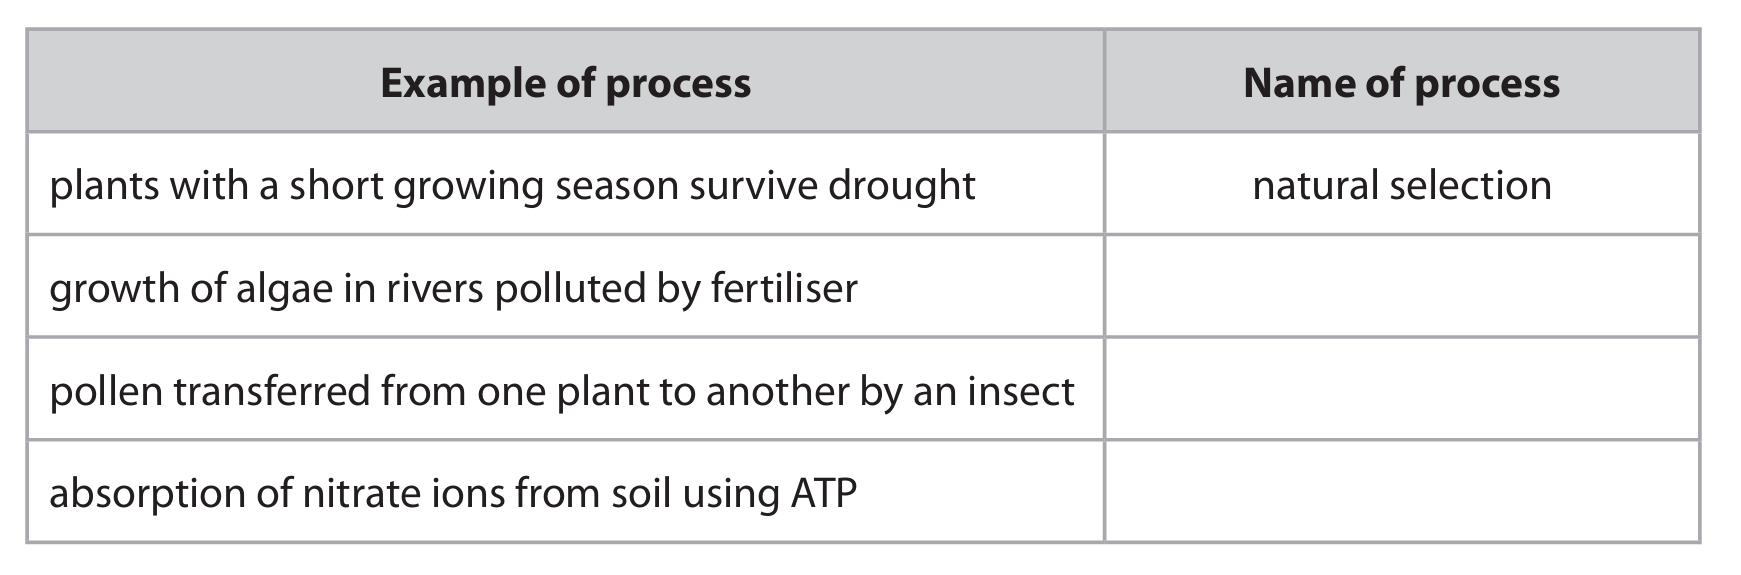
Most-appropriate topic codes (Edexcel IGCSE Biology):
- 3(h): Transport — part (a)
- 6(a): Food production — parts (b)(i), (b)(ii)
- 5(d): Human influences on the environment — parts (b)(i), (b)(ii)
- 5(b): Feeding relationships — part (b)(i)
- 2(e): Nutrition — part (a)(ii)
▶️ Answer/Explanation
(a)(i) Two substances carried in the phloem:
1. Sucrose/sugars (1)
2. Amino acids (1)
Marking guidance: ignore glucose; allow water/plant hormones/named plant hormone
(a)(ii) Explanation why insects feeding from phloem reduce crop yield:
An explanation that makes reference to three of the following:
- No/less respiration/no/less energy (1)
- No/less protein (1)
- No/less growth/new cells (1)
- Less fruit production/fewer oranges/smaller fruit (1)
Marking guidance: No credit for less sugar amino acid or glucose; Ignore less crops/less yield
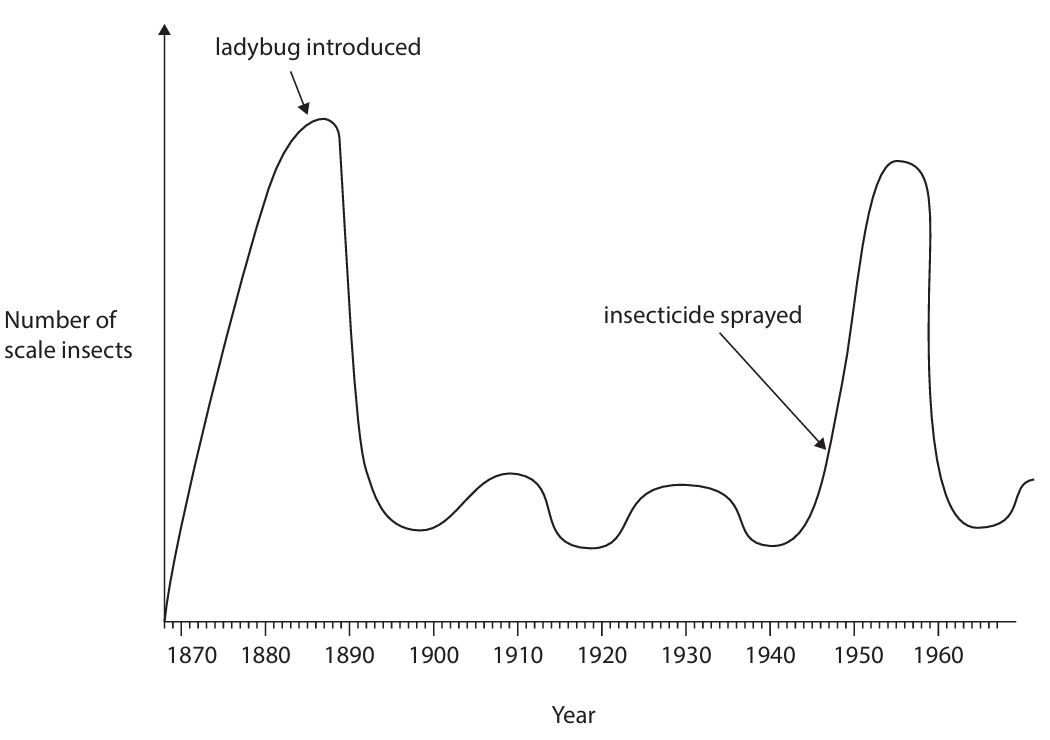
(b)(i) Discussion of effects on scale insect numbers:
An answer that makes reference to five of the following:
- Reduce (quickly/steeply) after ladybug introduced (1)
- As the ladybugs feed on scale/pests (1)
- Scale insects numbers go up and down/fluctuate/oscillate (1)
- Some pests required for ladybugs to feed on/scale insects never completely wiped out (1)
- Insecticide release causes (rapid) increase in scale insects/pests (1)
- As (more) ladybugs killed (than scales/pests) (1)
- Fewer scale insects are eaten/less predation (1)
- Insecticide becomes less effective/disperses/ladybugs recover/ladybugs develop resistance (1)
- Scale insects/pest numbers drop (1)
- Ladybugs/biological control more effective than insecticide/kill more pests (1)
(b)(ii) Three advantages of biological control instead of pesticides:
An explanation that makes reference to four of the following points:
- Lasts longer/does not need reapplication (1)
- Specific/does not affect food chain/other organisms (1)
- No residue on crop/not eaten by humans/does not affect humans (1)
- No bioaccumulation/biomagnification (1)
- Pest does not become resistant (1)
Marking guidance: allow converse; ignore cheaper alone; ignore pollution alone; allow contaminate crops; ignore immune
▶️ Answer/Explanation
(a)(i) C (secondary consumer and tertiary consumer)
A is incorrect as it is not a primary consumer
B is incorrect as it is not a primary consumer
D is incorrect as it is also a tertiary consumer
(a)(ii) • all of (the organisms of) one / a species in an area (at one time)
(a)(iii) An explanation that makes reference to three of the following:
• (energy lost) from movement
• (energy lost) from respiration / heat loss
• (energy lost) as not some not eaten / are inedible
• (energy lost) as some not digested / indigestible / faeces / egestion
• (energy loss) due to death and decay / (energy lost) to other food chains
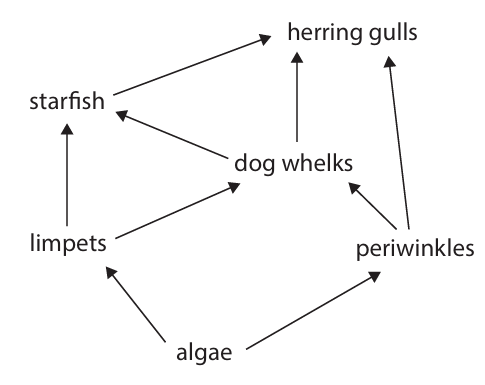
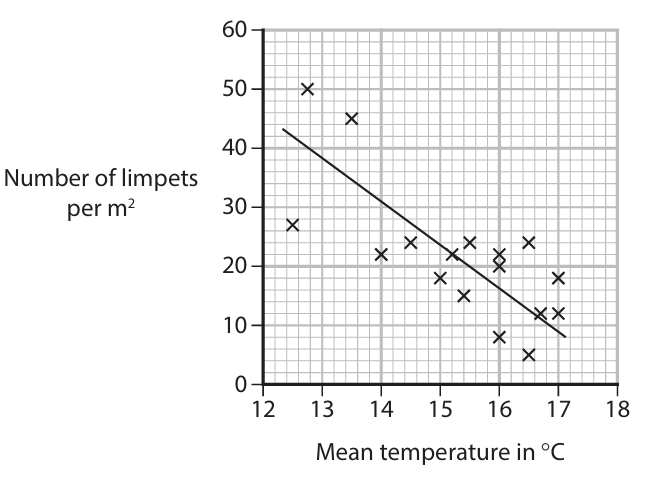
(b)(i) A description that makes reference to three of the following:
• quadrat / square in gridded area
• place randomly / choose random coordinates
• repeats
• count limpets (in quadrat / square)
• scale up for whole area multiply by area
(b)(ii) • time of day / location / area / position on shore / species of limpet / same day in August
(b)(iii) An answer that makes reference to five of the following:
1. fossil fuel use releases carbon dioxide
2. carbon dioxide is a greenhouse gas / may cause global warming
3. increased temperature reduces limpet number
4. less food / energy for starfish / dogwhelks / gulls
5. dogwhelks / gulls / starfish / secondary consumers would decrease
6. algae would increase / less algae eaten / more food for periwinkles
7. there are anomalies / outliers / not all close to line of best fit
8. other factors may affect limpet population / other greenhouse gases may have effect
9. not done for long enough time so less reliable OR done for long time / 17 years so reliable
10. data only for one month / only August / only one location / only one shore / only looks at one species

▶️ Answer/Explanation
(a)(i) • transgenic (1)
(a)(ii) A description that makes reference to three of the following:
- plasmid (is used) (1)
- restriction enzyme cuts gene / DNA / plasmid / eq (1)
- ligase joins plasmid and gene / joins DNA / eq (1)
- forming a recombinant plasmid / forming recombinant DNA / eq (1)
(b)(i) An answer that makes reference to two of the following:
- less night blindness / fewer eye problems / better vision / eq (1)
- rice is a common food / part of many diets / common crop / cheap (for consumers) to buy / eq (1)
- cheap to grow / easy to grow / easy to get large yields / eq (1)
- less health care needed / less damage to economy / eq (1)
(b)(ii) An answer that makes reference to two of the following:
- (may grow in wild and) affect food chains / food webs / ecosystems / eq (1)
- may compete with other species (in wild) / eq (1)
- may interbreed with wild plants / genes may transfer into wild plants / eq (1)
- people may think they are a risk to health / eq (1)
- may be better to give people a more balanced diet / should use natural sources of carotene / eq (1)
(c)(i) An explanation that makes reference to four of the following:
- all species decrease / eq (1)
- insects increase after 3 months / from 6 months / eq (1)
- beetles increase after 9 months / from 12 months / eq (1)
- lizard numbers do not recover / stay low / do not increase / level off after 9 months / eq (1)
- pesticide washes away / breaks down / eq (1)
- pesticide passes along food chain to beetles / to lizards / eq (1)
- insects become resistant / eq (1)
- insects increase as there are fewer beetles eating them / beetles decrease as few insects to eat / lizards decrease as few beetles to eat / eq (1)
- insects have short life cycles / lizards have long life cycle / eq (1)
(c)(ii) An answer that makes reference to two of the following:
- (biological is) more specific / does not kill other species / eq (1)
- (biological is) not toxic to humans / no residue left on plants / crops / eq (1)
- (biological is) no development of resistance / eq (1)
- (biological) lasts longer / no need to keep reapplying / eq (1)
- no bioaccumulation / no biomagnification / does not pass along food chains / eq (1)

▶️ Answer/Explanation
(a)(i) An explanation that makes reference to four of the following points (marked in pairs):
- Artery wall has a thick layer of elastic tissue / more elastic (1) as blood pressure is higher / for the wall to recoil / to expand / to smooth blood flow (1).
- Artery wall has a thick layer of muscle / more muscle (1) to control blood flow (1).
- Artery has no valves (1) as blood pressure is sufficient to prevent backflow (1).
Accept converse statements for veins. Credit thick wall due to high pressure (two marks) if other points are not given.
(a)(ii) An explanation that makes reference to three of the following points:
- The artery in CHD has a blockage / is narrower / has a narrower lumen (1).
- Less blood / less oxygen can flow to the heart muscle (1).
- This leads to less aerobic respiration / more anaerobic respiration (1).
- Less energy / less ATP is produced (1).
- Therefore, the heart is unable to beat faster / contract as effectively during exercise (1).
(b)(i) An answer that makes reference to one of the following:
- High cholesterol / high-fat diet (1)
- Lack of exercise (1)
- Stress (1)
- High salt diet (1)
- High BMI / obesity (1)
- Diabetes (1)
- Age (1)
- Sex (1)
- High blood pressure (1)
Ignore “diet”, “bad diet”, “unbalanced diet” without specific link.
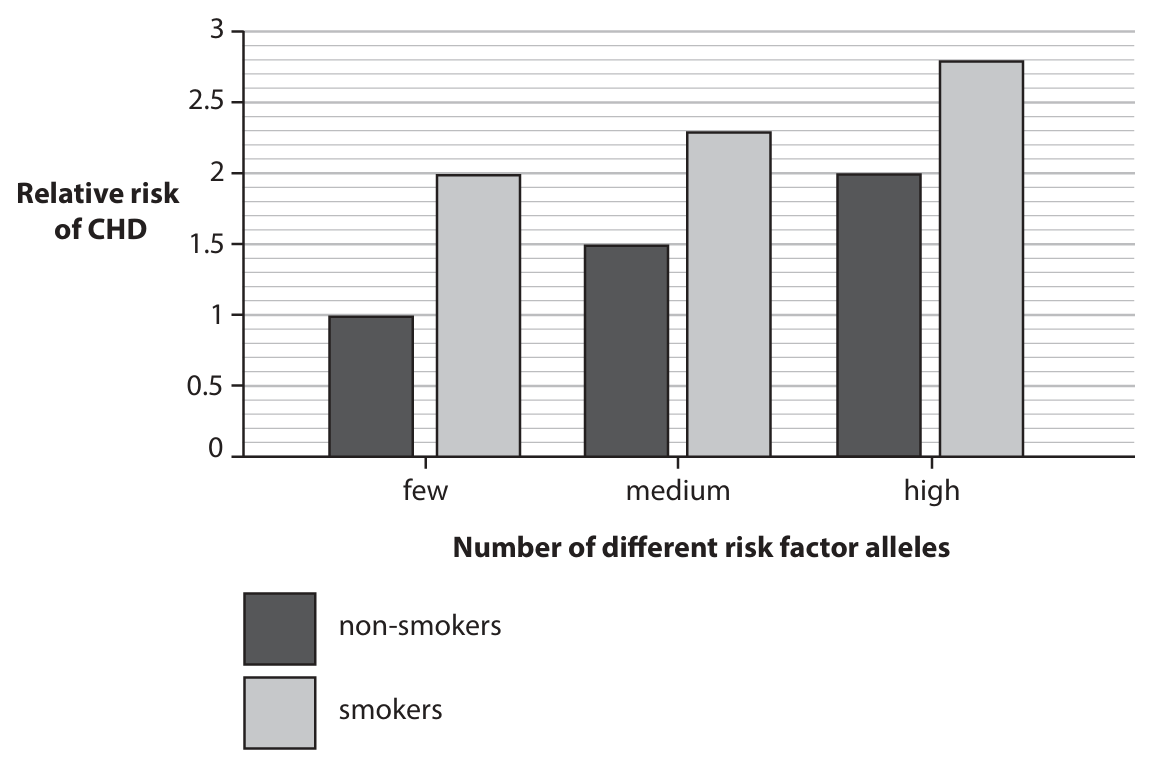
(b)(ii) An answer that makes reference to five of the following points:
- Smoking increases the risk of CHD for all allele groups (1).
- Having more risk factor alleles increases the risk of CHD (1).
- The highest risk is for smokers with a high number of alleles / The lowest risk is for non-smokers with few alleles (1).
- The biggest increase in risk from smoking is seen in those with few risk alleles / The increase from smoking is lower for the medium or high allele groups (1).
- Smokers with few alleles have a similar risk to non-smokers with many alleles (1).
- Credit use of data, e.g., smoking increases risk by approximately 1 for the low allele group (1).
- Carbon monoxide in cigarette smoke contributes to CHD (1).
- Smoking causes plaque / cholesterol build-up / blocks the coronary artery (1).
- Limitation: group size / sample size may be small (1).
- Limitation: other factors like age, sex, diet, frequency of smoking were not considered (1).
Accept: The increase in risk from smoking is similar for medium and high allele groups.
▶️ Answer/Explanation
(a) A description that makes reference to the following points:
- Plasmid (used) as vector (1).
- Restriction enzyme used to cut out gene / cut plasmid / cut DNA (1).
- Ligase used to insert gene into plasmid / stick DNA / glue DNA / stick gene with DNA (1).
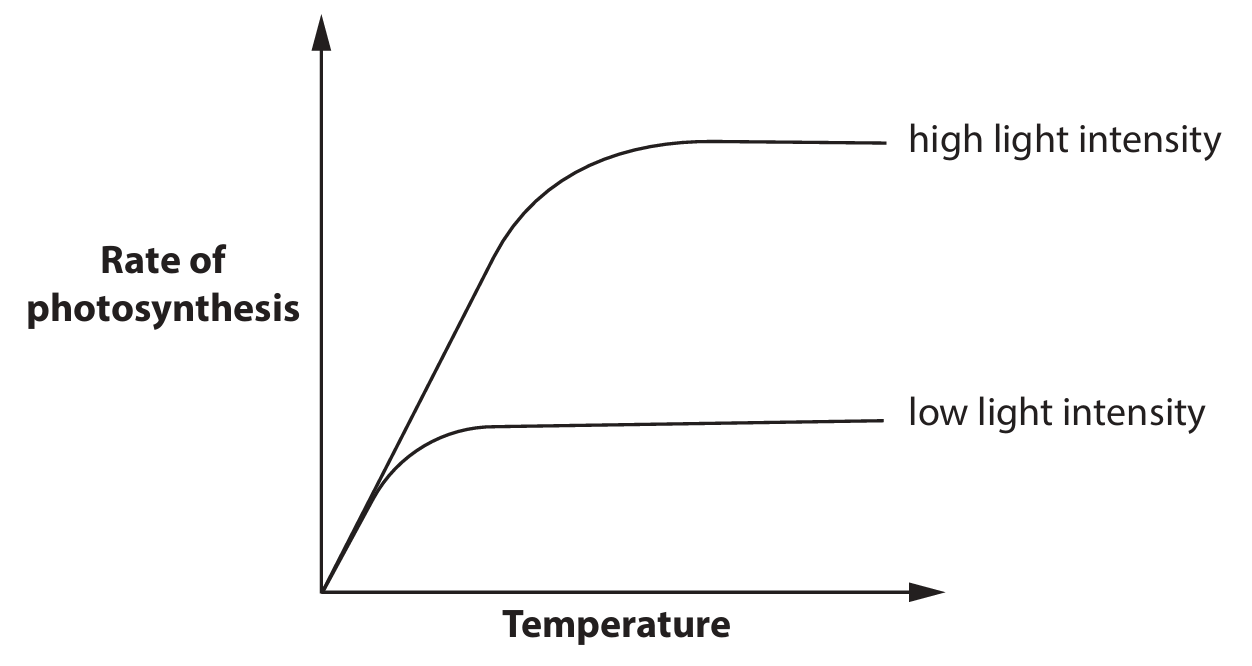
(b) An explanation that makes reference to three of the following points:
- Increasing temperature increases the rate of photosynthesis (1).
- Because particles have more (kinetic) energy / more frequent collisions / there is more enzyme activity (1).
- (At low light intensity rate levels off) so light is limiting (1).
- (At high light intensity) carbon dioxide limits rate / not enough carbon dioxide (1).
- (At high light intensity) rate levels off because temperature is no longer limiting / other factors become limiting (1).
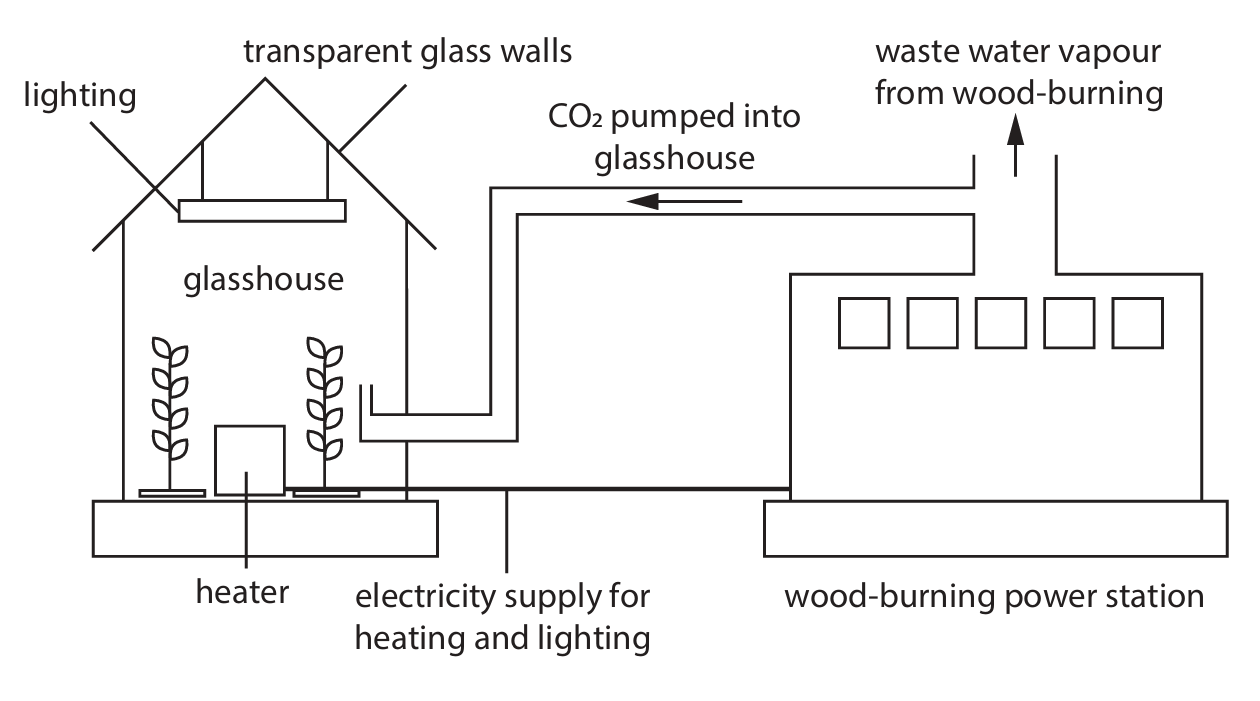
(c) An answer that makes reference to five of the following points:
- Light, carbon dioxide and (warm) temperature are supplied / provided (1).
- Therefore no factors for photosynthesis are limiting / all factors present for photosynthesis / there is more photosynthesis (1).
- So high yield / fast production / (to give high profit) / more tomatoes (1).
- No need to buy carbon dioxide / no need to buy electricity / wood is cheaper than fossil fuel / wood cheaper than buying electricity (1).
- Tomatoes protected from pests / disease / frost / cold / bad weather (1).
- Wood is renewable (energy) (1).
- Less use of fossil fuel (1).
- Carbon dioxide not released into atmosphere / is reused (1).
- Less greenhouse effect / less climate change / less ice cap melting (1).
- Less release of sulfur dioxide / less acid rain (1).

▶️ Answer/Explanation
(a)(i) C (1, 2 and 4 only)
A is not correct as water vapour is a greenhouse gas
B is not correct as oxygen is not a greenhouse gas and water vapour is a greenhouse gas
D is not correct as oxygen is not a greenhouse gas
(1 mark)
(a)(ii) An explanation that makes reference to the following:
• IR / long wave radiation is absorbed / traps IR / long wave radiation / traps heat / prevents heat escaping (1)
• (so) increases (global) temperature / earth warms / global warming (1)
(2 marks)
(b)(i)
Calculation:
Readings from the graph (in million tonnes, approximately):
Agriculture ≈ 50, Energy ≈ 110, Business ≈ 118, Transport ≈ 175.
Total = \(50 + 110 + 118 + 175 = 453\).
Percentage from energy = \(\left(\frac{110}{453}\right) \times 100 \approx 24.3\%\) (Allow range: 23.9% – 24.9%).
(3 marks for correct answer with working; 1 mark for correct readings even if unlabelled; 1 mark for dividing 110 by their total if not correct answer)
(b)(ii)
An answer that makes reference to five of the following points (1 mark each):
1. Overall emissions fall / less mass from 1990 to 2020.
2. Energy production had the highest emissions in 1990 and showed the largest fall.
3. The fall in energy emissions is due to a shift to renewable sources (wind, solar) and less use of coal/gas power stations (burning fewer fossil fuels).
4. Transport emissions increased initially, then fell from around 2009/2010.
5. The initial rise in transport was due to more cars/vehicles; the later fall is linked to more electric/hybrid cars and less commuting.
6. Agriculture emissions dropped.
7. This drop may be due to less cattle farming, reducing methane release.
8. Business emissions changed little / dropped slightly.
(5 marks total)
▶️ Answer/Explanation
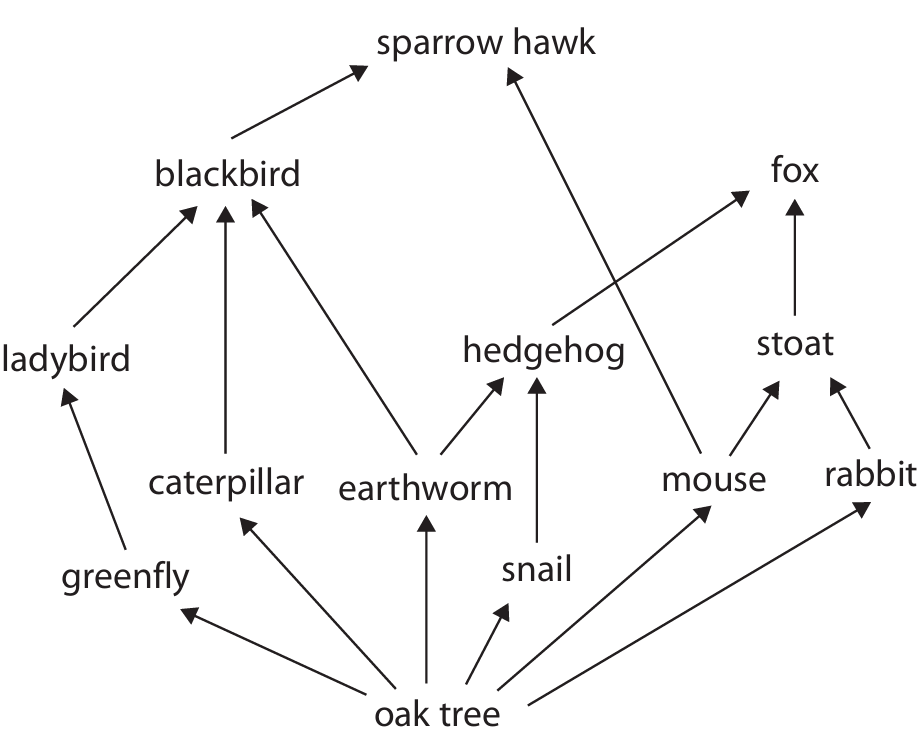
(a)(i) C (oak tree)
The oak tree is the producer because it can produce its own food via photosynthesis. It forms the base of the food web.
A is not correct because a caterpillar is a consumer (primary).
B is not correct because an earthworm is a decomposer/consumer.
D is not correct because a stoat is a tertiary consumer.
(a)(ii) D (ladybird)
A secondary consumer is an organism that feeds on primary consumers. In this web, the ladybird eats greenfly (a primary consumer).
A is not correct because a caterpillar is a primary consumer (eats producer).
B is not correct because an earthworm is a decomposer/primary consumer.
C is not correct because a fox can be a secondary or tertiary consumer, but is not exclusively a secondary consumer in this context.
(a)(iii) A (blackbird)
The blackbird is both a secondary and tertiary consumer because its diet includes both primary consumers (like caterpillars, snails) and secondary consumers (like ladybirds).
B is not correct because an earthworm is not a secondary/tertiary consumer.
C is not correct because a fox is primarily a tertiary consumer.
D is not correct because a stoat is a tertiary consumer.
(b)(i)
An explanation that makes reference to three of the following points:
• The number of blackbirds may decrease / population falls / some may die or migrate. (1 mark)
• There is less food available for blackbirds, as they eat caterpillars and ladybirds. (1 mark)
• Ladybirds also have less food (greenfly), reducing their numbers, which further reduces the blackbird’s food source. (1 mark)
• Blackbirds may switch to eating more earthworms, but this may not fully compensate. (1 mark)
• Blackbirds could consume pesticide directly or via bioaccumulation, which may poison them. (1 mark)
(Maximum 3 marks)
(b)(ii)
A description that makes reference to the following:
• Use biological control. (1 mark)
• Introduce a natural predator of greenfly, such as more ladybirds or lacewings. (1 mark)
• The predator will eat / consume / prey on the greenfly, reducing their population. (1 mark)
This method avoids the harmful side-effects of chemical pesticides on non-target species and the environment.
▶️ Answer/Explanation
(a) 6CO2 + 6H2O → C6H12O6 + 6O2
Explanation: The balanced equation for photosynthesis shows that six molecules of carbon dioxide and six molecules of water are used as reactants. In the presence of light energy and chlorophyll, these are converted into one molecule of glucose (a sugar) and six molecules of oxygen gas, which is released as a byproduct.
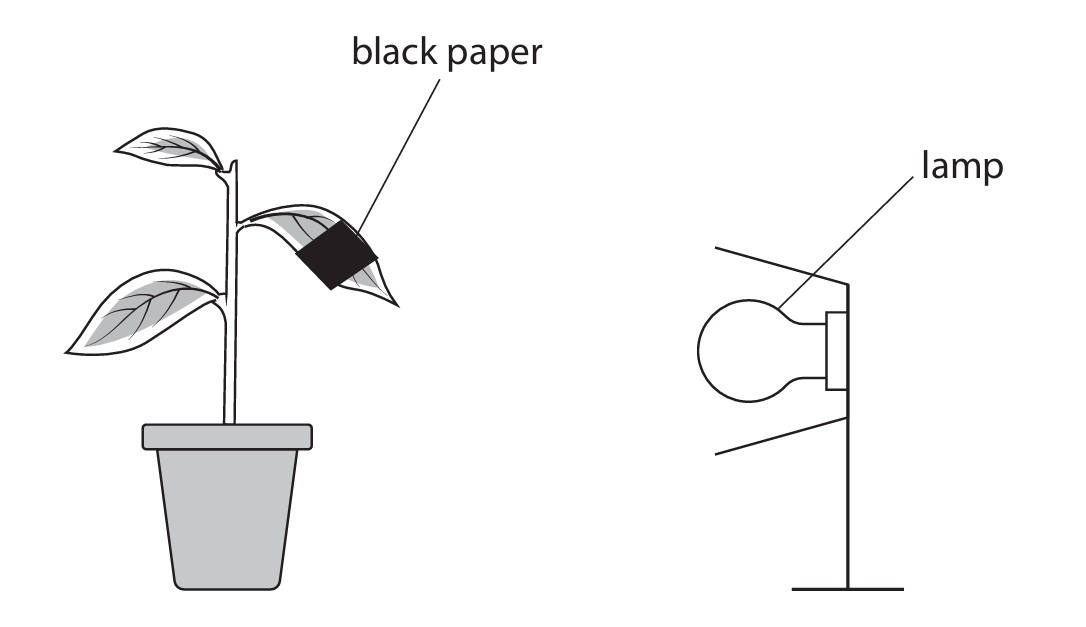
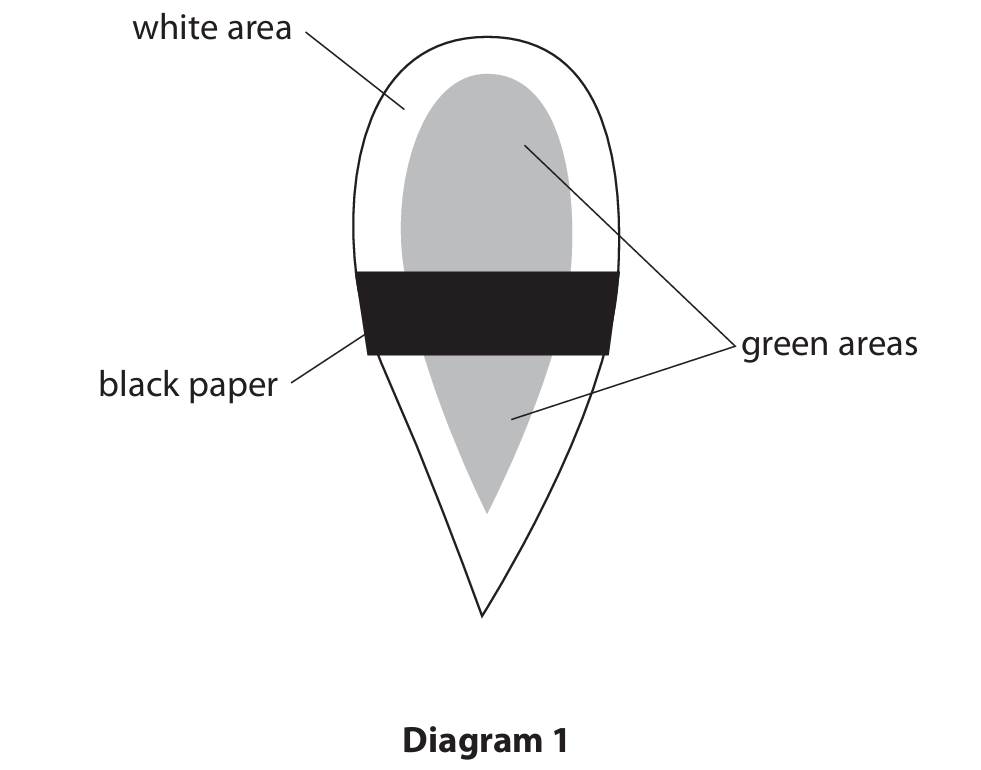
(b)(i) To destarch the leaves / remove starch / so no starch is present (in leaves) at the start of the experiment.
Explanation: Placing the plant in darkness for 24 hours ensures that any starch already present in the leaves is used up by the plant for respiration or converted to other forms for transport and storage. This is crucial because it means that any starch detected after the experiment must have been produced during the 24-hour light period, allowing the student to accurately investigate the effect of light on photosynthesis.
(b)(ii)

Explanation: Iodine solution turns blue-black in the presence of starch. Starch is only produced in areas of the leaf where photosynthesis occurs, which requires both chlorophyll (found only in the green parts) and light. Therefore, the green areas that were exposed to light will test positive for starch and appear black. The white areas lack chlorophyll and cannot photosynthesize, so they will not produce starch and will not turn black. The green area that was covered by the black paper was deprived of light and also could not photosynthesize, so it will not produce starch and will not turn black.
(c) A designed investigation that includes references to six of the following points:
- Control Variable: Plant ivy in areas with different exposures to light (e.g., a shaded area and an unshaded area).
- Organism: Use the same species/type of ivy. Use plants of the same age or starting size to ensure a fair test.
- Repeats: Repeat the investigation with multiple leaves and multiple plants in each light condition to improve reliability.
- Measurement 1: Measure the size of the leaves. This could be done by measuring their length, width, or calculating their surface area using a ruler.
- Measurement 2: Grow the ivy plants for a specified, identical period of time (e.g., one month) before taking measurements.
- Standardization 1: Control other factors that could affect leaf size, such as temperature, humidity, and carbon dioxide concentration.
- Standardization 2: Ensure the plants receive the same amounts of water, minerals, and the same type of soil to ensure any difference in leaf size is due to light intensity alone.
Example Investigation Description:
To investigate this, I would obtain several young ivy plants of the same species and similar size. I would place half of them in a very sunny location and the other half in a heavily shaded location. All plants would be planted in the same type of soil and would be given the same amount of water each day. I would leave the plants to grow for two months. After this time, I would randomly select 10 leaves from different parts of several plants in each group. I would measure the length and width of each leaf and calculate the average leaf size for the sunny group and the average leaf size for the shaded group. By comparing these averages, I could determine if the amount of sunlight affects leaf size. Using multiple plants and multiple leaves ensures the results are reliable.


▶️ Answer/Explanation
(a)(i) C (Y)
Explanation: Respiration is the process where living organisms break down organic compounds to release energy, producing carbon dioxide (CO₂) as a waste product. The arrow labelled Y shows carbon moving from organic compounds in animals back to the atmosphere as CO₂, which represents this process.
(a)(ii) Photosynthesis
Explanation: Process W shows carbon dioxide being taken from the atmosphere and converted into organic compounds in plants. This is the fundamental process of photosynthesis, where plants use light energy to fix carbon into glucose and other molecules.
(b)(i) Water vapour / Chlorofluorocarbons (CFCs)
Explanation: Water vapour is the most abundant greenhouse gas in the atmosphere. Human-made gases like Chlorofluorocarbons (CFCs), used in refrigeration and aerosols, are also potent greenhouse gases, though their use is now restricted.
(b)(ii) Carbon dioxide is likely to contribute the most to global warming.
Explanation: Although carbon dioxide (CO₂) has the lowest Global Warming Potential (GWP=1), it is emitted in vastly larger quantities (77% of emissions) compared to methane (16%) and nitrous oxide (0.77%). Furthermore, its atmospheric lifetime is extremely long (1000 years), meaning its warming effect is persistent and cumulative. The combination of its massive volume and long lifespan means the total heat trapped by CO₂ outweighs the significant but shorter-term impact of the more potent but less abundant gases.

▶️ Answer/Explanation
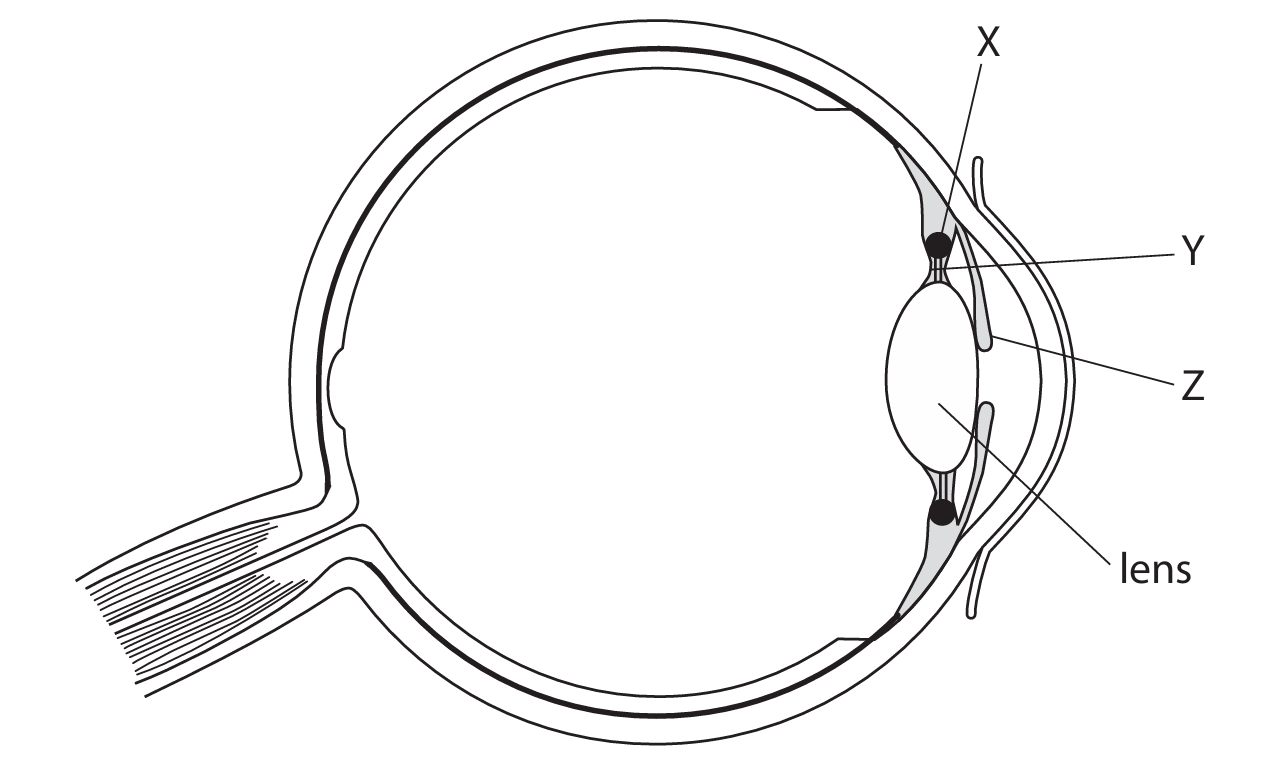
(a) (i) iris
Explanation: Structure Z is the iris. The iris is the colored part of the eye that controls the size of the pupil, thereby regulating the amount of light that enters the eye.
(a) (ii) A description that makes reference to the following three points:
- X / ciliary muscle, contracts
- Y / suspensory ligaments go slack / loosen
- lens becomes thicker / more spherical / more convex
Detailed Explanation: When focusing on a near object, the ciliary muscles (X) contract. This contraction reduces the tension on the suspensory ligaments (Y), causing them to become slack or loosen. Because these ligaments are no longer pulling the lens taut, the natural elasticity of the lens causes it to become thicker, more spherical, and more convex. This change in shape increases the refractive power of the lens, allowing it to bend light rays more sharply and focus the image of the close object correctly onto the retina.
(b) (i) An explanation that makes reference to two of the following:
- less light can pass through / refraction affected
- to retina / fovea / rods / cones / photoreceptors
- so fewer impulses (to brain)
Detailed Explanation: A cataract causes the normally clear lens to become cloudy or opaque. This cloudiness scatters and blocks light, preventing a clear, sharp image from being formed. Less light can pass through the lens to reach the light-sensitive cells (rods and cones) in the retina at the back of the eye. Furthermore, the cloudiness disrupts the precise refraction (bending) of light rays that is necessary for focusing. As a result, the light rays are not properly focused onto the retina, leading to a blurred or dim image. This faulty image results in fewer or confused nerve impulses being sent to the brain via the optic nerve, causing unclear vision.
(b) (ii) An answer that makes reference to four of the following points based on the data:
- numbers (of cataracts) increase as exposure to sunlight increases (e.g., 2 at 7 hrs vs 35 at 12 hrs).
- group sizes are different (e.g., 100 at 7 hrs vs 540 at 12 hrs), which must be considered when interpreting raw numbers.
- the proportion/percentage of cases fluctuates/does not change much between 7 and 10 hours (approx 2%, 1.9%, 2.0%, 1.6%).
- the proportion/percentage rises more noticeably after 10/11 hours (3.2% at 11 hrs, 6.5% at 12 hrs).
- the large number of people in the study overall makes it somewhat reliable, OR it is less reliable as data is only from one country/climate.
- other factors like age, genetics, diet, or protective gear (sunglasses, hats) could affect the results and are not accounted for.
Detailed Comment: The data suggests a general trend where the number of people developing cataracts increases with higher mean daily hours of sunlight exposure, from 2 cases at 7 hours to 35 cases at 12 hours. However, because the group sizes vary significantly (e.g., 100 people vs 540 people), it’s more accurate to look at the percentage of each group affected. Calculating these percentages (7h: 2%, 8h: ~1.9%, 9h: 2%, 10h: ~1.6%, 11h: ~3.2%, 12h: ~6.5%) reveals that the risk appears relatively stable and low (around 2%) for exposures up to 10 hours. A more substantial increase in risk is observed beyond 10 hours, jumping to 3.2% at 11 hours and 6.5% at 12 hours, indicating a potential threshold effect. The 25-year duration and large total sample size add weight to the findings. However, the study is limited to agricultural workers in one South Asian country, so the results may not be directly applicable to populations in different climates, with different genetics, or with different sun protection behaviors. Other unmeasured factors, such as the exact intensity of UV exposure, age of the workers, dietary intake of antioxidants, and use of protective eyewear, could also influence cataract development and are not considered in this data table.

▶️ Answer/Explanation
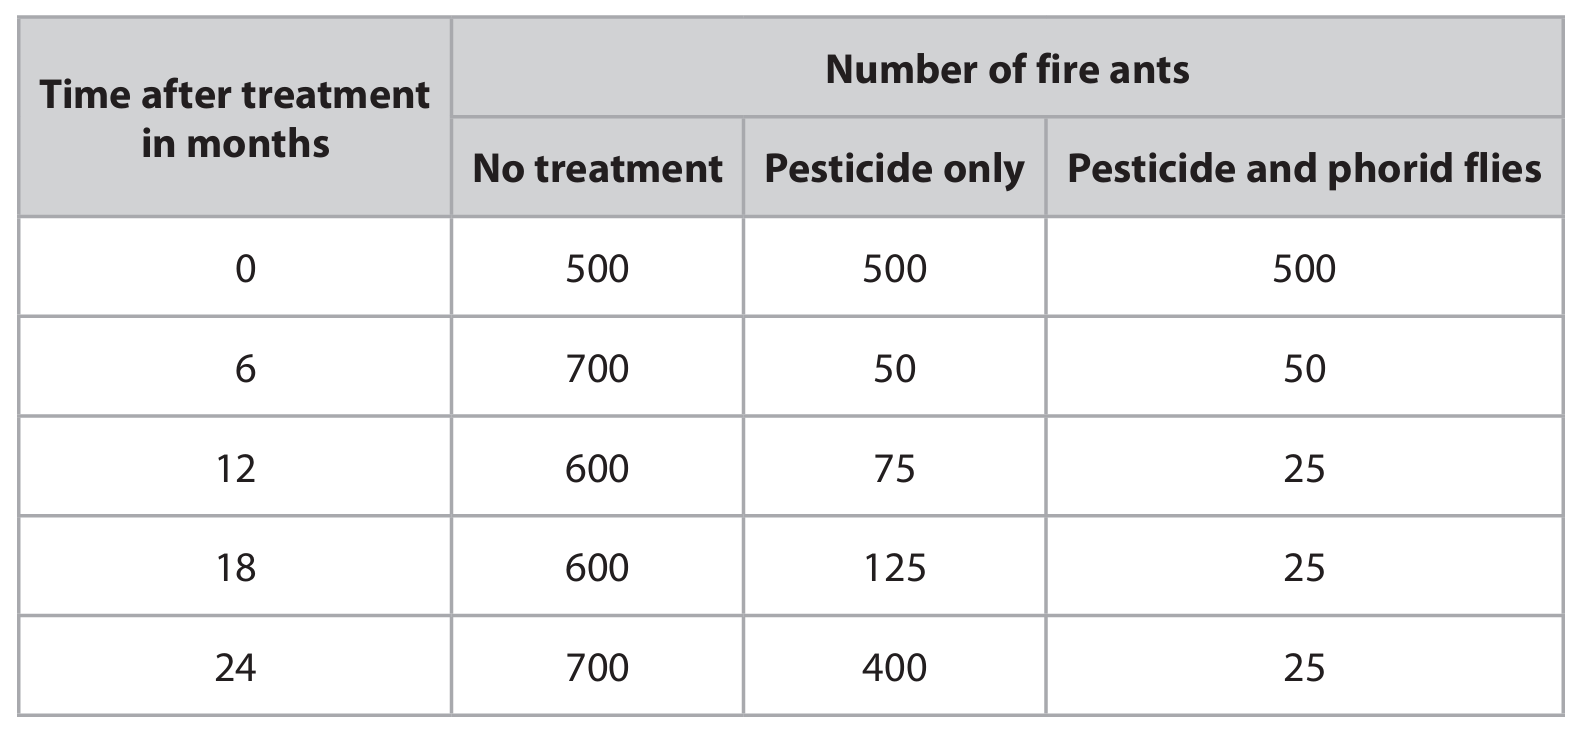
(a) It is a control (experiment) / to compare the results / check that change is due to the treatments.
Explanation: The glasshouse with no treatment serves as a control. This is a fundamental part of a scientific investigation. The control provides a baseline for comparison. It allows the scientists to see what happens to the fire ant population when no treatment is applied. By comparing the results from the treated glasshouses to this control, they can be confident that any changes observed (like a decrease in ant numbers) are actually due to the pesticide or the combination of pesticide and flies, and not just due to other factors that might affect the population over time.
(b)
Graph Description: A line graph should be drawn with the following features to score full marks:
- Axes: The x-axis should be labelled “Time after treatment (months)” and the y-axis should be labelled “Number of fire ants”. Both axes must have a linear scale that uses at least half of the grid provided.
- Data Points: Points should be plotted accurately for both data sets (Pesticide only and Pesticide + phorid flies) at the correct time intervals (0, 6, 12, 18, 24 months).
- Lines: The plotted points for each data set should be joined with straight lines.
- Key: The graph must include a key or the lines must be clearly labelled to identify which line represents “Pesticide only” and which represents “Pesticide and phorid flies”.
Explanation: The graph for “Pesticide only” would start at 500 ants at 0 months, drop sharply to 50 at 6 months, rise slightly to 75 at 12 months, continue rising to 125 at 18 months, and then rise sharply again to 400 at 24 months. The graph for “Pesticide and phorid flies” would also start at 500, drop to 50 at 6 months, but then drop further to 25 at 12 months and remain steady at 25 for both 18 and 24 months. This visual representation clearly shows the initial effectiveness of both treatments and the crucial long-term difference the biological control agent makes.
(c) The number of fire ants decreases (sharply at first) and then increases (again).
Explanation: Looking at the data for “Pesticide only”, we see a very effective initial result. The number of ants plummets from 500 to just 50 within the first 6 months. This shows the pesticide is highly effective at killing the ants upon application. However, after this initial success, the population begins to recover. It increases to 75 at 12 months, 125 at 18 months, and is nearly back to its original size at 400 by 24 months. This indicates that the effect of the pesticide is not lasting.
(d) Discussion points should include:
- Both treatments (pesticide alone and pesticide + flies) are initially very effective, drastically reducing the ant population within 6 months.
- The population recovers over time when only pesticide is used, reaching 400 ants by 24 months. This suggests the pesticide’s effect is temporary; it may wear off, wash away, or the ants may develop resistance to it through natural selection. Resistant ants survive and reproduce, passing on the resistance allele to their offspring.
- In contrast, when phorid flies (a biological control agent) are introduced alongside the pesticide, the ant population is not only reduced but is also maintained at a very low level (25 ants) from 12 months onwards.
- The phorid flies provide a sustainable, long-term control method. Unlike the chemical pesticide, the flies can reproduce and continue to prey on the fire ants, keeping their population in check. The population stabilizes at a low level where the death rate (due to predation by flies) equals the birth rate.
- This shows that integrating biological control (phorid flies) with chemical control (pesticide) is a much more effective long-term strategy for managing fire ant populations than using pesticides alone. The pesticide provides a quick “knock-down” of the population, and the biological control agent prevents it from recovering.
Explanation: The data clearly shows that while pesticides offer a powerful short-term solution, they often fail as a long-term strategy on their own due to factors like resistance development. Biological control, though it may work more slowly, acts as a persistent regulating force. The combination of both methods leverages the immediate impact of the pesticide with the sustained, self-replicating pressure of the biological control agent, resulting in a much more effective and durable pest management outcome. This is a key principle in integrated pest management (IPM).
▶️ Answer/Explanation
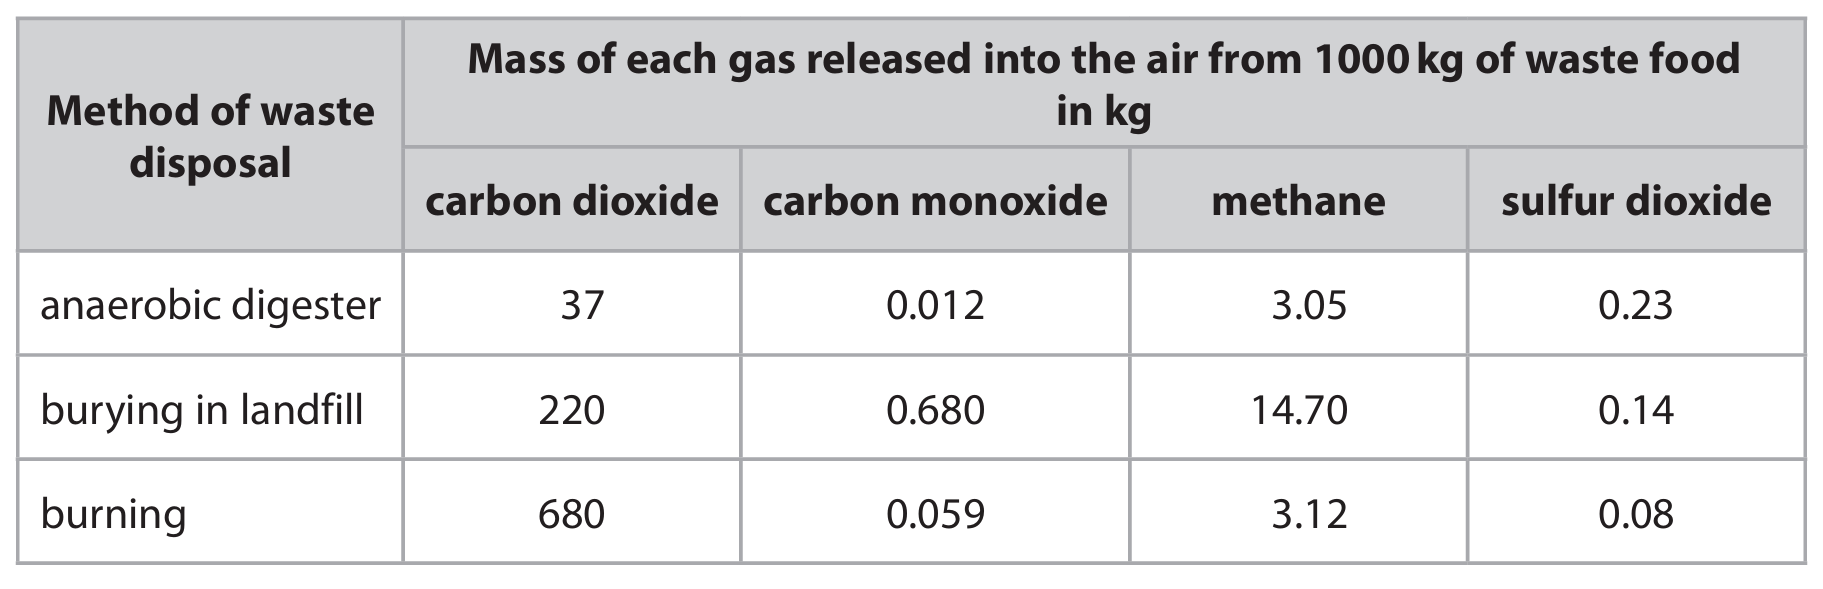
(a) 4.6 kg
Explanation:
The table shows that 37 kg of carbon dioxide is released from 1000 kg of waste food using an anaerobic digester. We need to find out how much is released from 125 kg.
First, find the amount of CO₂ released per kg of waste:
\[ \frac{37\, \text{kg}}{1000\, \text{kg}} = 0.037\, \text{kg of CO}_2 \text{ per kg of waste} \]
Now, multiply this by the mass of waste we are interested in (125 kg):
\[ 0.037\, \text{kg/kg} \times 125\, \text{kg} = 4.625\, \text{kg} \]
Finally, round this answer to two significant figures:
\[ 4.625\, \text{kg} \approx 4.6\, \text{kg} \]
So, the mass of carbon dioxide released is 4.6 kg.
(b)
Evaluation:
Arguments in favor (Agreement):
- The data shows that anaerobic digesters release significantly less carbon dioxide (37 kg) per 1000 kg of waste compared to burning (680 kg) and burying in landfill (220 kg). Carbon dioxide is a major greenhouse gas contributing to global warming.
- Anaerobic digesters also release less methane (3.05 kg) than landfills (14.70 kg). Methane is a much more potent greenhouse gas than CO₂ in the short term, so reducing its release is crucial for mitigating climate change.
- The amount of carbon monoxide (0.012 kg) released by digesters is much lower than from landfills (0.680 kg) and slightly lower than from burning (0.059 kg). Carbon monoxide is a toxic gas that can bind to haemoglobin in blood, reducing oxygen transport.
- By producing less of these gases, anaerobic digesters contribute less to the greenhouse effect, global warming, and associated problems like ice cap melting, habitat loss, extreme weather, and flooding.
- Furthermore, the process of anaerobic digestion produces biogas (a mixture of methane and carbon dioxide), which can be captured and used as a renewable energy source, adding to its environmental benefits.
Arguments against (Disagreement/Limitations):
- However, the table shows that anaerobic digesters release more sulfur dioxide (0.23 kg) than the other two methods (Landfill: 0.14 kg, Burning: 0.08 kg).
- Sulfur dioxide is a primary cause of acid rain. Acid rain can lead to deforestation, acidification of lakes and rivers (killing fish and other aquatic life), and damage to buildings and statues.
- Therefore, while anaerobic digesters are better in terms of greenhouse gas emissions, their higher sulfur dioxide output is a significant environmental drawback that must be considered and potentially mitigated.
Conclusion:
Based on the data provided, anaerobic digesters appear to be the most environmentally friendly method specifically regarding greenhouse gas emissions (CO₂, CH₄, CO), which are a major global concern. The claim is strongly supported by this data. However, the higher release of sulfur dioxide, which causes regional environmental problems like acid rain, means they are not unequivocally the best in every aspect. A full evaluation would require weighing the global impact of climate change against the more localized impact of acid rain. Technologies to capture or reduce sulfur dioxide emissions from digesters could make them even more environmentally friendly.


▶️ Answer/Explanation
(a)(i) A (beaver)
Explanation: Primary consumers are organisms that eat producers (plants). In this food web, grass and aspen trees are producers. The beaver eats these plants, making it a primary consumer. Coyotes and wolves are secondary or tertiary consumers as they eat other animals.
(a)(ii) An ecosystem refers to a community of living organisms (biotic factors) interacting with each other and their physical environment (abiotic factors).
Explanation: An ecosystem isn’t just about the organisms living in an area; it also includes all the non-living components like soil, water, air, and sunlight that they interact with. These interactions create a functional unit where energy flows and nutrients cycle.
(b) The extinction of wolves damaged the ecosystem because it disrupted the natural balance of predator-prey relationships.
Detailed Discussion: Wolves are apex predators that play a crucial role in regulating prey populations. When wolves were removed:
- The elk population likely increased dramatically since their main predator was gone.
- With more elk, there was increased grazing pressure on plants like aspen trees and grass.
- This overgrazing reduced plant populations, which in turn affected other species that depend on these plants for food and habitat.
- Beaver populations decreased because their food sources (trees) were reduced by elk overgrazing.
- With fewer beavers, there were fewer dams and wetland habitats that many species depend on.
- Mouse populations decreased due to reduced plant food sources and possibly increased predation from coyotes (who may have switched prey when wolves disappeared).
- Hawk populations decreased because their prey (mice) became less abundant.
This demonstrates how the removal of a keystone species like the wolf can cause cascading effects throughout an entire ecosystem.
(c)(i) Percentage change = 260%
Calculation:
Population in 1996 ≈ 50 wolves
Population in 2004 ≈ 180 wolves
Change = 180 – 50 = 130 wolves
Percentage change = (130 ÷ 50) × 100 = 260%
This shows the wolf population increased by 260% over this 8-year period following reintroduction.
(c)(ii) The wolf population likely changed between 2004 and 2012 due to factors like limited food availability, disease, competition, or habitat constraints.
Explanation: After the initial rapid growth, the population likely reached carrying capacity – the maximum number of wolves the ecosystem can support. Factors that may have caused fluctuations include:
- Prey populations (elk, etc.) decreasing due to predation pressure
- Disease outbreaks that spread through the wolf population
- Increased competition for territory and resources as the population grew
- Human activities like hunting or habitat disturbance
These factors typically cause predator populations to stabilize or fluctuate after an initial colonization period.
(c)(iii) The population size of a plant species could be determined using quadrat sampling.
Method Description:
- Place quadrats (square frames of known area) randomly throughout the study area
- Count the number of individuals of the target plant species within each quadrat
- Calculate the average number of plants per quadrat
- Multiply this average by the total number of quadrats that would fit in the entire study area to estimate the total population
- Repeat the process multiple times to improve accuracy
This method provides a reliable estimate of plant population size without having to count every individual plant across large areas.

▶️ Answer/Explanation
(a) A anther
Explanation: The anther is the male reproductive part of the flower where pollen grains are produced and stored. The ovary contains ovules, petals attract pollinators, and sepals protect the flower bud, but none of these structures contain pollen grains.
(b)(i)
Explanation: The style tissue provides essential nutrients and support for the growing pollen tube. It supplies glucose or sucrose through its tissues, which the pollen tube uses for respiration to produce ATP and energy needed for growth. Additionally, the style may provide amino acids for protein synthesis and water to maintain turgor pressure and enable cell elongation as the tube grows toward the ovary.
(b)(ii) 0.055 mm per minute
Explanation: To calculate the fastest rate of growth, we need to find the steepest slope on the graph. Looking at the time intervals:
From 0-60 minutes: (1.4 – 0)/60 = 0.023 mm/min
From 60-120 minutes: (4.7 – 1.4)/60 = 3.3/60 = 0.055 mm/min
From 120-180 minutes: (5.8 – 4.7)/60 = 1.1/60 = 0.018 mm/min
The fastest growth occurs between 60-120 minutes with a rate of 0.055 mm per minute.
(c)
Explanation: To design a proper investigation:
First, I would select two groups of apple trees of the same variety, age, and size to ensure fair comparison. One group would be treated with pesticide (experimental group) while the other would not receive any pesticide treatment (control group).
I would use multiple trees in each group (at least 5-10) to ensure reliable results and repeat the experiment over multiple growing seasons. All trees should be grown in the same soil type with identical fertilization, watering schedules, and exposure to sunlight and temperature conditions.
The independent variable would be the application of pesticide, while the dependent variables would be the yield measurements – specifically the number of apples produced and the total mass of apples harvested from each tree.
The investigation should run for the entire flowering and fruiting period. I would carefully count and weigh the apples from each tree at harvest time and compare the average yield between the pesticide-treated and untreated groups using statistical analysis to determine if there’s a significant difference.
This experimental design controls for other variables that might affect yield while specifically testing the effect of pesticides on apple production through insect pollination.
▶️ Answer/Explanation
(a)

Explanation:
Eutrophication is the process where water bodies become enriched with nutrients (like fertilisers), leading to excessive growth of algae and other aquatic plants. This depletes oxygen in the water, harming other aquatic life.
Insect pollination occurs when insects transfer pollen from the anther of one flower to the stigma of another, facilitating fertilization in plants.
Active transport is the movement of ions or molecules across a cell membrane from a region of lower concentration to a region of higher concentration, requiring energy in the form of ATP.
(b)(i)
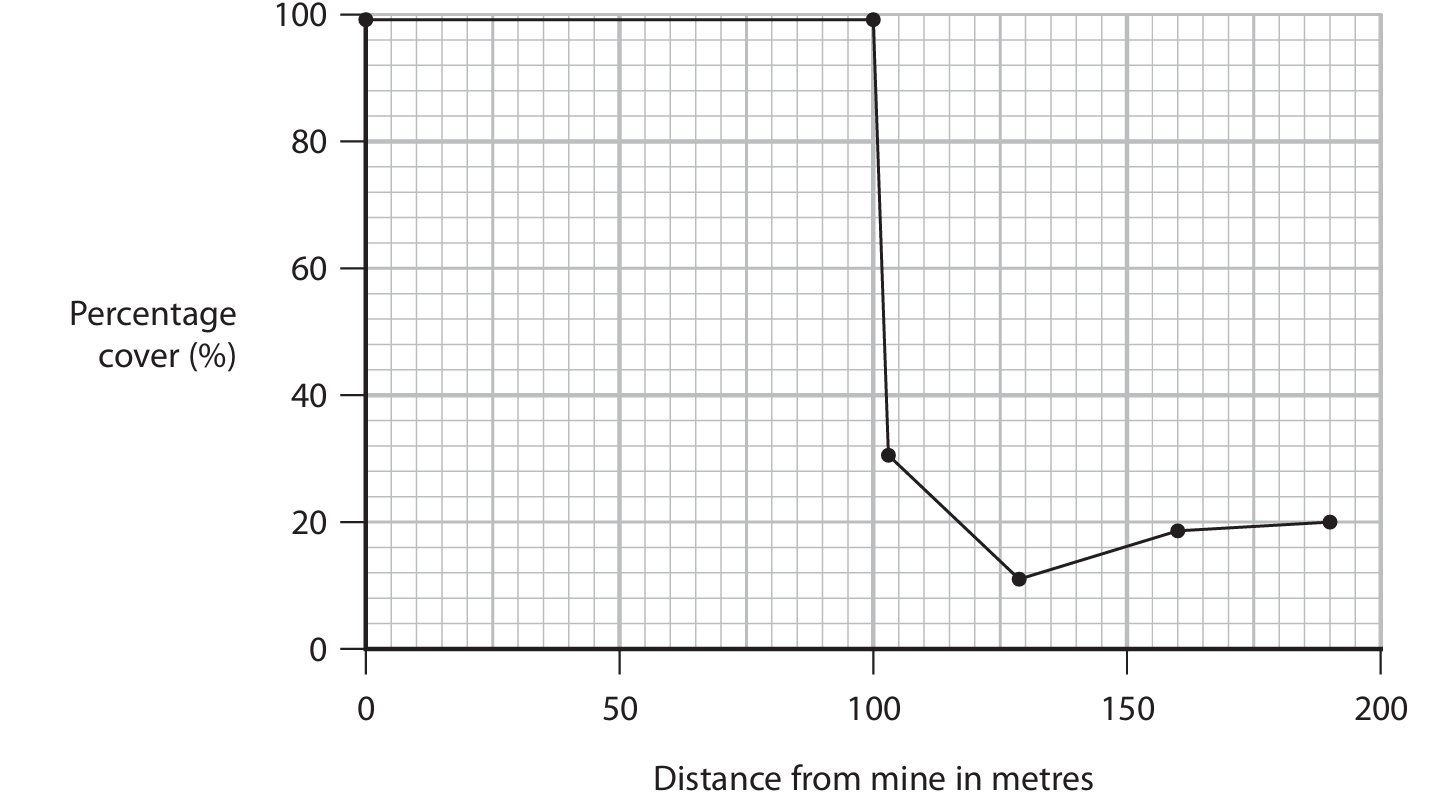
Explanation: Natural selection could explain the pattern seen in the graph between 0-100 meters from the mine through the following mechanism:
Initially, the high zinc concentration near the mine would be toxic to most individual grass plants. However, within the population, there might be genetic variation due to random mutations. A few individual grass plants might possess alleles that make them resistant to zinc toxicity. These resistant individuals would be more likely to survive and reproduce in the zinc-contaminated soil near the mine. They would pass these advantageous resistant alleles to their offspring. Over generations, the proportion of zinc-resistant grass plants in the population near the mine would increase. This results in a population that is better adapted to the high zinc levels, allowing the grass species to have a higher percentage cover closer to the mine (0-100m) than might be initially expected, as seen in the graph. The process involves variation, selection pressure (zinc), survival of the fittest (resistant plants), and inheritance of the resistant trait.
(b)(ii)
Explanation: To compare the population size of the grass species at 50m and 100m from the mine, the scientist could use a systematic sampling method like a belt transect or random quadrat sampling along a line.
First, a measuring tape would be laid out running perpendicular from the mine edge, passing through both the 50m and 100m points. For a belt transect, quadrats (e.g., 1m x 1m squares) would be placed contiguously along the tape between, for example, 45m-55m and 95m-105m to cover each area. Alternatively, for random sampling, multiple random coordinates within a 10m band centered on 50m and another band centered on 100m could be generated, and a quadrat placed at each coordinate.
Within each quadrat, the scientist would estimate the percentage cover of the specific grass species. This is a measure of how much of the ground within the quadrat is occupied by the vertical projection of its leaves and stems. This process would be repeated multiple times (e.g., 10-20 quadrats) at each distance to obtain a representative sample and calculate a mean percentage cover. The mean percentage cover at 50m can then be statistically compared to the mean percentage cover at 100m to determine if there is a significant difference in the population size of the grass species between the two distances.
▶️ Answer/Explanation
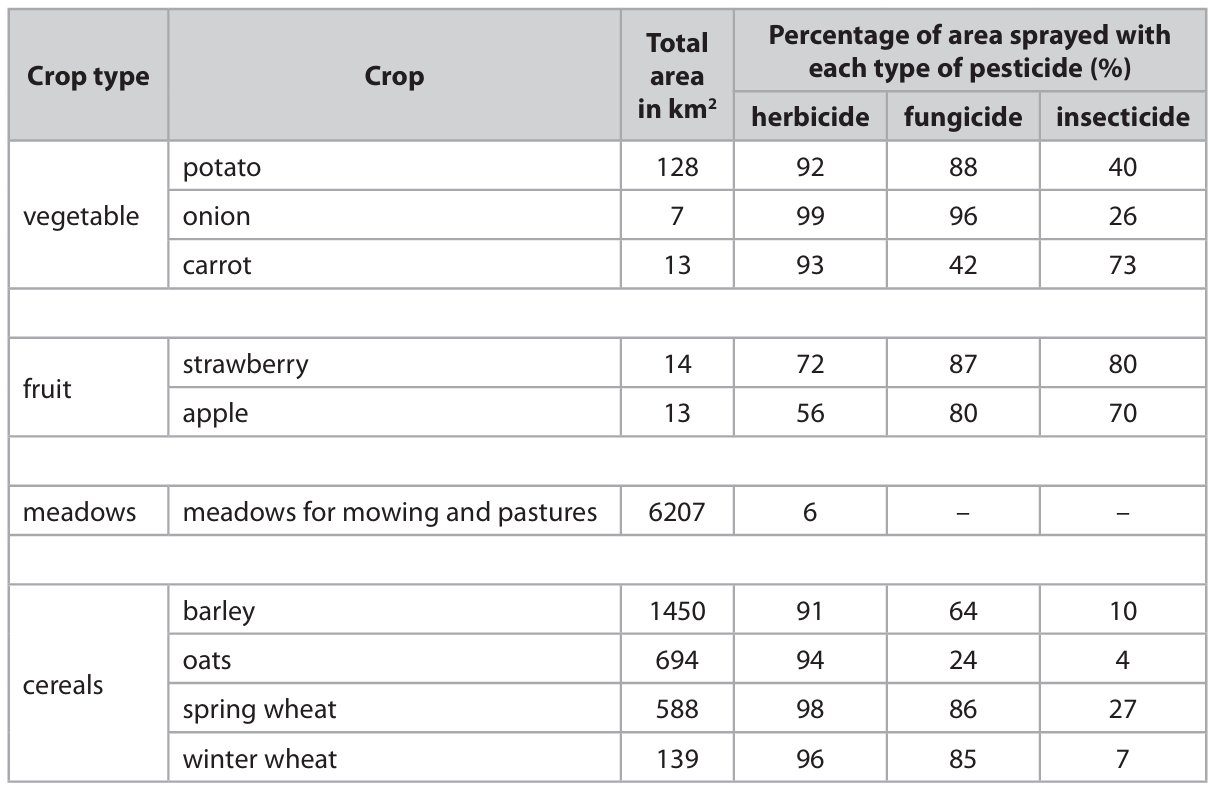
(a) A chemical/substance that kills/destroys pests (such as animals/plants/insects).
Explanation: A pesticide is a broad term for any chemical agent used to eliminate or control organisms considered pests. This includes herbicides for weeds, fungicides for fungi, and insecticides for insects. They work through various mechanisms to disrupt the pest’s life processes.
(b) Largest area = 1319.5 km² (accept 1320 or 1300), Crop = Barley
Explanation: To find the largest area sprayed with herbicide, we need to calculate the actual area sprayed for each crop by multiplying the total area by the percentage sprayed with herbicide (converted to a decimal).
Working for key crops:
- Barley: 1450 km² × 0.91 = 1319.5 km²
- Oats: 694 km² × 0.94 = 652.36 km²
- Spring Wheat: 588 km² × 0.98 = 576.24 km²
- Winter Wheat: 139 km² × 0.96 = 133.44 km²
- Potato: 128 km² × 0.92 = 117.76 km²
Barley has the largest calculated area sprayed with herbicide at 1319.5 km².
(c) In winter, colder temperatures mean fewer insects are active, so less insecticide is needed compared to spring when warmer weather leads to more insect activity.
Explanation: The different growing seasons directly impact pest populations. Winter wheat is cultivated during colder months when insect activity is minimal due to low temperatures and reduced food availability. Consequently, the need for insecticide application is lower (7% for winter wheat). In contrast, spring wheat grows during warmer periods, which favor insect reproduction and activity, necessitating a higher use of insecticides (27% for spring wheat) to protect the crop from potential damage.
(d) Fruit crops show a more balanced use of all three pesticide types (around 56-87%), while cereal crops use herbicides most heavily (91-98%) with more variable fungicide use and generally lower insecticide use.
Explanation: The pesticide application patterns reflect the different vulnerabilities of these crop types. Fruit crops (strawberry, apple) have relatively high and even usage across herbicide, fungicide, and insecticide. This is because fruits are often susceptible to insect damage, fungal rots (especially due to their high sugar content and moisture), and weed competition. Cereal crops (barley, oats, wheat), on the other hand, demonstrate a very high reliance on herbicides (91-98%). This is crucial during their early growth stages to eliminate weed competition for resources like light, water, and nutrients. Fungicide use in cereals is more variable (24-86%), possibly depending on specific disease risks for each cereal type. Insecticide use is generally lower in cereals (4-27%) compared to fruits, suggesting insects may be a lesser threat to these crops in this context, or that other control methods are prioritized.
(e) An alternative is biological control, which involves introducing a natural predator of the pest insect.
Explanation: Instead of using chemical insecticides, farmers can employ biological control. This method uses living organisms to manage pest populations. For example, ladybirds can be introduced to control aphids, or the parasitic wasp Encarsia formosa can be used against whitefly. This approach is often more targeted and can be more environmentally sustainable, reducing chemical residues and the risk of pests developing resistance. Other non-chemical alternatives include using physical barriers like nets to exclude insects from the plants.
▶️ Answer/Explanation
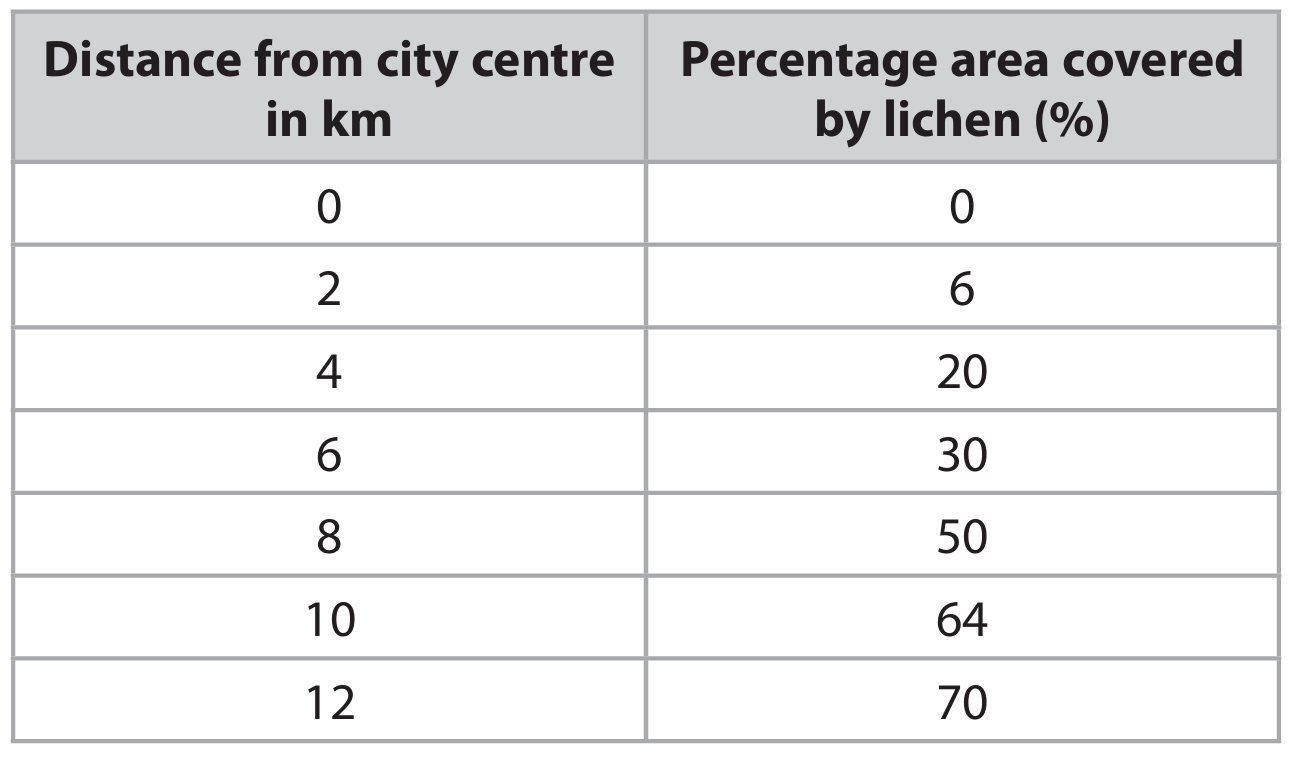
(a) An explanation that makes reference to two of the following points:
• As distance from the city centre increases, the percentage area covered by lichen increases.
• There are more cars/pollution/sulfur dioxide in the city centre, which inhibits lichen growth.
Allow converse statements (e.g., lichen coverage decreases closer to the city centre).
(b) An answer that makes reference to three of the following points:
• Measure the area covered by lichen. Allow using a grid/quadrat to count squares with lichen.
• Measure the total area of the stone wall.
• Divide the lichen-covered area by the total area and multiply by \(100\) to get the percentage.
• Repeat the measurements in different places on the wall to find a mean.
(c) An answer that makes reference to six of the following points:
• C (Change): Expose one set of germinating seeds to sulfur dioxide (\(SO_2\)) from sodium metabisulphite and another set to air without \(SO_2\) (or use different concentrations of \(SO_2\)).
• O (Organisms): Use the same species/type/age/variety of seeds.
• R (Repeat): Use a large number of seeds/repeat the experiment.
• M1 (Measurement 1): Measure the temperature change.
• M2 (Measurement 2): Use a thermometer.
• S1 (Same 1): Use a thermos flask (or insulated container) to contain the seeds and prevent heat loss.
• S2 (Same 2): Control other variables (e.g., same moisture, oxygen, starting temperature, light, time, disinfect seeds).
Answer must be in full sentences and include experimental details to access the marks.

▶️ Answer/Explanation
(a) An explanation that makes reference to four of the following points:
- nitrates (for growth)
- for amino acids
- for protein
- magnesium for chlorophyll / chloroplasts
- so more photosynthesis
- more glucose
- phosphates used for ATP / DNA / eq
- potassium for control of water movement / eq
(b) An answer that makes reference to four of the following points:
- fertiliser leaches into river / washed into river / eq
- fertiliser would cause algal / plant growth / algal bloom / eutrophication
- dead algae are decomposed / broken down by bacteria / decomposers
- (bacterial) respiration would reduce oxygen
- means were calculated / readings repeated so experiment is reliable / valid
- measurements taken at same time of year / in April (so are valid)
- direction of river is past farm
- reduced oxygen could be due to other factors / sources of fertiliser from other fields
(c) • manure / faeces / dung / compost / seaweed / bone / blood / animal wastes / eq

Most-appropriate topic codes (Edexcel IGCSE Biology):
• 5(d): Human influences on the environment — part (d)
• Appendix 3: Mathematical skills — part (b)
• Appendix 5: Suggested practical investigations — part (c)
▶️ Answer/Explanation
(a)(i) C primary consumer
Explanation: Krill feed directly on microscopic plants, which are the producers in this food chain. Organisms that eat producers are called primary consumers. Predators (A) hunt other animals, prey (B) are hunted by others, and secondary consumers (D) eat primary consumers, which would be the whale in this chain, not the krill.
(a)(ii)
Explanation: A pyramid of biomass represents the total mass of living material at each trophic level. Producers (microscopic plants) have the greatest biomass, forming the base. Primary consumers (krill) have less biomass, and secondary consumers (whales) have the least biomass, forming the top. The pyramid should be upright with labels in the correct order.
(b) Time taken = 104 minutes (approximately)
Explanation: First, we need to convert the area from square meters to square centimeters because the feeding rate is given in cm²/s. One square meter equals 10,000 cm². If krill remove plants at 1.6 cm² per second, the time to clear 10,000 cm² is 10,000 ÷ 1.6 = 6,250 seconds. To convert seconds to minutes, we divide by 60: 6,250 ÷ 60 ≈ 104.17 minutes. Giving the answer as 104 minutes is appropriate, considering significant figures.
(c)
Explanation: To investigate this in a lab, the student would need to set up a controlled environment. They could use a large container filled with seawater. They would add a known, measurable quantity of microscopic plants – this could be done by counting them under a microscope or measuring their mass or the area they cover. Then, they would introduce a specific number of krill into the container. The container would be left for a set period of time. After this time, the student would re-measure the number or mass of the remaining microscopic plants. The difference between the starting and ending amounts shows how much was consumed. To ensure reliability, this experiment should be repeated several times to calculate a mean rate of consumption.
(d)
Explanation: Global warming leads to rising temperatures, which causes polar ice to melt. Since the microscopic plants that krill primarily eat grow on the underside of this ice, melting ice directly reduces their habitat. With less surface area for the plants to grow on, the population of these microscopic plants will decline. Krill rely on this food source, so a reduction in plants leads to a reduction in the krill population, either through starvation, lower reproduction rates, or migration. Whales, being at the top of this food chain, depend entirely on consuming large quantities of krill. Therefore, a significant drop in the krill population would mean less food is available for the whales. This could lead to a decline in the whale population, as whales might starve, die from malnutrition, or be forced to migrate to other areas in search of food, reducing their numbers in the Antarctic ocean.
▶️ Answer/Explanation
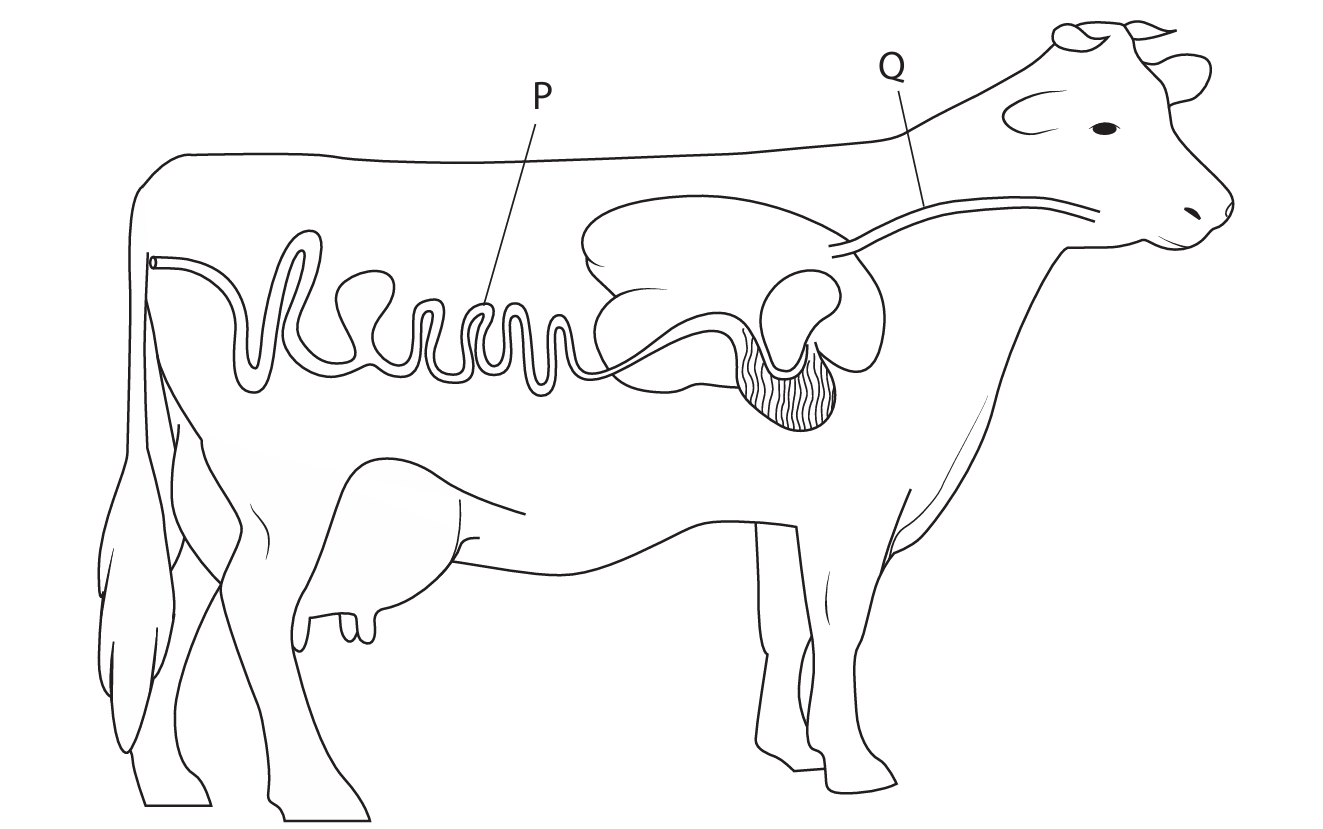
(a)
P: Ileum / Small Intestine
Q: Rumen
Explanation: In the digestive system of a cow, which is a ruminant, part P is the ileum, which is the final section of the small intestine where further digestion and absorption of nutrients occur. Part Q is the rumen, the first and largest chamber of the stomach, where microbial fermentation of plant material takes place.
(b)
Explanation: The microorganisms in the cow’s stomach, particularly in the rumen, are essential because they produce enzymes like cellulase that break down cellulose, a major component of plant cell walls. Cows, like other mammals, cannot produce cellulase on their own. By digesting cellulose, these microbes release glucose and other simpler sugars that the cow can then absorb and use for energy through respiration. This symbiotic relationship allows the cow to efficiently utilize grass and other fibrous plant materials as its primary food source.
(c)
Explanation: The scientist’s claim has both supporting and opposing points. On one hand, using GH to increase milk yield per cow could mean that farmers need to keep fewer cows to produce the same amount of milk. Since cows are a significant source of methane (a potent greenhouse gas) released during digestion, having fewer cows could lead to less methane being released into the atmosphere. This could potentially reduce the greenhouse effect and slow down global warming.
However, there are limitations to this claim. Farmers might choose to keep the same number of cows to produce even more milk, negating any potential environmental benefit. Furthermore, cows are also kept for beef production, not just milk, so the overall number of cows might not decrease significantly. Finally, climate change is driven by many factors, including other greenhouse gases from sources like fossil fuels, so the impact of reducing methane from cows alone might be limited without addressing other major contributors.

▶️ Answer/Explanation
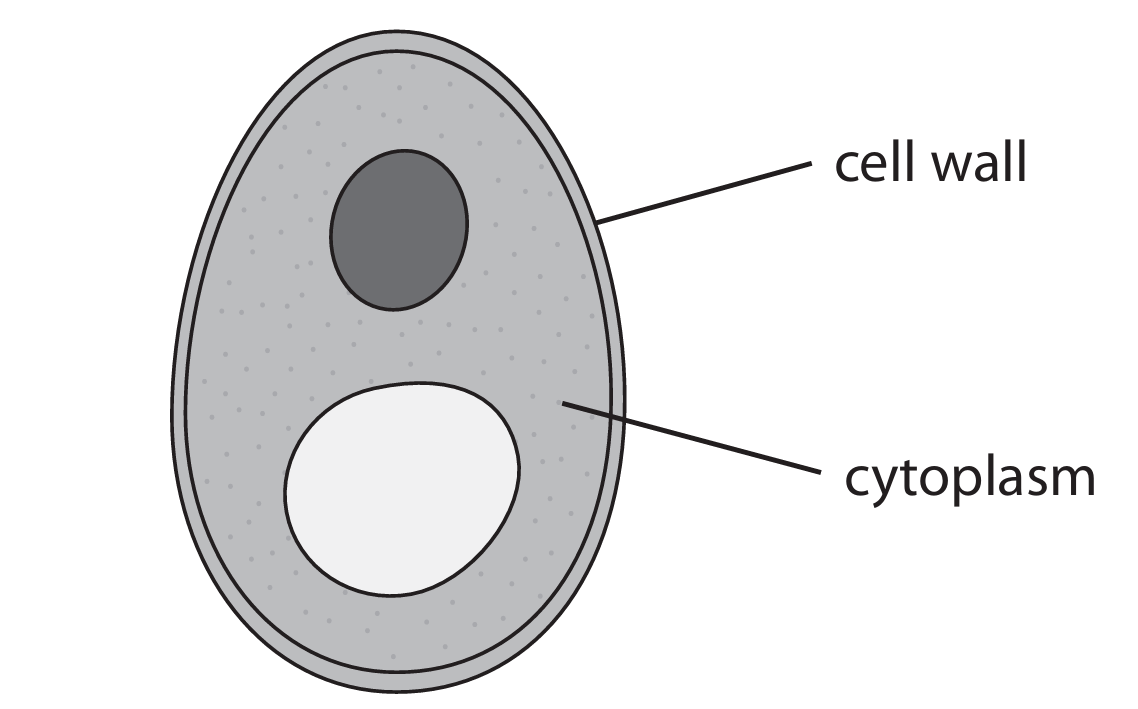
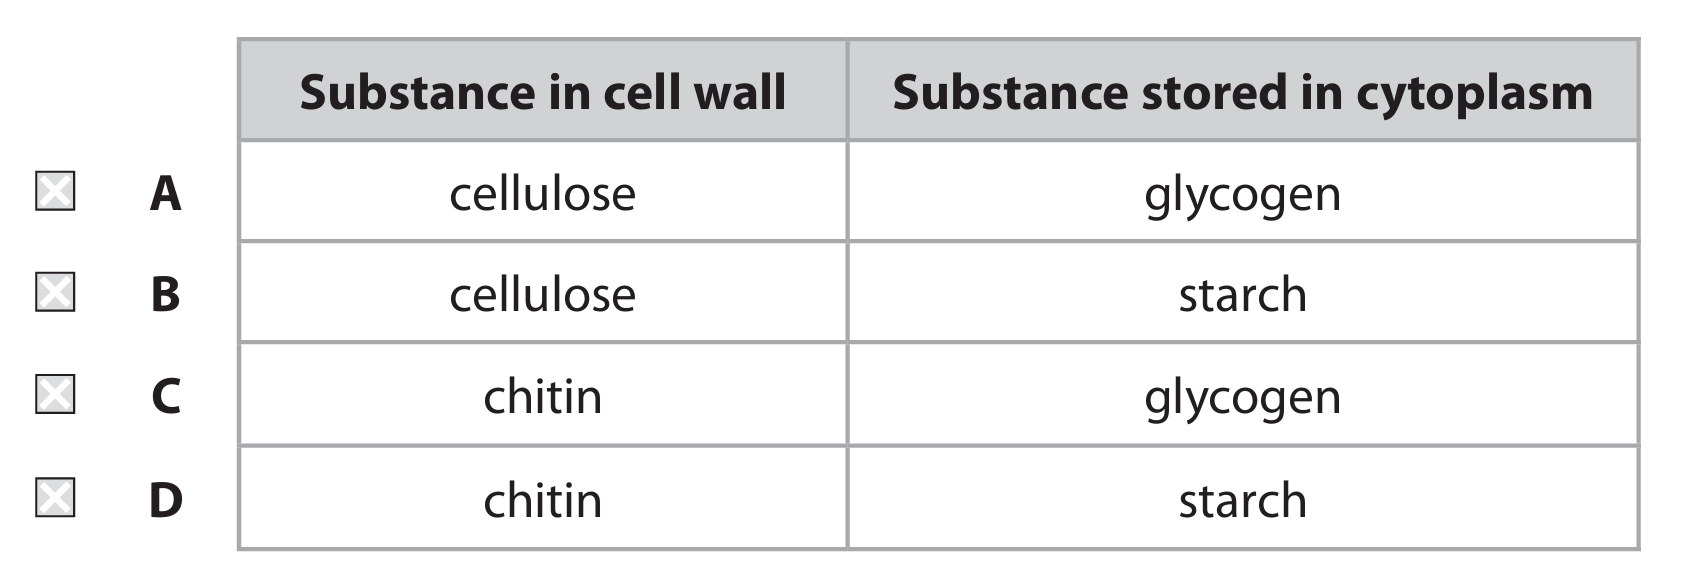
(a)(i) C (chitin and glycogen)
Explanation: Yeast is a fungus, and fungal cell walls are primarily composed of chitin, not cellulose which is found in plants. For energy storage, fungi like yeast store glycogen in their cytoplasm, similar to animals, rather than starch which is typical of plants.
(a)(ii) B (a fungus)
Explanation: Yeast is classified as a unicellular fungus. It is not a bacterium (which are prokaryotic), a plant (which are multicellular and photosynthetic), or a protoctist (which is a diverse group including algae and protozoa).
(b)(i) B (glucose → ethanol + carbon dioxide)
Explanation: The respiration described is anaerobic respiration (fermentation) in yeast. The correct chemical equation for this process is glucose being broken down into ethanol and carbon dioxide, without the use of oxygen. Option A is incomplete, and options C and D involve oxygen, which characterizes aerobic respiration.
(b)(ii) Restriction enzyme / endonuclease / ligase
Explanation: To genetically modify the yeast, scientists use enzymes like restriction endonucleases (which cut DNA at specific sequences) and DNA ligase (which joins DNA fragments together). These enzymes are essential tools in genetic engineering for inserting new genes into an organism’s genome.
(b)(iii) Contains new / foreign DNA / gene from another organism.
Explanation: A recombinant organism is one that has had its genetic material altered by the insertion of DNA from a different source. In this case, the GM yeast has been modified to contain a gene from another organism that codes for an enzyme capable of digesting plant cell walls.
(b)(iv)
Explanation: Biofuel from plants can help reduce global warming primarily because it is part of a carbon-neutral cycle. The carbon dioxide released when the biofuel is burned is approximately equal to the carbon dioxide that the plants absorbed from the atmosphere during photosynthesis. This contrasts with burning fossil fuels, which releases carbon that has been locked away for millions of years, thereby increasing the net concentration of CO₂ in the atmosphere. Additionally, using biofuels can reduce our dependence on fossil fuels, leading to lower overall emissions of greenhouse gases.
(c)(i) 76% (accept range 69-80%)
Explanation: To calculate the percentage increase, we use the formula: \[ \text{Percentage Increase} = \frac{\text{Mass from GM yeast} – \text{Mass from normal yeast}}{\text{Mass from normal yeast}} \times 100\% \] From the graph, after 1 day, the mass from GM yeast is approximately 2.2 g and from normal yeast is approximately 1.25 g. \[ \text{Increase} = 2.2 – 1.25 = 0.95 \text{ g} \] \[ \text{Percentage Increase} = \frac{0.95}{1.25} \times 100\% = 76\% \] Slight variations in reading the graph values can lead to answers between 69% and 80% being accepted.
(c)(ii)
Explanation: The rate of ethanol production decreases after 1 day likely due to two main factors. First, the glucose (substrate) that the yeast uses for respiration begins to run out or become depleted, slowing down the metabolic process. Second, the ethanol produced is actually toxic to the yeast in high concentrations. As ethanol builds up in the surrounding environment, it can inhibit the yeast’s enzymes and eventually kill the cells, leading to a decline in the production rate.