▶️ Answer/Explanation
(a) An answer that makes reference to one of the following:
- only has an effect if two alleles are present (1)
- no effect if dominant allele is present (1)
- only has effect if dominant allele not present (1)
- no effect in heterozygous (1)
- only has an effect when homozygous / eq (1)
(b)(i) C (tt and Tt)
A is incorrect as both would be tasters
B is incorrect as both would be tasters
D is incorrect as neither would be tasters
(b)(ii) An explanation that makes reference to the following:
- correct parental genotypes (Tt and Tt) (1)
- correct gametes (T or t and T or t) (1)
- offspring: TT, Tt, Tt, tt (1)
- 0.375 / 3/8 / 37.5 (%) (1)
Genetic diagram:
Parents: Tt × Tt
Gametes: T, t and T, t
Offspring:
| T | t | |
| T | TT | Tt |
| t | Tt | tt |
Probability of heterozygous (Tt) = 2/4 = 0.5 or 50%
(c)(i) An explanation that makes reference to four of the following:
- mutation occurs (1)
- variation (in population) (1)
- people do not eat poisonous plants / can detect poisonous plants / eq (1)
- survive / eq (1)
- reproduce / produced offspring / breed / eq (1)
- pass on allele (to offspring) / eq (1)
(c)(ii) An answer that makes reference to two of the following:
- people who taste PTC eat fewer vegetables / do not like taste of vegetables / eq (1)
- (PTC tasters) get fewer vitamins / fewer minerals / less fibre / eq (1)
- (PTC tasters) may develop scurvy / night blindness / constipation / eq (1)
- heterozygotes carry a recessive allele / tasters may carry a non-tasting allele / heterozygotes can pass on a recessive allele / eq (1)
- some humans lived in areas with few poisonous plants / had diets with fewer plants / had mainly meat-based diets / eq (1)
▶️ Answer/Explanation
(a) An explanation that makes reference to two of the following points:
- Short life span / short generation time / short life cycle / reproduce quickly (1)
- Can get many repeats / many generations / can get expected / predicted ratios / quick/reliable/valid results (1)
- Have a range of visible characteristics / traits / phenotypes (1)
- That are inherited / controlled by genes (1)
(b)(i) An answer that makes reference to:
- (Parent genotypes) Ll and Ll (1)
- (Offspring genotypes) LL, Ll, ll (1)
- (Offspring phenotypes) Long and short (1)
- (Phenotype ratio) 3 long : 1 short (1)
Example genetic diagram:
Parents: Ll (long) × Ll (long)
Gametes: L, l × L, l
Offspring: LL, Ll, Ll, ll
Phenotype ratio: 3 long : 1 short
(b)(ii)
- Probability of being male = \(0.5\) (or \(\frac{1}{2}\)) (1)
- Probability of having long wings (from monohybrid cross) = \(0.75\) (or \(\frac{3}{4}\)) (1)
- Combined probability = \(0.5 \times 0.75 = 0.375\) (or \(37.5\%\), \(\frac{3}{8}\)) (1 for correct calculation, award 2 marks total)
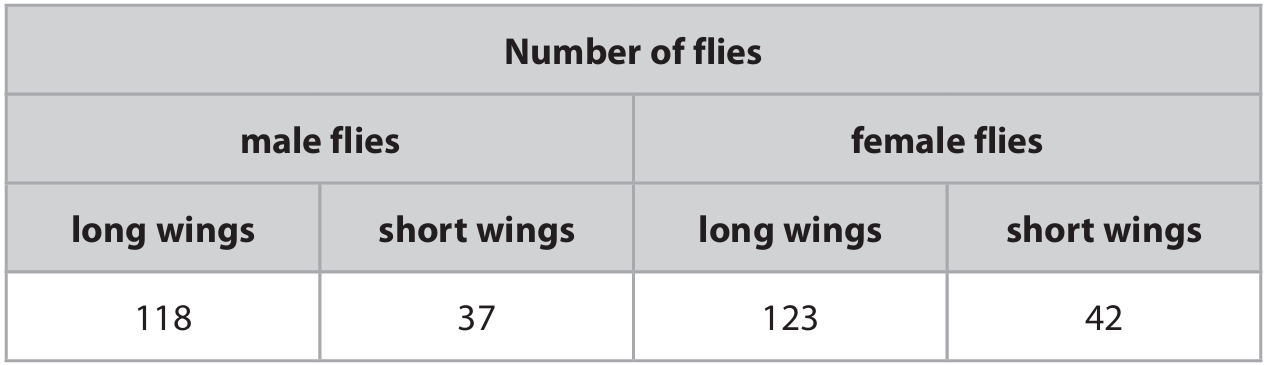
(b)(iii) An answer that makes reference to four of the following points (using processed data, not raw numbers):
Male to female:
- Observed: males = 155, females = 165 (or 48% male, 52% female) (1)
- Expected: 1:1 ratio / 50% each / equal numbers (1)
- Comparison: almost identical / little difference / slightly fewer males / slightly more females (1)
Long to short wings (overall):
- Observed: long = 241, short = 79 (or 75% long, 25% short) (1)
- Expected: 3:1 ratio / 75% long, 25% short (1)
- Comparison: (almost) 3:1 / little difference (1)
Long/short by sex:
- Slight difference between male and female ratios: Males ≈ 3.2:1 (76% long), Females ≈ 2.9:1 (75% long) (1)
- Slightly more long-winged males than expected / slightly fewer long-winged females than expected (1)
(c) An explanation that makes reference to three of the following points:
- Short-winged files cannot fly / feed / mate / move as well / escape predators (1)
- Therefore, they do not survive / die out / are less likely to reproduce (1)
- So, the short-wing allele is not passed on to the next generation / is selected against (1)
- This is due to natural selection / selective disadvantage (1)

▶️ Answer/Explanation
(a)(i) An explanation that makes reference to four of the following points (marked in pairs):
- Artery wall has a thick layer of elastic tissue / more elastic (1) as blood pressure is higher / for the wall to recoil / to expand / to smooth blood flow (1).
- Artery wall has a thick layer of muscle / more muscle (1) to control blood flow (1).
- Artery has no valves (1) as blood pressure is sufficient to prevent backflow (1).
Accept converse statements for veins. Credit thick wall due to high pressure (two marks) if other points are not given.
(a)(ii) An explanation that makes reference to three of the following points:
- The artery in CHD has a blockage / is narrower / has a narrower lumen (1).
- Less blood / less oxygen can flow to the heart muscle (1).
- This leads to less aerobic respiration / more anaerobic respiration (1).
- Less energy / less ATP is produced (1).
- Therefore, the heart is unable to beat faster / contract as effectively during exercise (1).
(b)(i) An answer that makes reference to one of the following:
- High cholesterol / high-fat diet (1)
- Lack of exercise (1)
- Stress (1)
- High salt diet (1)
- High BMI / obesity (1)
- Diabetes (1)
- Age (1)
- Sex (1)
- High blood pressure (1)
Ignore “diet”, “bad diet”, “unbalanced diet” without specific link.
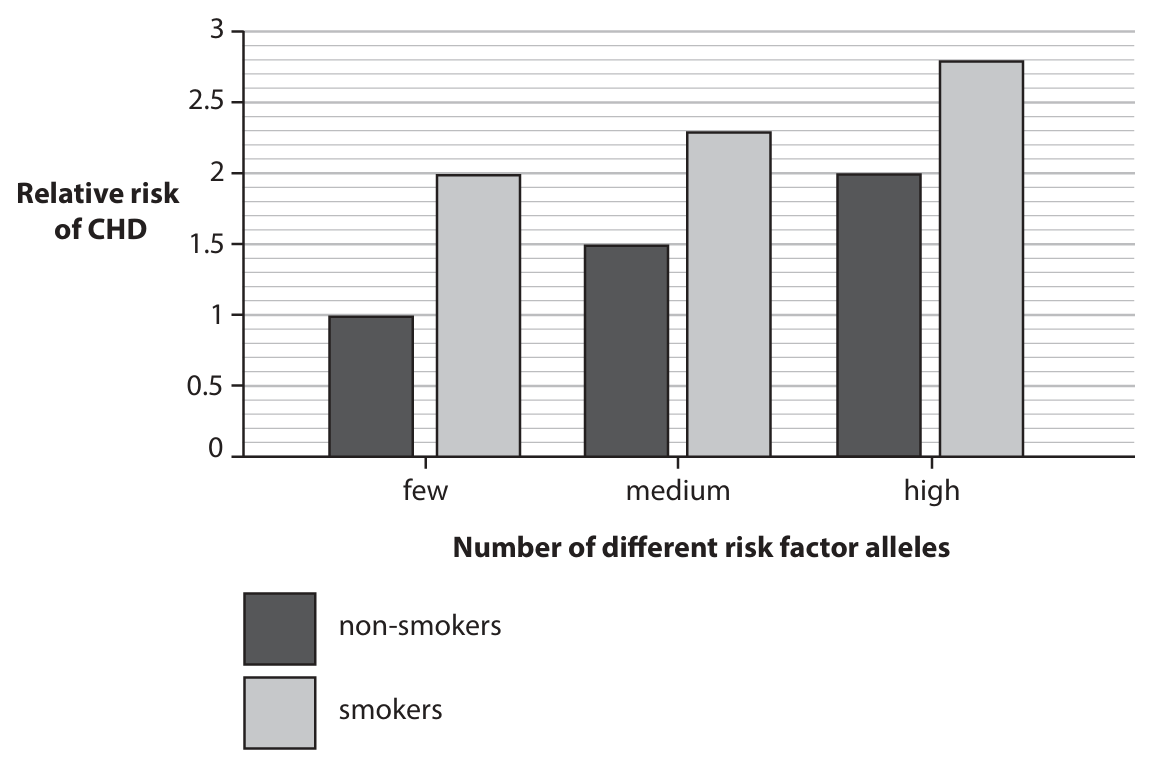
(b)(ii) An answer that makes reference to five of the following points:
- Smoking increases the risk of CHD for all allele groups (1).
- Having more risk factor alleles increases the risk of CHD (1).
- The highest risk is for smokers with a high number of alleles / The lowest risk is for non-smokers with few alleles (1).
- The biggest increase in risk from smoking is seen in those with few risk alleles / The increase from smoking is lower for the medium or high allele groups (1).
- Smokers with few alleles have a similar risk to non-smokers with many alleles (1).
- Credit use of data, e.g., smoking increases risk by approximately 1 for the low allele group (1).
- Carbon monoxide in cigarette smoke contributes to CHD (1).
- Smoking causes plaque / cholesterol build-up / blocks the coronary artery (1).
- Limitation: group size / sample size may be small (1).
- Limitation: other factors like age, sex, diet, frequency of smoking were not considered (1).
Accept: The increase in risk from smoking is similar for medium and high allele groups.

▶️ Answer/Explanation
(a)(i)
An answer that makes reference to the following points:
- Correct genotypes of parents (Dd, dd) (1)
- Correct gametes (D or d, d) (1)
- Correct genotypes of offspring (Dd, dd) (1)
- Correct probability of \( 0.5 \) / 50% / \( \frac{1}{2} \) (1)
Example genetic diagram:
Parents: Dd (Individual 4) × dd (Individual 5)
Gametes: D, d from parent 4; d, d from parent 5
Offspring genotypes: Dd, Dd, dd, dd
Probability of lactose intolerant child (dd) = \( \frac{2}{4} = \frac{1}{2} \) (50%)
(a)(ii)
An answer that makes reference to two of the following:
- Less water absorbed (into blood) (1)
- By colon / intestine (1)
- As sugar / lactose is not absorbed (1)
- (As lactose) affects osmosis / lowers water potential (1)
- (Lactose could cause) bacteria to grow / bacteria break down lactose (1)
(a)(iii)
An explanation that makes reference to four of the following points:
- Mutation (occurred) (1)
- Creating (genetic) variation (1)
- People with lactose tolerance (DD or Dd) can drink milk / did not get diarrhoea / can gain extra nutrients / were able to compete better / survived / had a selective advantage (1)
- Reproduced (more) / produced offspring (1)
- Pass on allele / gene / mutation (1)
(b)(i)
An explanation that makes reference to the following points:
- Mixes the contents / spreads nutrients / maintains even consistency / prevents settling (1)
- Maintains even temperature / prevents hot spots / maintains an even pH (1)
(b)(ii)
An explanation that makes reference to two of the following:
- Removes heat / cools the fermenter (1)
- To maintain optimal temperature (1)
- Prevents enzymes denaturing / prevents death of bacteria (1)

▶️ Answer/Explanation
(a)(i) B (Q)
A is not the answer as P is not the style
C is not the answer as S is not the style
D is not the answer as T is not the style
(a)(ii) D (U)
A is not the answer as P does not release pollen
B is not the answer as R does not release pollen
C is not the answer as T does not release pollen
(a)(iii) A (P)
B is not correct as pollen grains do not germinate on R
C is not correct as pollen grains do not germinate on S
D is not correct as pollen grains do not germinate on U
(b) A description that makes reference to the following:
• P feathery / large surface area / outside flower / exposed / eq (1)
• R absent / smaller / not coloured / green / eq (1)
• T longer / hinged / outside flower / exposed / eq (1)
(c)(i) • runners / bulbs / corms / tubers / rhizomes / eq (1)
(c)(ii) • cuttings / grafting / layering / tissue culture / micropropagation / eq (1)
Note: Reject ‘cloning’.
(d) An answer that makes reference to the following:
Allow two / three in one numbered line
• no gametes produced in asexual / no meiosis in asexual / gametes produced in sexual / meiosis in sexual / one parent cell (1)
• no fusion or fertilisation in asexual / present in sexual (1)
• offspring are clones / show no genetic variation in asexual / genetic variation in sexual / eq (1)
• asexual faster / shorter time / sexual slower / longer time / eq (1)
Note: Only mitosis in asexual. Ignore reference to number of parents. ‘Sexual involves fusion of gametes’ scores marking point 1 and marking point 2.
(e) An explanation makes reference to three of the following:
• selective breeding / artificial selection (1)
• cross red (flower) / unscented (flower) with white (flower) / scented (flower) / eq (1)
• select / breed / offspring with red and scent / eq (1)
• repeat / for many generations eq (1)
Note: Ignore reference to GM as it is the farmer. ‘Cross varieties / the plants’ is acceptable. Ignore ‘desired characteristics’ alone.
▶️ Answer/Explanation
(a) An allele that is only expressed in the homozygote / only shown in phenotype if two copies are present / not expressed in the heterozygote / not expressed if a dominant allele is present. (1 mark)
(b)(i)
A: Ff (heterozygous) (1)
B: Ff (heterozygous) (1)
C: ff (homozygous recessive) (1)
(Total 3 marks)
(b)(ii) A genetic diagram showing:
• Parental genotypes: Ff and Ff (1)
• Gametes: F and f from each parent (1)
• Offspring genotypes and phenotypes: FF (unaffected), Ff (unaffected), Ff (unaffected), ff (affected) OR correct phenotype ratio (1)
(Total 3 marks)
(c)(i) An explanation that refers to three of the following:
• Pancreas produces/releases amylase/proteases/lipases. (1)
• No/less digestion of starch to maltose. (1)
• No/less digestion of proteins to amino acids. (1)
• No/less digestion of lipids to fatty acids and glycerol. (1)
• Less absorption of smaller/soluble molecules (e.g., amino acids, glucose, fatty acids). (1)
(Total 3 marks)
(c)(ii) An explanation that refers to two of the following:
• Reduces likelihood of pregnancy / less likely to conceive. (1)
• Sperm/semen cannot enter the fallopian tube/oviduct. (1)
• Fertilisation less likely / no fusion of gametes. (1)
(Total 2 marks)
▶️ Answer/Explanation
(a) An allele is an alternative form / version of a gene.
(b)(i) From crosses 1 and 2, short hair is dominant over long hair (all offspring are short-haired). Let S = short hair (dominant) and s = long hair (recessive).
Parents in Cross 3 are both short-haired offspring from heterozygous parents, so both are heterozygous (Ss).
Genetic diagram:
Parents: Ss (male) × Ss (female)
Gametes: S, s S, s
Punnett Square:
| S | s | |
| S | SS | Ss |
| s | Ss | ss |
Offspring genotypes: SS, Ss, Ss, ss
Offspring phenotypes: 3 short-haired : 1 long-haired
(b)(ii)
Probability of being male = \( \frac{1}{2} \)
Probability of short hair = \( \frac{3}{4} \) (from Punnett square)
Combined probability = \( \frac{1}{2} \times \frac{3}{4} = \frac{3}{8} = 0.375 \) (or 37.5%)
(b)(iii)
To determine if a short-haired guinea pig is homozygous (SS) or heterozygous (Ss), cross it with a long-haired (homozygous recessive, ss) guinea pig.
• If all offspring are short-haired → parent is likely homozygous (SS).
• If some offspring are long-haired (≈50%) → parent is heterozygous (Ss).
This is a test cross.
(c)
An explanation that makes reference to the following points:
• Mutation/variation in behaviour existed in the population.
• Guinea pigs that remained still when sensing danger were less likely to be seen/eaten by predators.
• These individuals survived and reproduced, passing on the alleles for this behaviour to their offspring.
• Over many generations, the behaviour became more common in the population through natural selection.
▶️ Answer/Explanation
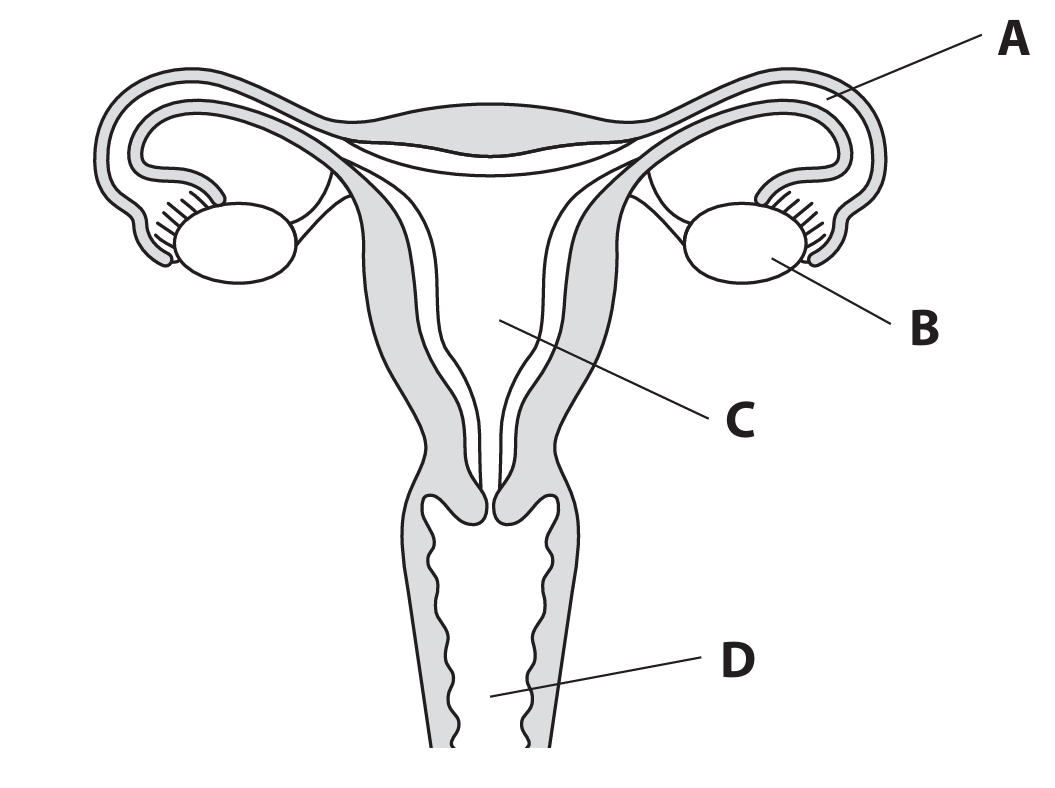
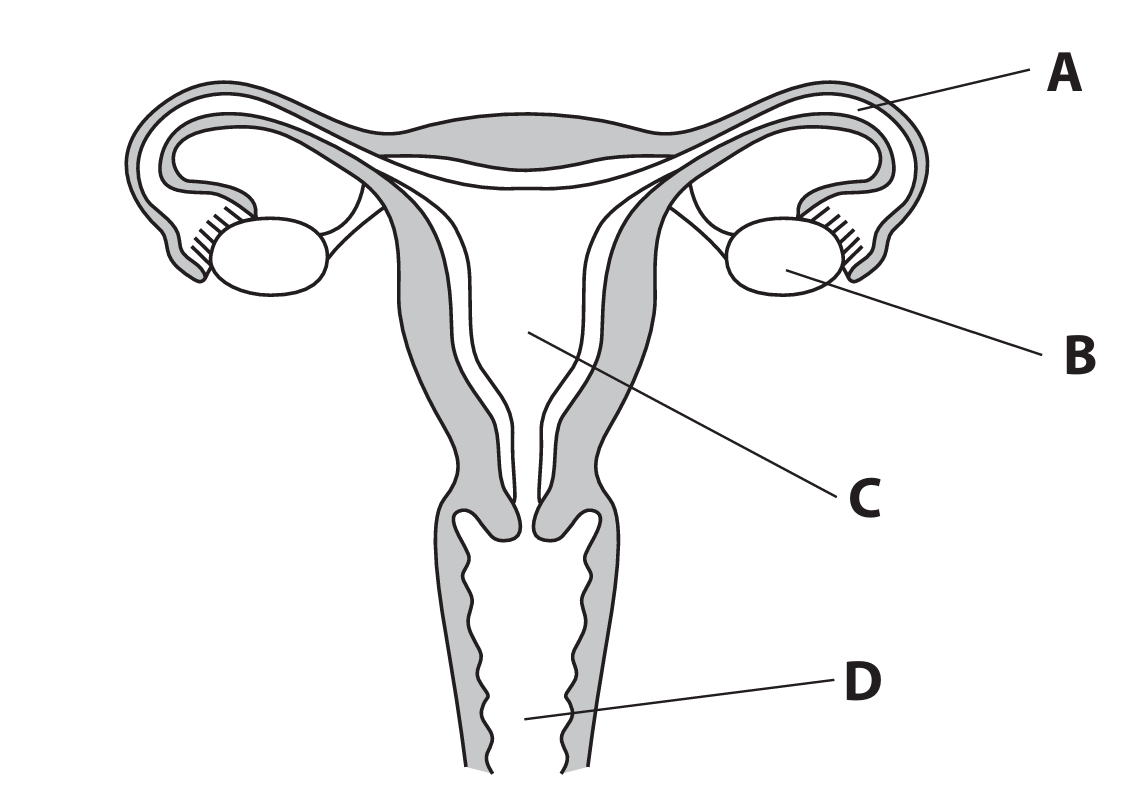
(a)(i) A
Explanation: Fertilisation, the fusion of a sperm cell nucleus with an egg cell nucleus to form a zygote, normally occurs in the oviduct, also known as the Fallopian tube. This is the structure labelled A in the diagram. The ovary (B) is where eggs are produced and released, the uterus (C) is where the embryo implants and develops, and the vagina (D) is the birth canal.
(a)(ii) Oestrogen: Repairs / thickens the lining. Progesterone: Maintains / retains the lining.
Explanation: Oestrogen, produced by the developing follicles in the ovary, causes the repair and proliferation of the endometrium (the lining of the uterus, structure C) after menstruation. Progesterone, secreted by the corpus luteum after ovulation, maintains this thickened, blood vessel-rich lining, making it suitable for the implantation of a fertilised egg. A drop in progesterone levels at the end of the cycle is what triggers the shedding of this lining, leading to menstruation.
(b)(i) A sperm cell fuses with an egg cell to form a zygote. The zygote then undergoes a series of mitotic cell divisions to form a ball of cells called an embryo.
Explanation: During IVF, eggs are collected and mixed with sperm in a Petri dish. If successful, a single sperm will penetrate the egg’s outer layers, and their nuclei will fuse. This single-celled fertilised egg is called a zygote. The zygote does not increase in size but divides repeatedly by mitosis – first into 2 cells, then 4, then 8, and so on. This process of cell division forms a multicellular structure which, by the time it is transferred to the uterus, has developed into an embryo.
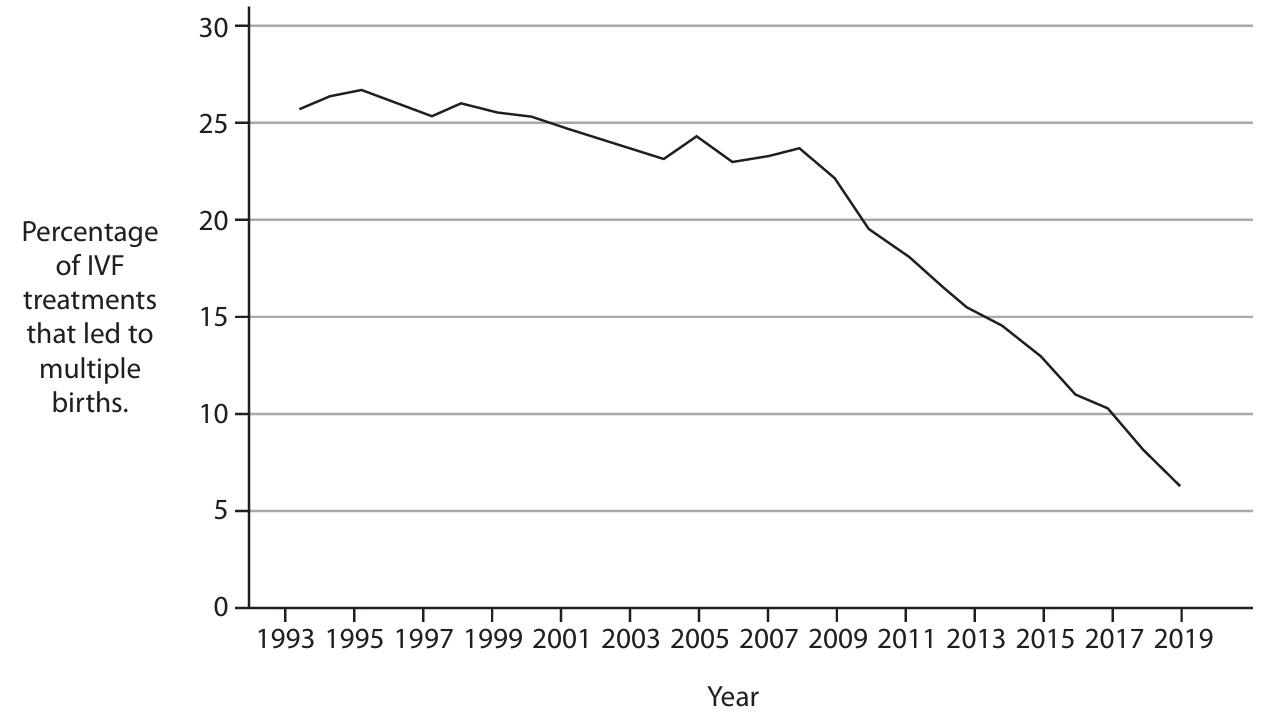
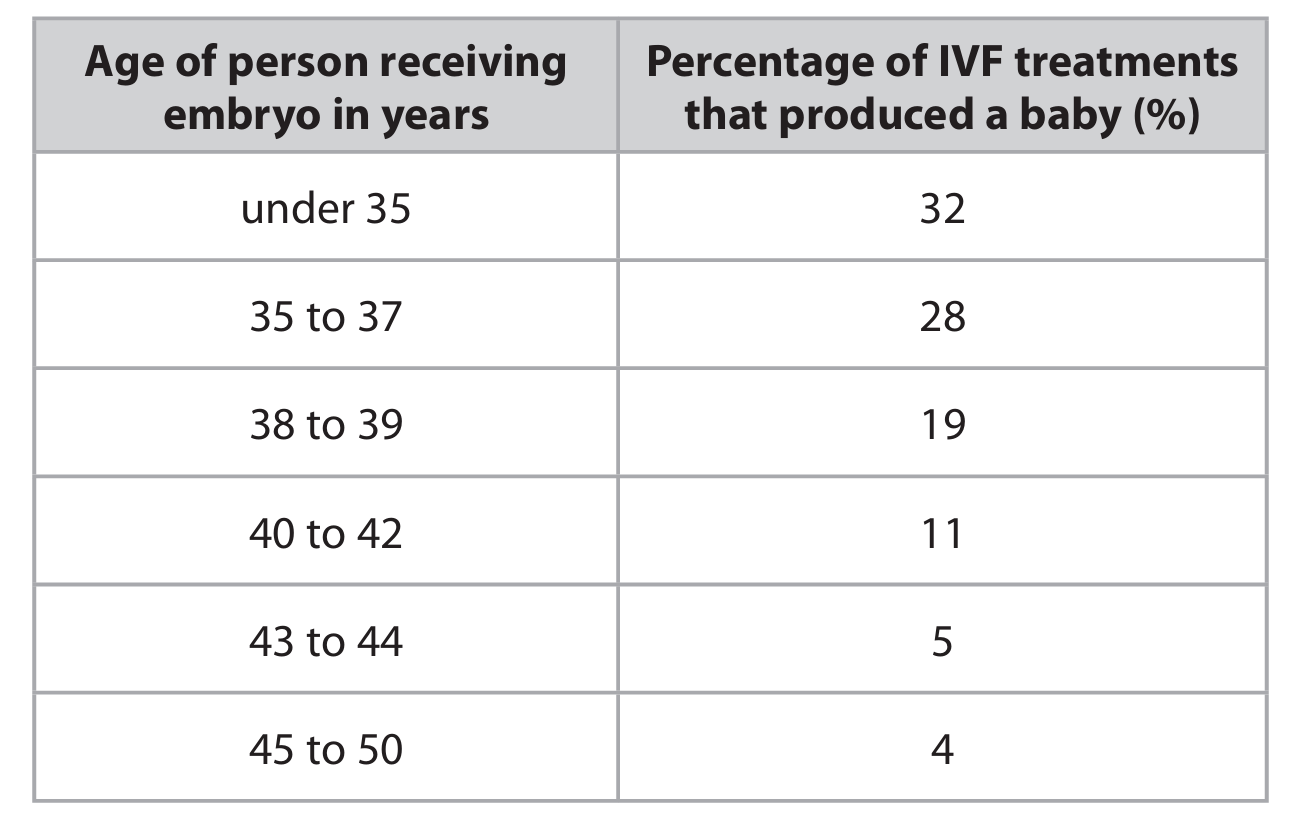
(b)(ii) Limiting embryos has significantly reduced multiple births (as shown by the graph’s steep decline post-2007), making IVF safer by reducing health risks for both parent and babies. However, the table shows success rates decrease with age. For older individuals with lower success rates, transferring two embryos balances the higher risk of twins against the low chance of success with one embryo. For younger people with high success rates, one embryo minimizes risk without drastically reducing their chance of pregnancy.
Explanation: This answer requires an evaluation of the policy based on the provided data. The graph provides clear evidence that the policy was effective in its primary goal: reducing multiple births. The table provides the rationale for the age-specific nature of the policy. The discussion balances the benefit (reduced health risks) with a drawback (potentially lower success rates for older recipients) and uses the data to justify why the age limit is set where it is.
▶️ Answer/Explanation
(a) (i) The term transgenic refers to an organism that contains genetic material (genes or alleles or DNA) that has been transferred from a different species.
Explanation: Transgenic organisms are created through genetic engineering techniques. This involves isolating a specific gene from one species (e.g., a gene for herbicide resistance from a bacterium) and inserting it into the genome of a different species (e.g., a crop plant like soybean). The resulting plant is not just genetically modified; it contains functional DNA from another species.
(a) (ii) Growing herbicide-resistant crops is beneficial because it allows farmers to spray herbicides to kill weeds without harming the crop plants. This reduces competition for resources like water, light, and minerals, leading to increased crop growth and higher yields. It also reduces the need for manual weeding, saving time and labor costs.
Explanation: Weeds compete fiercely with crops. Herbicides are effective weed killers, but they would normally kill the crop as well. By making the crop resistant, the herbicide selectively removes only the unwanted plants (weeds). With less competition, the crop plants can grow more efficiently and produce a larger harvest, which is economically advantageous for the farmer.
(b) (i) The possible genotypes for plants that are not resistant are RR (homozygous dominant) and Rr (heterozygous).
Explanation: The dominant allele (R) confers non-resistance. For a dominant trait to be expressed, an organism only needs at least one copy of the dominant allele. Therefore, both the homozygous dominant (RR) and heterozygous (Rr) genotypes will result in a plant that is not resistant to the herbicide.
(b) (ii)
Parental Phenotypes: Resistant × Heterozygous (Not Resistant)
Parental Genotypes: rr × Rr
Gametes: r R or r
Offspring:
| R | r | |
| r | Rr (Not Resistant) | rr (Resistant) |
| r | Rr (Not Resistant) | rr (Resistant) |
Explanation: The resistant parent must be homozygous recessive (rr) and can therefore only produce gametes carrying the ‘r’ allele. The heterozygous parent (Rr) can produce two types of gametes: 50% carrying the ‘R’ allele and 50% carrying the ‘r’ allele. The Punnett square shows the possible combinations of these gametes. The expected offspring are 50% Rr (not resistant) and 50% rr (resistant).
(b) (iii) The probability is 0.5 (or ½ or 50% or 2/4).
Explanation: As shown in the genetic diagram above, half of the possible offspring genotypes are ‘rr’, which is the genotype for herbicide resistance.
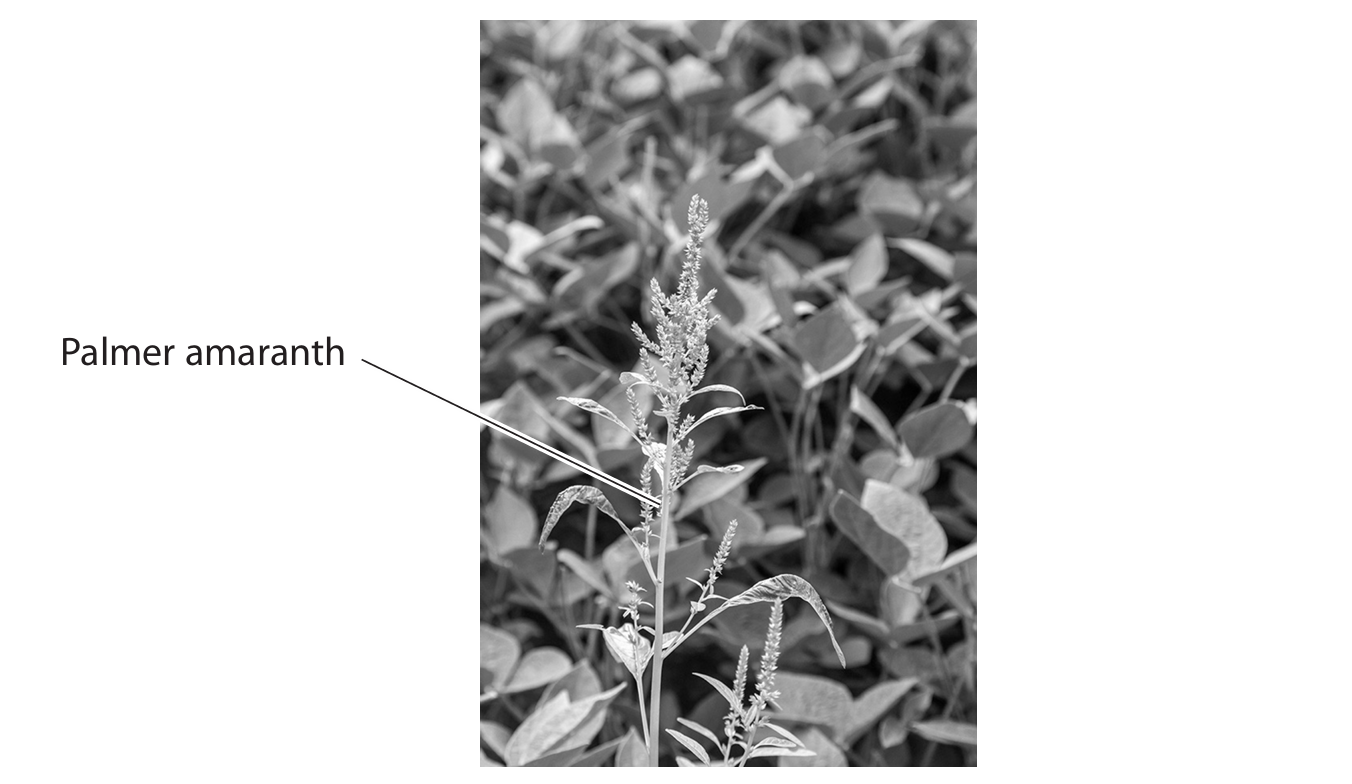
(b) (iv) Palmer amaranth evolved resistance through natural selection. Initially, within a large population of weeds, a random mutation created the recessive ‘r’ allele for resistance, introducing variation. When herbicides are used frequently, they act as a strong selection pressure. Plants without the resistance allele (RR and Rr) are killed. Only the resistant plants (rr) survive. These surviving resistant plants reproduce, passing the ‘r’ allele on to their offspring. Over many generations, the frequency of the ‘r’ allele in the population increases significantly, leading to a population that is largely resistant to the herbicide.
Explanation: This process is a classic example of evolution by natural selection. The herbicide does not create the resistance mutation; it merely selects for individuals that already possess it, allowing them to survive and become the predominant type in the environment.
(b) (v) The difference arises because dominant and recessive alleles are expressed differently. For a recessive resistance allele (r), only homozygous (rr) plants are resistant. When herbicides are used, all non-resistant plants (RR and Rr) are killed. No plants carrying the dominant ‘R’ allele survive, so it is eliminated from the population. After five years, only resistant (rr) plants remain.
For a dominant resistance allele (let’s call it D), both homozygous (DD) and heterozygous (Dd) plants are resistant and survive the herbicide. The non-resistant plants (dd) are killed. However, if two heterozygous (Dd) resistant plants reproduce, they can produce offspring with the genotype dd, which are non-resistant. These non-resistant weeds will appear in the population as long as the heterozygous genotype exists and reproduces.
Explanation: With recessive resistance, the herbicide eliminates all carriers of the non-resistant trait. With dominant resistance, the non-resistant allele (d) can “hide” undetected in the heterozygous (Dd) plants, which survive the herbicide spray. This hidden allele can then be passed on and expressed in future generations when two heterozygotes cross.
▶️ Answer/Explanation
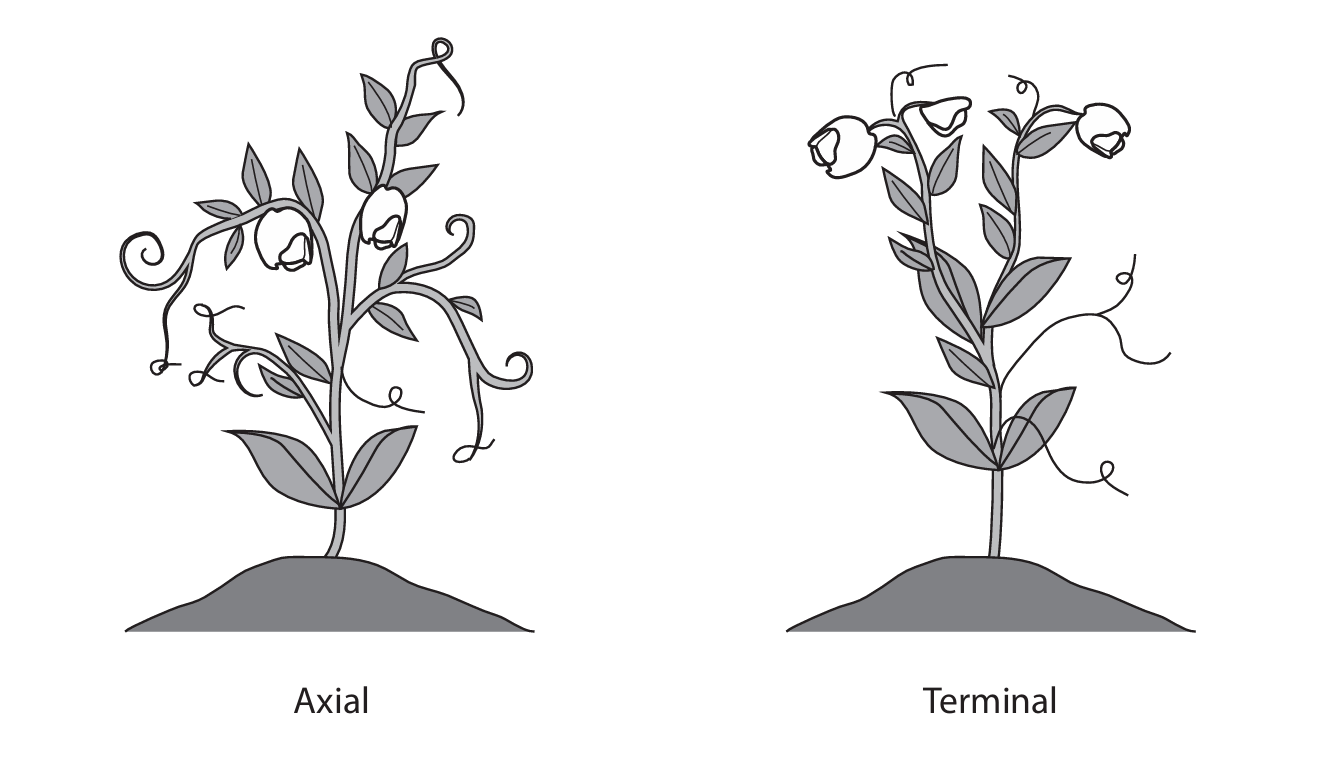
(a)
Genetic Diagram:
Parental Phenotypes: Axial flowers × Terminal flowers
Parental Genotypes: AA × aa
Gametes: A and a
Offspring Genotype: All Aa
Offspring Phenotype: All Axial flowers
Explanation: Since all offspring from the cross between axial and terminal flowered plants had axial flowers, this indicates that axial (A) is dominant over terminal (a). The homozygous recessive parent (aa) can only contribute ‘a’ gametes. The homozygous dominant parent (AA) can only contribute ‘A’ gametes. Therefore, all offspring are heterozygous (Aa) and express the dominant axial phenotype.
(b)(i)
Number of plants with terminal flowers = 858 – 608 = 250
Ratio (axial : terminal) = 608 : 250
To express in the form n:1, divide both sides by 250:
n = 608 ÷ 250 = 2.432
Therefore, the ratio is 2.43 : 1 (or approximately 2.4 : 1).
Explanation: The ratio is calculated by finding the number of terminal flower plants first (total minus axial). The ratio of axial to terminal is then simplified by dividing both numbers by the number of terminal plants to get the form n:1.
(b)(ii)
The expected phenotypic ratio from a self-fertilization of heterozygous (Aa) plants is 3 (axial) : 1 (terminal). The observed ratio (approx. 2.43:1) is different from this due to the role of chance and random fertilisation. Not all gametes fuse predictably, and factors like viability of pollen grains, success of seed germination, or survival of seedlings can cause slight deviations from the expected ratio in a finite sample size.
Explanation: Mendelian ratios are predicted probabilities. In real, biological systems with a limited number of offspring, the actual outcome can vary from the expected due to random sampling error. The difference observed here is likely due to such chance events during gamete formation, fertilization, or subsequent development, rather than indicating a different genetic mechanism.
(c)
Investigation Design:
- Control Variables: Grow a large number of pea plants of the same species, ensuring they are of similar age, health, and size. Grow them in the same environmental conditions (e.g., same temperature, light intensity, photoperiod, carbon dioxide levels, water availability, soil type, and mineral ion concentration).
- Sample Groups: Have two groups: one with plants exhibiting axial flowers and another with plants exhibiting terminal flowers. Ensure each group has a sufficient number of plants (e.g., 20-30) to account for individual variation.
- Pollination Control: To ensure seed production is due to self-fertilization and not cross-pollination, cover the flowers with bags before they open or carry out controlled self-pollination using a brush for all plants in both groups.
- Measurement: Allow the seeds to develop for a standardised time period after pollination. For each plant in both groups, count the total number of seeds produced. Alternatively, the mass of seeds produced per plant could be measured.
- Replicates and Mean: Repeat the investigation or use a large sample size to ensure reliability. Calculate the mean number (or mean mass) of seeds produced per plant for the axial flower group and the terminal flower group.
- Analysis: Compare the mean seed number/mass from the axial group to the mean from the terminal group using statistical tests to determine if any difference is significant and not due to chance.
Explanation: This design ensures a fair test by controlling variables that could affect seed production (like environment and plant health). Using large sample sizes and calculating means increases the reliability of the results. Controlling pollination is crucial to ensure the characteristic being tested (flower position) is the only major variable affecting the outcome (seed number).

▶️ Answer/Explanation
(a) To keep the temperature constant / maintain a constant temperature / control the temperature.
Explanation: The water bath is used to ensure the yeast suspension remains at a stable, optimal temperature for the duration of the experiment. This is crucial because the rate of enzyme-controlled reactions, like those in anaerobic respiration, is highly sensitive to temperature changes. A constant temperature ensures that any changes in the rate of gas production are due to the changing glucose concentration and not fluctuating temperature.
(b) Lime water OR Hydrogen carbonate indicator.
Explanation with Lime water: Lime water (a solution of calcium hydroxide) can be used. The gas produced by yeast during anaerobic respiration is carbon dioxide (CO₂). When carbon dioxide is bubbled through lime water, it reacts to form insoluble calcium carbonate, which turns the clear lime water cloudy or milky. This visible change confirms the presence of CO₂.
Explanation with Hydrogen carbonate indicator: Hydrogen carbonate indicator (a pH indicator) can also be used. Carbon dioxide dissolves in water to form carbonic acid, which lowers the pH. The hydrogen carbonate indicator solution changes colour based on pH: it is red at neutral pH, yellow/orange in acidic conditions (high CO₂), and purple in alkaline conditions (low CO₂). The production of CO₂ would therefore cause the indicator to turn from red to yellow/orange.
(c) A stopwatch / stopclock / timer OR A syringe / measuring cylinder / burette.
Explanation: To accurately measure the rate of respiration, one needs to measure the time taken to produce a certain volume of gas or the volume of gas produced in a certain time. A stopwatch is needed to measure the time accurately. Alternatively, if the apparatus is modified to collect the gas (e.g., in an inverted measuring cylinder or syringe), that measuring apparatus (syringe, measuring cylinder, burette) would be needed to measure the volume of gas produced.
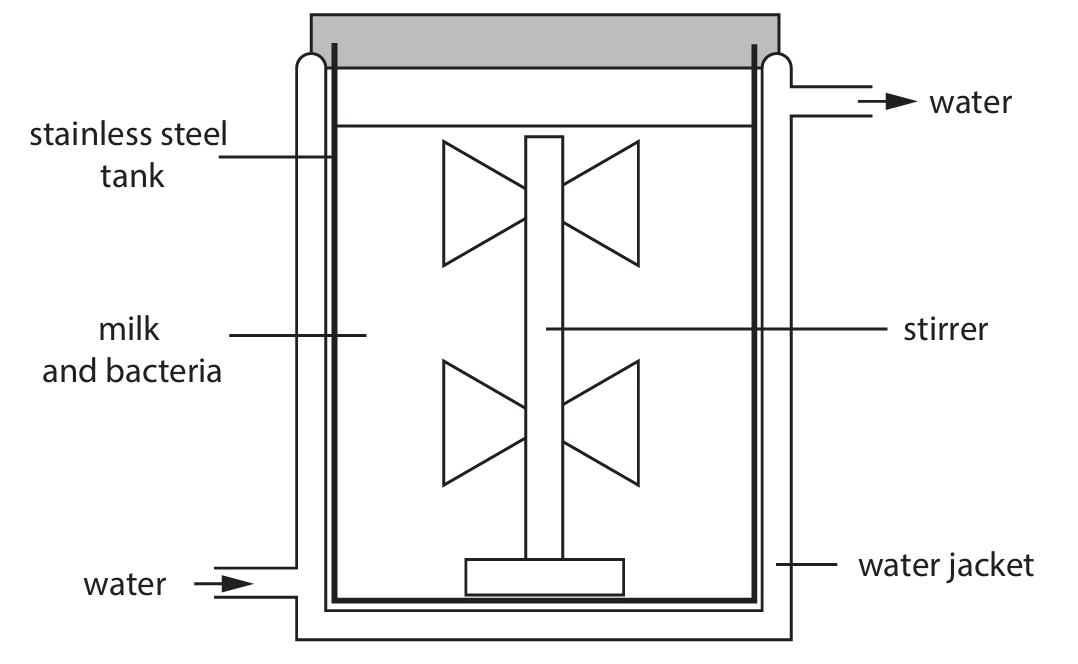
(d)(i) An explanation including four named conditions and how they are controlled is required. For example:
- Temperature: Temperature is controlled using a water jacket surrounding the fermenter. Cold water is circulated through the jacket to remove excess heat generated by the respiring microorganisms and maintain the optimum temperature for their growth and penicillin production.
- pH: pH is monitored using pH probes and maintained at the optimum level by the automatic addition of acids or alkalis through inlet pipes to ensure enzyme activity is not inhibited.
- Oxygen (aeration): Oxygen concentration is controlled for aerobic respiration using an aerator or sparger, which pumps sterile air into the fermenter. This provides the oxygen needed for the microorganisms to respire and grow efficiently.
- Nutrients: Nutrients are provided in a nutrient medium and are often added continuously or in batches (fed-batch culture) to ensure microorganisms never run out of food for growth and product synthesis.
- Agitation (Mixing): The contents are mixed using motor-driven impellers (paddles/stirrers). This ensures even distribution of nutrients, oxygen, and heat throughout the vessel, preventing the formation of gradients and ensuring all microorganisms have equal access to resources.
- Aseptic Conditions (Preventing Contamination): Conditions are kept sterile to prevent competition from unwanted microbes. Air entering the fermenter is filtered to remove contaminants, and the vessel is sterilized with steam before use.
(Any four valid points, each consisting of a named condition and its control method, would score the marks.)
(d)(ii) Bacteria have evolved resistance to antibiotics through natural selection.
- Within a bacterial population, there is genetic variation due to random mutations.
- Some of these mutations may happen to confer resistance to a particular antibiotic. For example, a mutation might change the shape of the protein that the antibiotic usually targets, so the antibiotic can no longer bind effectively.
- When the antibiotic is used, it acts as an environmental selection pressure. Non-resistant bacteria are killed by the antibiotic.
- The resistant bacteria survive because the antibiotic is ineffective against them.
- These surviving resistant bacteria then reproduce (multiply by binary fission).
- They pass the allele(s) for resistance on to their offspring.
- Over time and with repeated use of the antibiotic, the proportion of resistant bacteria in the population increases, making the antibiotic less effective at controlling infections caused by that bacterial species.
This process is a classic example of natural selection and is a major challenge in modern medicine.

▶️ Answer/Explanation
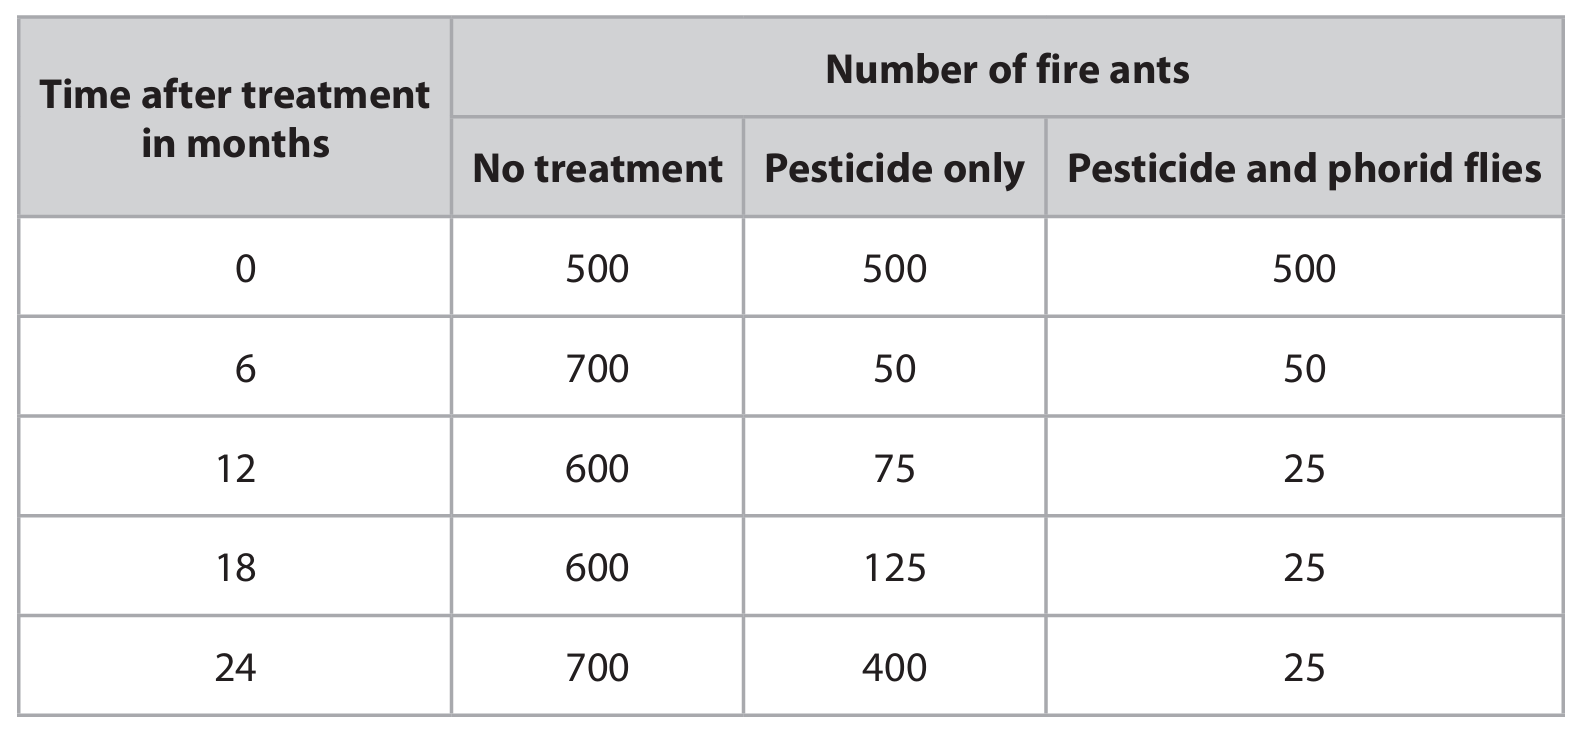
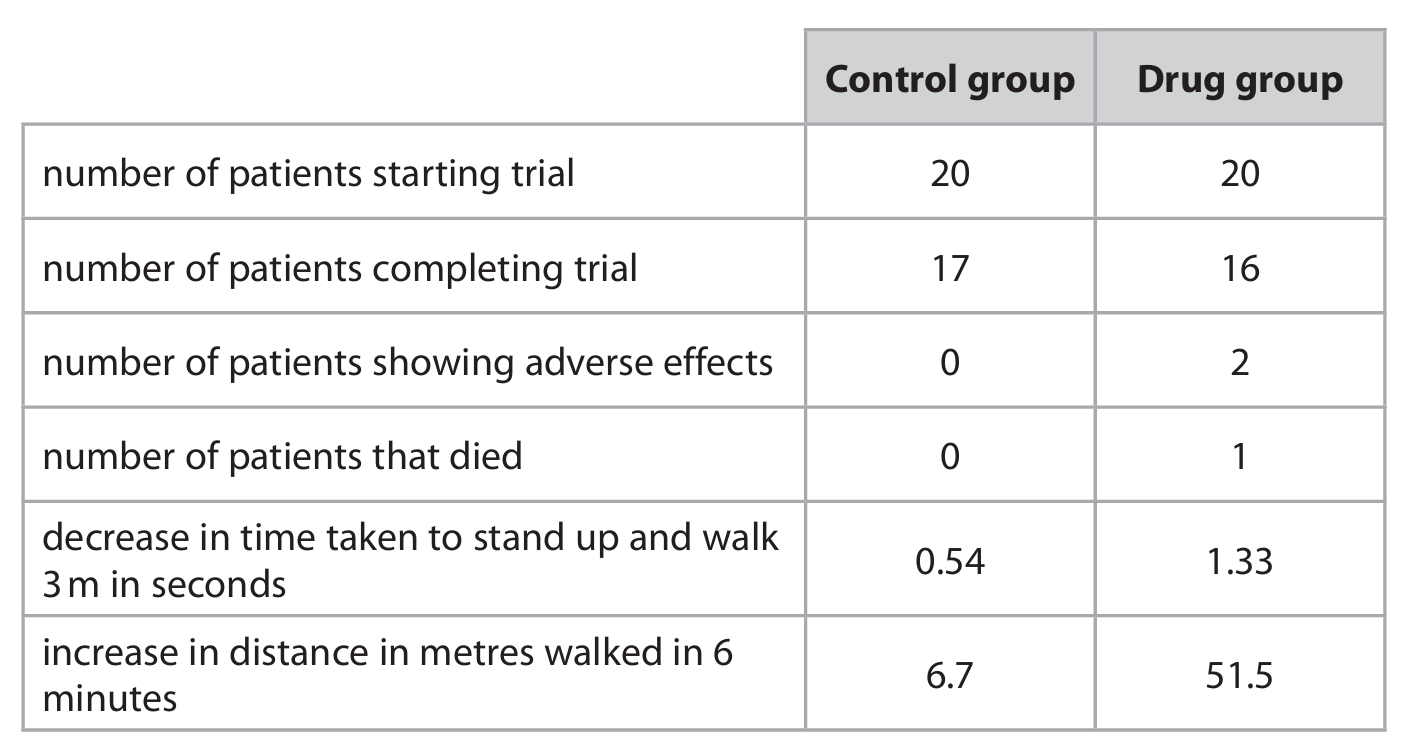
(a) It is a control (experiment) / to compare the results / check that change is due to the treatments.
Explanation: The glasshouse with no treatment serves as a control. This is a fundamental part of a scientific investigation. The control provides a baseline for comparison. It allows the scientists to see what happens to the fire ant population when no treatment is applied. By comparing the results from the treated glasshouses to this control, they can be confident that any changes observed (like a decrease in ant numbers) are actually due to the pesticide or the combination of pesticide and flies, and not just due to other factors that might affect the population over time.
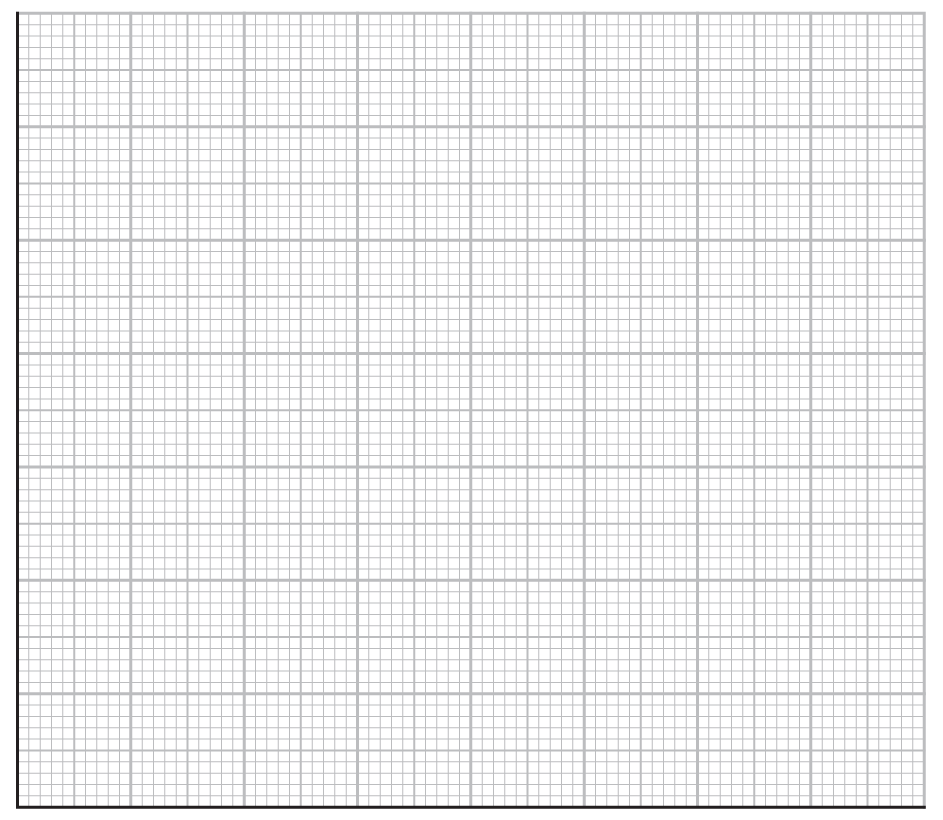
(b)
Graph Description: A line graph should be drawn with the following features to score full marks:
- Axes: The x-axis should be labelled “Time after treatment (months)” and the y-axis should be labelled “Number of fire ants”. Both axes must have a linear scale that uses at least half of the grid provided.
- Data Points: Points should be plotted accurately for both data sets (Pesticide only and Pesticide + phorid flies) at the correct time intervals (0, 6, 12, 18, 24 months).
- Lines: The plotted points for each data set should be joined with straight lines.
- Key: The graph must include a key or the lines must be clearly labelled to identify which line represents “Pesticide only” and which represents “Pesticide and phorid flies”.
Explanation: The graph for “Pesticide only” would start at 500 ants at 0 months, drop sharply to 50 at 6 months, rise slightly to 75 at 12 months, continue rising to 125 at 18 months, and then rise sharply again to 400 at 24 months. The graph for “Pesticide and phorid flies” would also start at 500, drop to 50 at 6 months, but then drop further to 25 at 12 months and remain steady at 25 for both 18 and 24 months. This visual representation clearly shows the initial effectiveness of both treatments and the crucial long-term difference the biological control agent makes.
(c) The number of fire ants decreases (sharply at first) and then increases (again).
Explanation: Looking at the data for “Pesticide only”, we see a very effective initial result. The number of ants plummets from 500 to just 50 within the first 6 months. This shows the pesticide is highly effective at killing the ants upon application. However, after this initial success, the population begins to recover. It increases to 75 at 12 months, 125 at 18 months, and is nearly back to its original size at 400 by 24 months. This indicates that the effect of the pesticide is not lasting.
(d) Discussion points should include:
- Both treatments (pesticide alone and pesticide + flies) are initially very effective, drastically reducing the ant population within 6 months.
- The population recovers over time when only pesticide is used, reaching 400 ants by 24 months. This suggests the pesticide’s effect is temporary; it may wear off, wash away, or the ants may develop resistance to it through natural selection. Resistant ants survive and reproduce, passing on the resistance allele to their offspring.
- In contrast, when phorid flies (a biological control agent) are introduced alongside the pesticide, the ant population is not only reduced but is also maintained at a very low level (25 ants) from 12 months onwards.
- The phorid flies provide a sustainable, long-term control method. Unlike the chemical pesticide, the flies can reproduce and continue to prey on the fire ants, keeping their population in check. The population stabilizes at a low level where the death rate (due to predation by flies) equals the birth rate.
- This shows that integrating biological control (phorid flies) with chemical control (pesticide) is a much more effective long-term strategy for managing fire ant populations than using pesticides alone. The pesticide provides a quick “knock-down” of the population, and the biological control agent prevents it from recovering.
Explanation: The data clearly shows that while pesticides offer a powerful short-term solution, they often fail as a long-term strategy on their own due to factors like resistance development. Biological control, though it may work more slowly, acts as a persistent regulating force. The combination of both methods leverages the immediate impact of the pesticide with the sustained, self-replicating pressure of the biological control agent, resulting in a much more effective and durable pest management outcome. This is a key principle in integrated pest management (IPM).

▶️ Answer/Explanation
(a) B (6 and 12)
Explanation: Pollen grains are gametes, which are produced by meiosis. Meiosis halves the chromosome number, so a pollen grain nucleus (male gamete) from a plant with a diploid number of 12 would have a haploid number of 6 chromosomes. A root cell is a somatic (body) cell and is produced by mitosis, which maintains the chromosome number. Therefore, a root cell nucleus would have the full diploid number of 12 chromosomes.
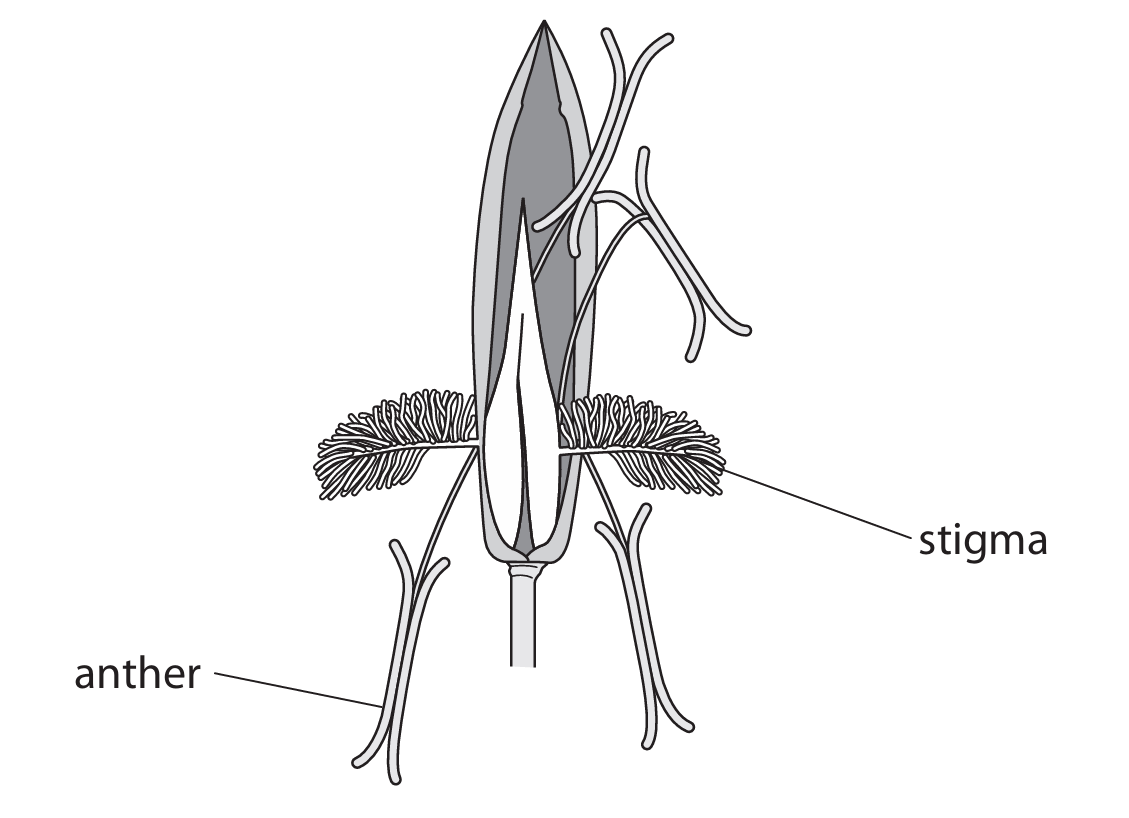
(b) An explanation of two adaptations, each with its function:
Explanation: Wind-pollinated flowers, like those of grasses, have specific adaptations to facilitate pollen transfer by wind rather than insects. Two key adaptations are:
- Exposed Anthers: The anthers are often hanging on long, flexible filaments outside the flower. This positioning allows the wind to easily catch and blow the pollen away from the plant.
- Feathery Stigma: The stigma is often large, feathery, and hangs outside the flower. This structure provides a large surface area to effectively catch pollen grains that are drifting in the air.
Other possible adaptations include producing large quantities of light, smooth pollen grains and having small, inconspicuous petals with no nectar or scent, as they do not need to attract insects.
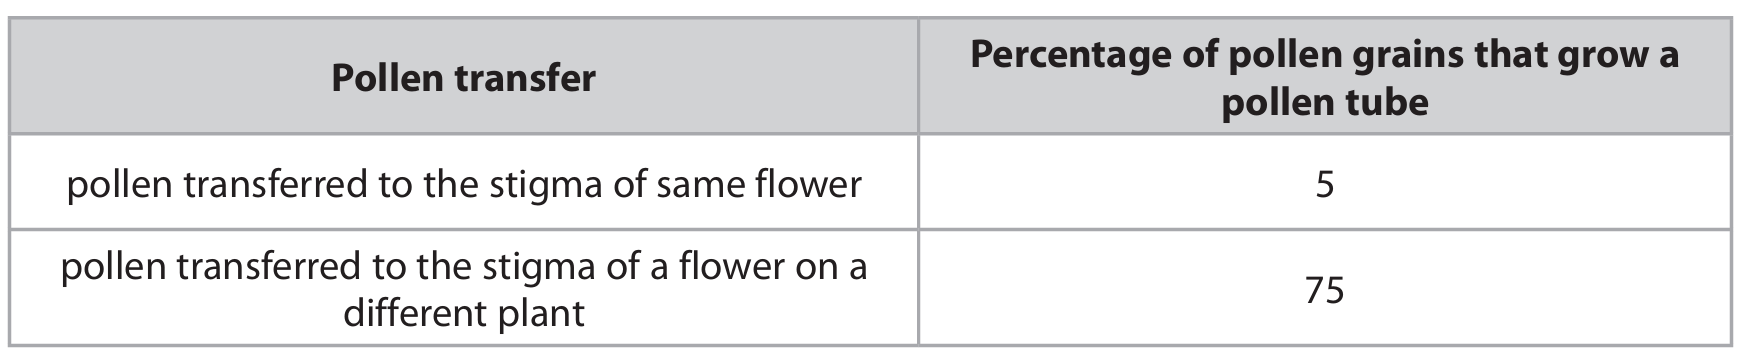
(c)(i) The percentage (or proportion/number) of pollen grains that grow a pollen tube.
Explanation: The dependent variable is what is measured in the experiment. In this case, the scientists are changing where the pollen is placed (the independent variable) and then measuring the effect this has on the success of pollen tube growth.
(c)(ii) An explanation linking cross-pollination to genetic variation and survival:
Explanation: The results show a much higher success rate for cross-pollination (75%) compared to self-pollination (5%). Cross-pollination involves the fusion of gametes from two different parent plants. This combines their different alleles, leading to greater genetic variation in the offspring. In a changing environment, this variation is crucial. Some individuals within the population are likely to possess combinations of alleles that make them better adapted to the new conditions (e.g., more resistant to a new disease or better suited to a changed climate). These individuals are more likely to survive and reproduce, passing on their advantageous alleles to the next generation. This process, natural selection, allows the species to evolve and survive over time. Self-pollination leads to less genetic variation, making the population more vulnerable if the environment changes, as seen by the low success rate.
(d)(i) Mitosis
Explanation: Asexual reproduction involves the production of genetically identical offspring from one parent. This is achieved through mitosis, a type of cell division that results in two daughter cells each having the same number and kind of chromosomes as the parent nucleus.
(d)(ii) An description of two advantages for commercial growers:
Explanation: Asexual reproduction is advantageous for commercial growers because it allows for the production of uniform crops. Since mitosis produces genetically identical clones, all the new plants will have the same desirable characteristics as the parent plant (e.g., high yield, specific fruit size, disease resistance). This ensures consistency and predictability in the harvest. Furthermore, it can be a faster method of propagation than growing from seed, allowing growers to produce large numbers of plants quickly to meet demand.

▶️ Answer/Explanation
(a)(i) Brain or Spinal Cord.
Explanation: The Central Nervous System (CNS) is composed of two main parts: the brain and the spinal cord. These structures are responsible for processing information and coordinating responses throughout the body.
(a)(ii) A description including four of the following points:
- A receptor in the skin detects the sharp object/stimulus.
- This generates an electrical impulse.
- The impulse travels along a sensory neurone to the CNS (spinal cord).
- In the spinal cord, the impulse may pass via a relay neurone across a synapse (using neurotransmitters).
- The impulse is then passed to a motor neurone.
- The motor neurone carries the impulse to an effector (a muscle in the leg).
- The muscle contracts, causing the foot to be withdrawn.
Explanation: This is an automatic, rapid, protective response called a reflex arc. It bypasses the brain to save time. The sensory neurone carries information towards the CNS, and the motor neurone carries the instruction away from the CNS to the muscle (the effector) which performs the action. Synapses ensure the impulse travels in one direction only.
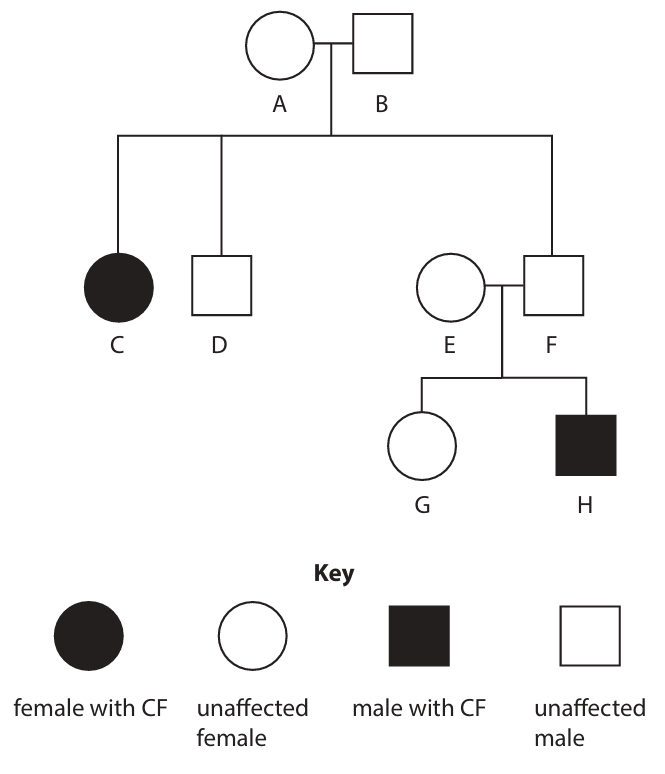
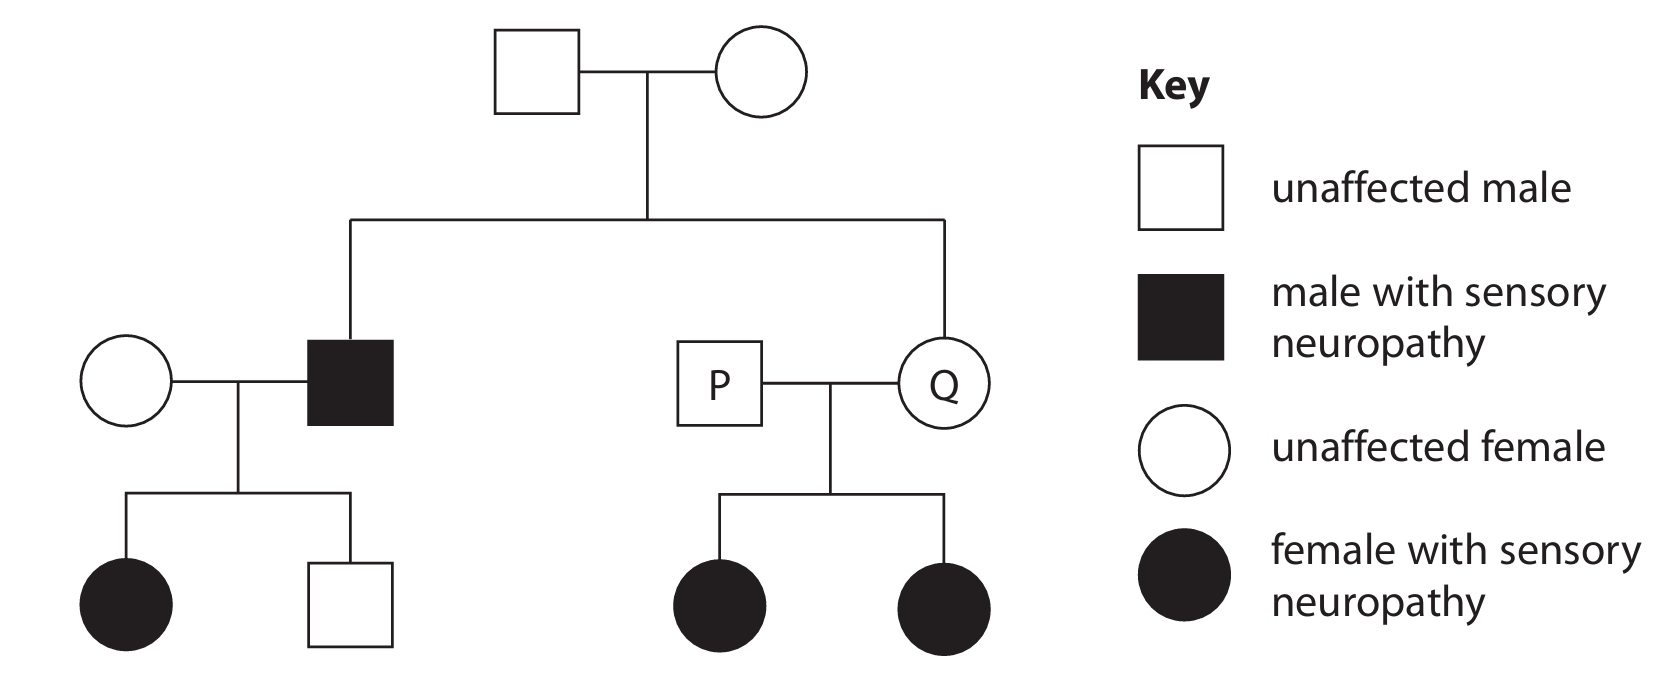
(b)(i) B (XY)
Explanation: In mammals like dogs and humans, sex is determined by the X and Y chromosomes. Females have two X chromosomes (XX), and males have one X and one Y chromosome (XY). The Y chromosome carries genes that trigger male development.
(b)(ii) D (6)
Explanation: Sensory neuropathy is recessive (nn). Unaffected individuals must have at least one dominant allele (N). Any unaffected individual that has an affected offspring (nn) must be a carrier (heterozygous, Nn) because they had to pass on an ‘n’ allele to their affected child. By analyzing the pedigree, we can identify 6 such carriers (Nn).
(b)(iii) Probability = 1/8 or 0.125 or 12.5%
Genetic Diagram:
Parents: Nn (P) × Nn (Q)
Gametes: P produces N or n; Q produces N or n.
Q Gametes ↓ P → | N | n | +-------+-------+ N | NN | Nn | +-------+-------+ n | Nn | nn | +-------+-------+
Explanation: The Punnett square shows the cross between two heterozygous parents (Nn × Nn). The genotypic ratio of the offspring is 1 NN : 2 Nn : 1 nn. Therefore, the probability of an offspring having sensory neuropathy (nn) is 1/4. Sex determination is independent of this autosomal gene. The probability of an offspring being male is 1/2. To find the combined probability of being male AND having nn, we multiply the independent probabilities: (1/4) × (1/2) = 1/8.
(b)(iv) Selective breeding, also known as artificial selection, could be used to remove the harmful ‘n’ allele by carefully choosing which dogs breed together.
The process would involve:
- Testing: First, all potential breeding dogs would be genetically tested to determine their genotype for the sensory neuropathy gene (NN, Nn, or nn).
- Selection of Parents: Only dogs that are confirmed to be homozygous dominant (NN) – meaning they do not carry the harmful allele – would be selected as breeding stock. Dogs with the genotype Nn (carriers) or nn (affected) would be prevented from breeding.
- Repetition over Generations: This selective process would be repeated over many generations. By never allowing the ‘n’ allele to be passed on, its frequency in the population’s gene pool would decrease.
- Goal: Over time, the aim would be to eliminate the ‘n’ allele entirely from the breeding population, resulting in a population where all individuals are NN and therefore cannot have or pass on sensory neuropathy.
Potential Challenge: A significant challenge is that carriers (Nn) are phenotypically normal (unaffected). Without genetic testing, breeders might accidentally select carriers for breeding, which would perpetuate the allele in the population. Therefore, reliable genetic testing is crucial for this strategy to be successful.


▶️ Answer/Explanation
(a)
Calculation:
For 1992:
Total moths = 9 (light) + 27 (dark) = 36
Percentage dark = (27 / 36) × 100 = 75%
For 1998:
Total moths = 13 (light) + 9 (dark) = 22
Percentage dark = (9 / 22) × 100 ≈ 40.91% (or 41%)
Difference:
75% – 40.91% = 34.09% (Accept answers in the range of 34% to 34.1%)
Explanation: The calculation involves finding the percentage of dark moths for each year by dividing the number of dark moths by the total number of moths caught that year and multiplying by 100. The difference between these two percentages is then found by subtraction.
(b) (i)
Graph Requirements (for full marks):
- Appropriate linear scale using at least half the graph paper.
- Axes correctly labelled (e.g., “Year” on x-axis, “Number of moths” on y-axis).
- Points plotted accurately within half a small square.
- Straight lines drawn to connect the points.
- A key or labels to distinguish the line for light-coloured moths from the line for dark-coloured moths.
Explanation: A line graph is the correct choice to show trends over time. The x-axis should represent the years from 1992 to 1998, and the y-axis should represent the number of moths. Two separate lines should be drawn: one for the light-coloured moth counts and another for the dark-coloured moth counts. Using a ruler ensures the lines are neat and straight, connecting the data points accurately.
(b) (ii)
Comment:
- The number of dark-coloured moths generally decreased from 1992 to 1995 (from 27 to 1), then showed a slight but unsteady increase towards 1998 (reaching 9).
- The number of light-coloured moths was more variable but showed an overall increase from 1992 to 1998, particularly after a low point in 1996. The initial number was 9, it fluctuated, and ended at 13 in 1998.
- The overall total number of moths decreased significantly from 1992 to 1996 (from 36 to 5) before increasing again by 1998 (to 22). This overall change could be due to factors like disease, predation, or lack of food affecting the total population.
- These changes are linked to the reduction in coal burning and air pollution. Soot from coal had previously darkened tree trunks, providing camouflage for dark moths against predators like birds. As pollution decreased, tree trunks became lighter.
- This made dark moths more visible and thus more vulnerable to predation, causing their numbers to fall initially.
- Conversely, light moths became better camouflaged on the cleaner trees, leading to their survival and increase in numbers (natural selection).
- The subsequent slight recovery of dark moths might be due to other factors like genetic diversity or local variations in habitat, but the overall trend shows the population adapting to the cleaner environment, favouring the light-coloured form.
Explanation: This answer comments on the specific trends for each colour morph, links the initial dominance of the dark morph to industrial melanism and camouflage on sooty trees, and explains how the environmental change (clean air laws) reversed the selective pressure. It also acknowledges other potential factors affecting population size and the role of natural selection in driving these changes over time.


▶️ Answer/Explanation
(a)(i) A red blood cell cannot be used to show a karyotype because it lacks a nucleus. The nucleus is the organelle that contains the chromosomes. Since red blood cells in mammals are anucleated (they lose their nucleus during development to make more space for hemoglobin), they do not contain any chromosomal material that can be photographed and arranged into a karyotype.
(a)(ii) The type of cell division that occurs in white blood cells is mitosis. Mitosis is the process of nuclear division in eukaryotic cells that results in two daughter cells each having the same number and kind of chromosomes as the parent nucleus. It is the division responsible for general growth and repair in the body.
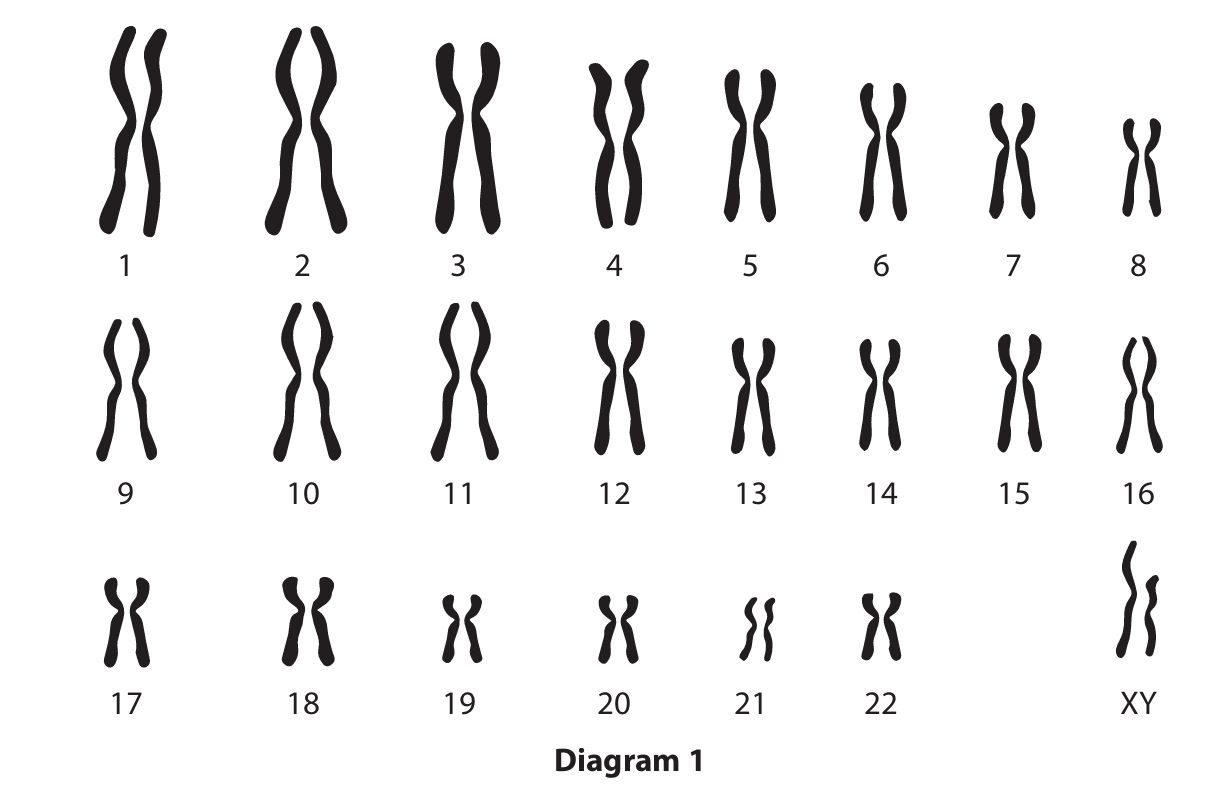
(a)(iii) The karyotype in Diagram 1 can be identified as male because the 23rd pair of chromosomes consists of one X chromosome and one Y chromosome. In humans, females have two X chromosomes (XX), while males have one X and one Y chromosome (XY). The presence of the Y chromosome is the definitive indicator of a male karyotype.
(b)(i) The key difference between the two karyotypes is the number of chromosomes. Diagram 1 (the male) shows the normal human diploid number of 46 chromosomes. Diagram 2 (the female with Turner syndrome) shows only 45 chromosomes; specifically, there is only one sex chromosome present (a single X chromosome), denoted as 45,X.
The effects of Turner syndrome on the person are significant. Due to the missing X chromosome and the resulting hormonal deficiencies (particularly oestrogen), the individual will likely not undergo normal puberty. This leads to a lack of development of secondary sexual characteristics (such as breast development). Furthermore, the ovaries are typically underdeveloped (streak ovaries) and do not produce viable eggs, making the person infertile. There can also be other health implications, such as short stature and potential heart defects.
(b)(ii) The chromosomal difference in Turner syndrome (45,X) is most commonly produced by a process called non-disjunction. This is an error that can occur during the formation of the gametes (eggs or sperm) in one of the parents. Specifically, during meiosis, the paired sex chromosomes (X and X in a female, or X and Y in a male) fail to separate properly. If an egg or sperm that lacks a sex chromosome (is nullisomic) fuses with a normal gamete containing one X chromosome, the resulting zygote will have only one X chromosome, leading to Turner syndrome.

▶️ Answer/Explanation
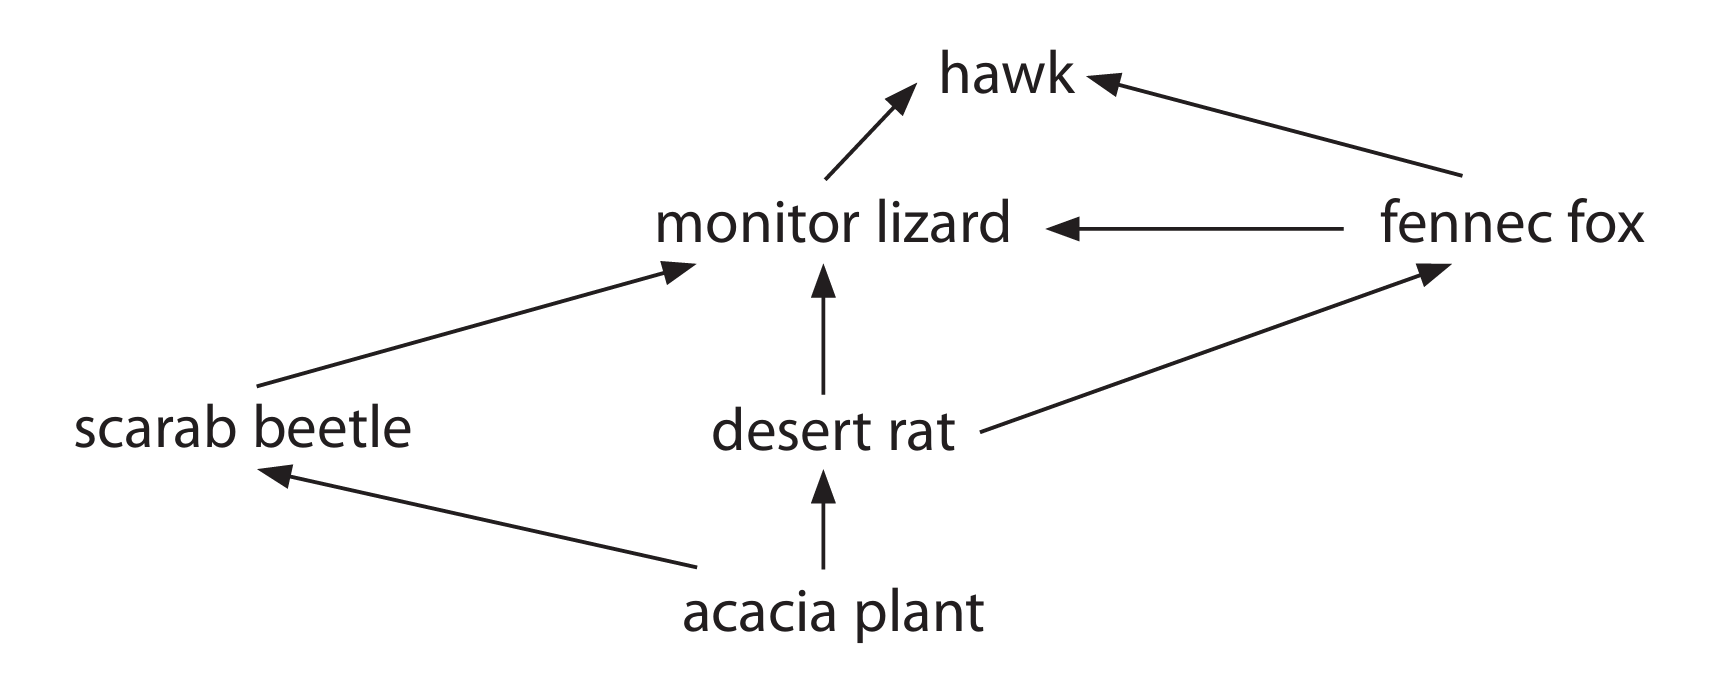
(a)(i) A – 2
Explanation: Secondary consumers are organisms that feed on primary consumers. In this food web, the fennec fox feeds on the desert rat (a primary consumer), and the monitor lizard feeds on the fennec fox (another primary consumer). Therefore, there are two secondary consumers: the fennec fox and the monitor lizard.
(a)(ii) Acacia plant → desert rat → fennec fox → monitor lizard → hawk
Explanation: This is the longest chain because it includes all the trophic levels from the producer (acacia plant) to the top predator (hawk), involving four transfers of energy.
(a)(iii) Most of the energy from the producers is not transferred to the hawk due to energy losses at each trophic level. These losses occur because:
- Energy is lost through indigestible parts of food that are egested as feces and not absorbed.
- Energy is used for metabolic processes like respiration, movement, and active transport, and is lost as heat.
- Energy is excreted in waste products such as urine.
- Not all parts of organisms are consumed; some may die and decompose without being eaten.
As a result, only about 10% of the energy is transferred from one trophic level to the next, so very little energy from the producers reaches the top consumer.
(b) The body shape of the fennec fox, including its large ears and thin body, has evolved through natural selection:
- Initially, genetic variation existed in the fox population due to random mutations, resulting in some individuals having larger ears and thinner bodies.
- In the hot desert environment, these features provided advantages: large ears have a large surface area for losing excess body heat, helping to keep the fox cool, and a thin body reduces heat retention.
- Individuals with these advantageous traits were more likely to survive in the harsh desert conditions.
- These survivors reproduced and passed on the alleles for these traits to their offspring.
- Over many generations, the frequency of these alleles increased, leading to the evolution of the fennec fox’s current body shape.
▶️ Answer/Explanation
(a)(i) B
Explanation: Ovulation is the process where a mature egg is released from the ovary. In the diagram, label B points to the ovary, which is the correct site for ovulation. The oviduct (A) is where the egg travels, the uterus (C) is where implantation occurs, and the vagina (D) is the birth canal; none of these are where ovulation happens.
(a)(ii) A
Explanation: Fertilisation, the fusion of a sperm cell with an egg cell, typically occurs in the oviduct (also known as the Fallopian tube). Label A points to the oviduct. The ovary (B) produces eggs but is not the site of fertilisation. The uterus (C) is for implantation and development, and the vagina (D) is the passage for sperm entry but not where fertilisation occurs.
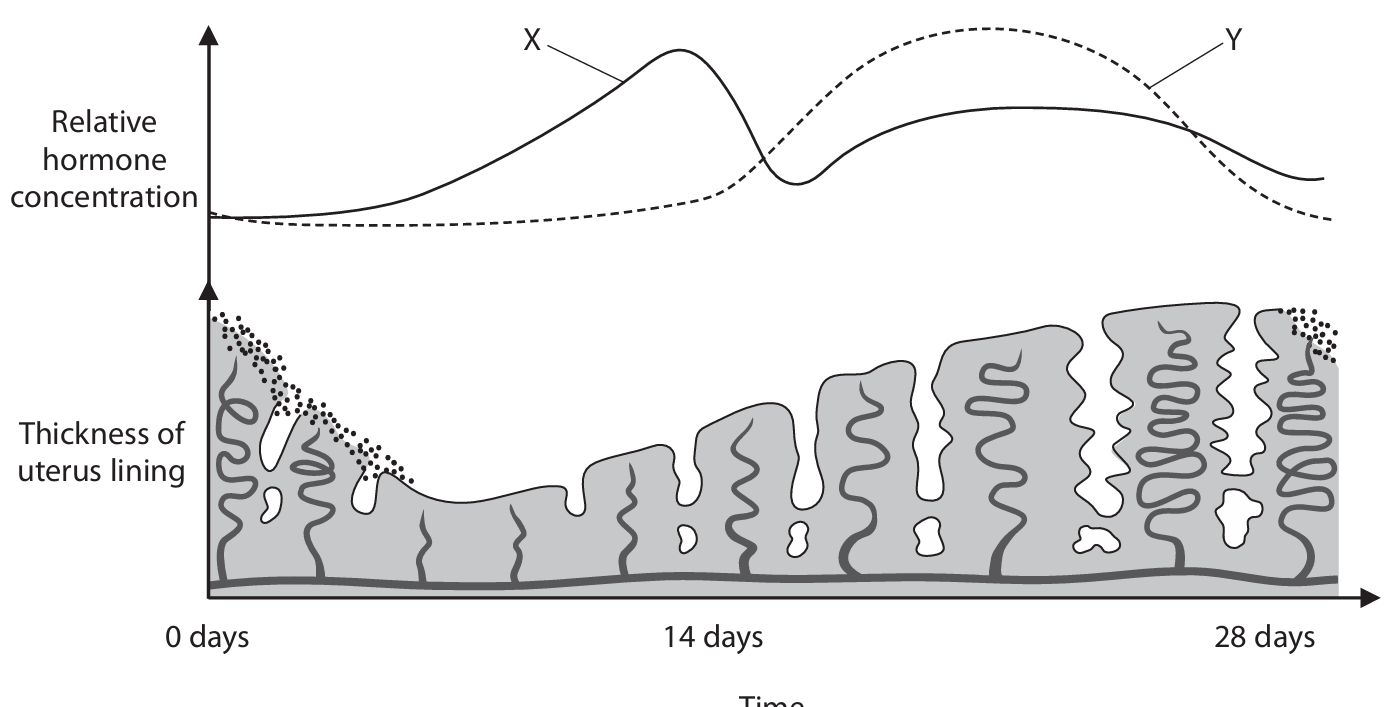
(b)(i)
X: Oestrogen (or Estrogen)
Y: Progesterone
Explanation: Hormone X peaks just before day 14. This is characteristic of oestrogen, which stimulates the repair and thickening of the uterus lining (proliferative phase) and also triggers the surge in Luteinizing Hormone (LH) that causes ovulation. Hormone Y rises sharply after the peak of X and remains high throughout the second half of the cycle. This is characteristic of progesterone, which maintains the thickened uterus lining (secretory phase) in preparation for a potential pregnancy.
(b)(ii)
Explanation: Hormone X is oestrogen. Its primary function during the menstrual cycle is to stimulate the repair and proliferation (thickening) of the endometrium, the lining of the uterus, after menstruation. This creates a nutrient-rich environment suitable for the implantation of a fertilised egg. Additionally, oestrogen plays a key role in stimulating the pituitary gland to release a surge of Luteinizing Hormone (LH), which directly triggers ovulation.
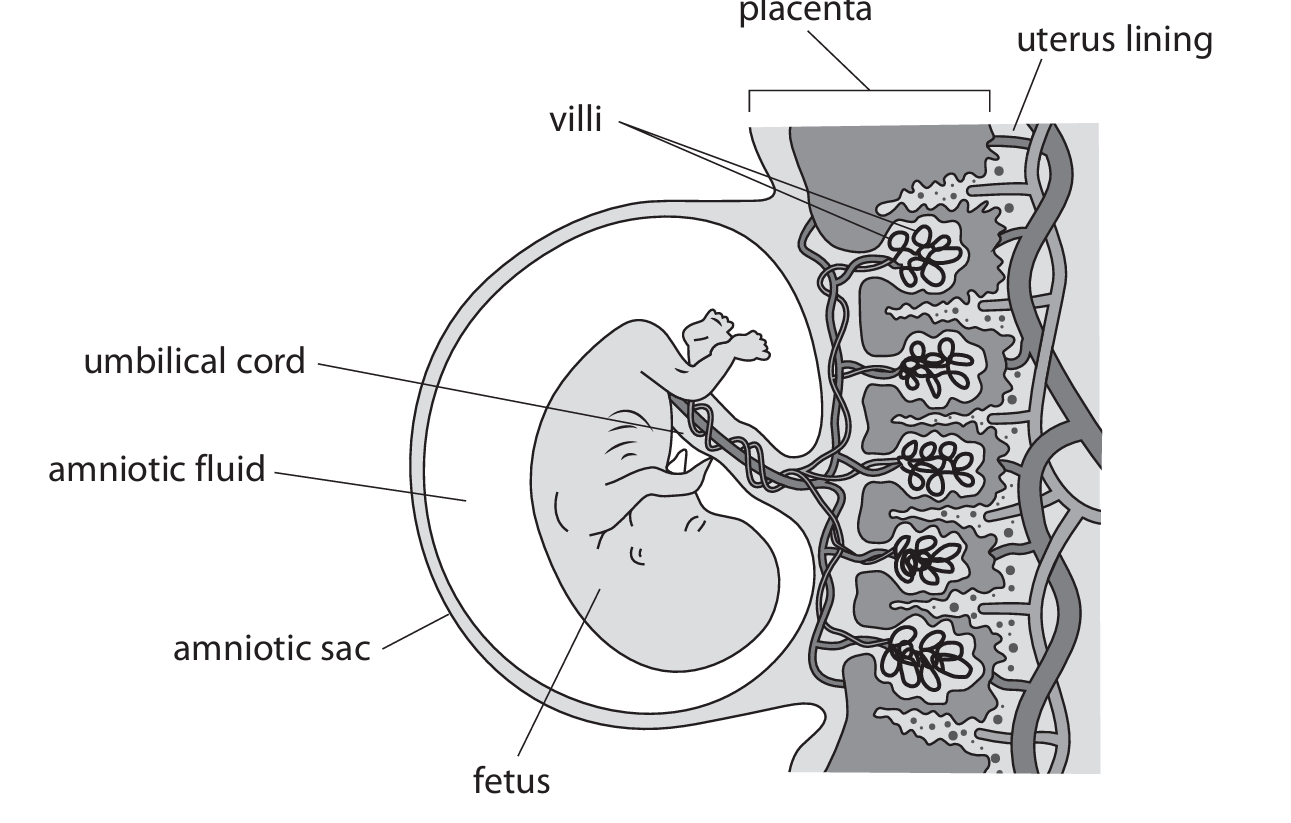
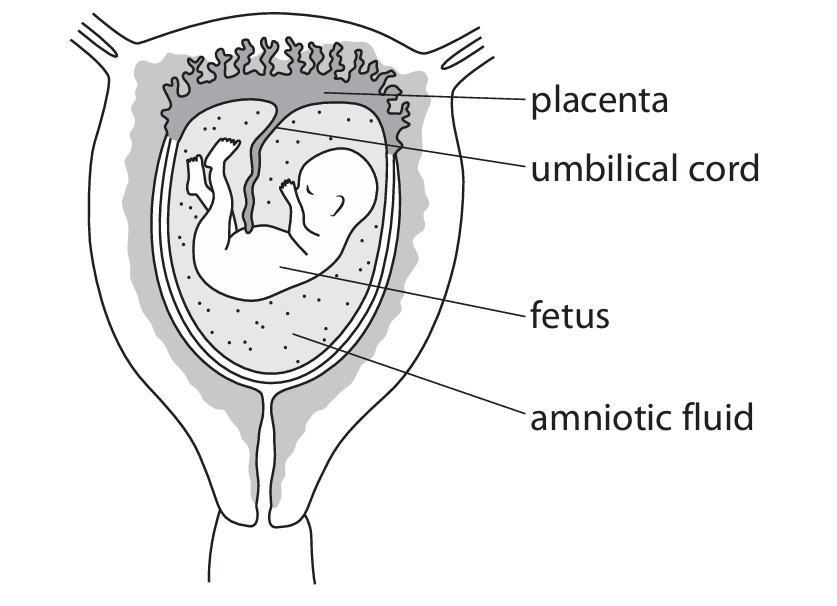
(c)
Explanation: The placenta is a highly specialised organ that facilitates efficient exchange through several structural adaptations:
- Large Surface Area: The placenta contains numerous finger-like projections called villi. This vastly increases the surface area available for the diffusion of substances like oxygen, nutrients (glucose, amino acids), and waste (carbon dioxide, urea) between the maternal and fetal bloodstreams.
- Thin Membrane / Short Diffusion Pathway: The walls of the fetal capillaries within the villi are extremely thin. Furthermore, these capillaries are in very close proximity to the maternal blood spaces. This minimizes the distance substances must diffuse across, making the process rapid and efficient.
- Maintained Concentration Gradient: The fetal blood and maternal blood flow in close proximity but do not mix directly. The constant flow of fetal blood removes absorbed oxygen and nutrients, keeping their concentration low. Conversely, the constant flow of maternal blood brings a fresh supply of oxygen and nutrients, keeping their concentration high. This counter-current flow system helps maintain steep concentration gradients for diffusion across the entire length of the placenta.
These three features – large surface area, short diffusion distance, and maintained concentration gradient – are the fundamental principles of an efficient exchange surface, all of which are exemplified by the structure of the placenta.
▶️ Answer/Explanation
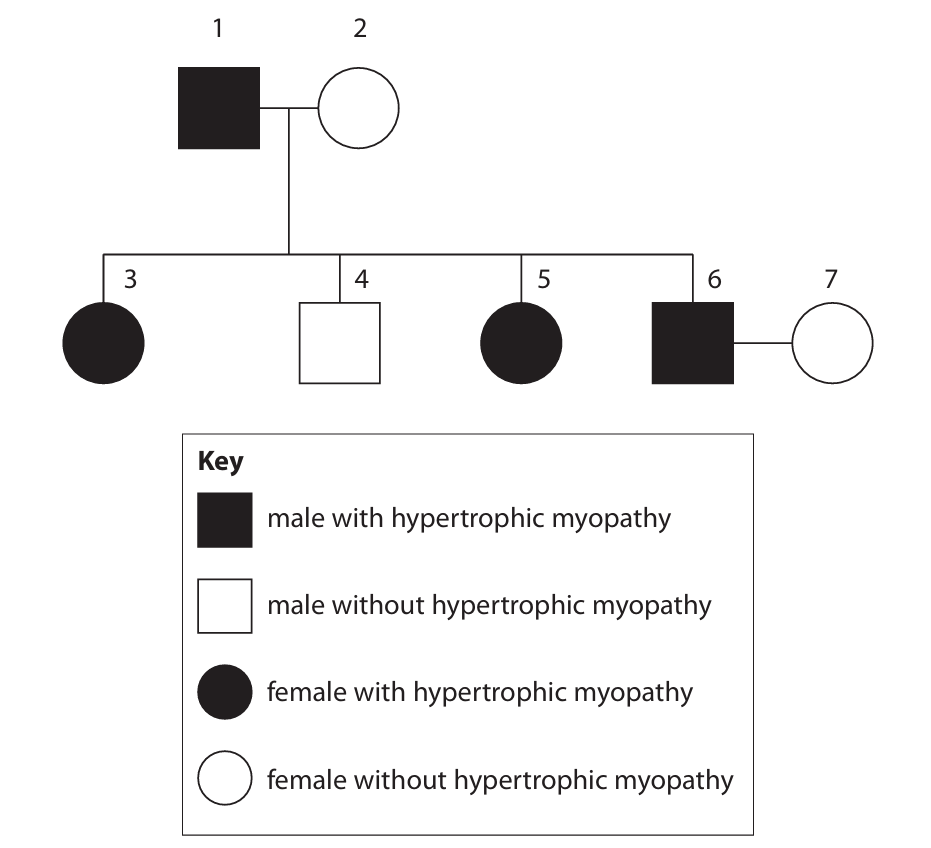
(a) (i) The condition causes the left ventricle wall to be less elastic. This means the heart chamber cannot fill with as much blood or pump blood out as effectively with each beat (reduced stroke volume). Consequently, less oxygenated blood is pumped to the muscles during running. The muscles therefore receive less oxygen for aerobic respiration, which is needed to release the large amounts of energy required for fast movement, making the cat unable to run quickly.
(a) (ii) A dominant allele is an allele that will always be expressed in the phenotype, even if only one copy is present (i.e., in a heterozygous individual).
(a) (iii)
Genetic Diagram:
Parental Phenotypes: Individual 6 (Unaffected) x Individual 7 (Unaffected)
Parental Genotypes: hh x hh (Both must be homozygous recessive to be unaffected, as the condition is dominant)
Gametes: All gametes from both parents are h.
Offspring Genotypes: All offspring are hh.
Offspring Phenotypes: All offspring are unaffected (normal heart development).
Explanation: Since the condition is caused by a dominant allele (H), any cat without the condition must have the genotype hh. Both parents (6 and 7) are unaffected, so they must both be hh. When two homozygous recessive individuals cross, all of their offspring will also be homozygous recessive (hh) and thus unaffected.
(a) (iv) The probability is 0.
Explanation: As shown in the genetic diagram, all possible offspring from parents 6 and 7 will have the genotype hh and will not have hypertrophic myopathy. Therefore, the probability of having an offspring with the condition is zero. Since the question asks for the probability of an offspring that is both male and has the condition, and the condition probability is zero, the overall probability is also zero. The probability of being male is 0.5, but 0.5 multiplied by 0 is still 0.
(b) It is more difficult to remove harmful recessive alleles than harmful dominant alleles because recessive alleles can be “hidden” from selection in heterozygous individuals (carriers). A harmful dominant allele is always expressed in the phenotype, so individuals with it can be easily identified and prevented from breeding, thus removing the allele from the population. However, a harmful recessive allele is not expressed in heterozygous carriers (who have the genotype Hh but are phenotypically normal). These carriers can breed and pass the harmful recessive allele to their offspring without breeders knowing, making it very difficult to identify and eliminate all carriers from a breeding population.
▶️ Answer/Explanation
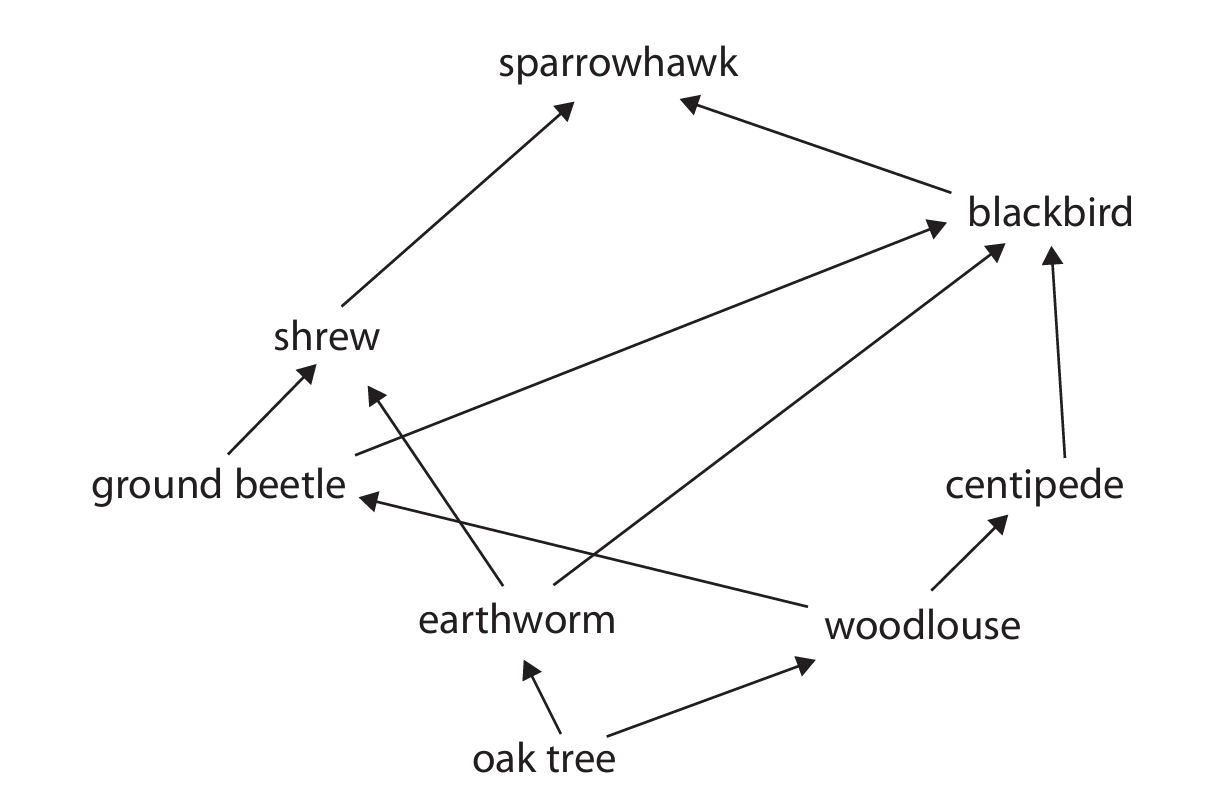
(a)(i) D oak tree
Explanation: Producers are organisms that can make their own food through photosynthesis. In this food web, the oak tree is the only organism that produces its own food using sunlight, making it the producer. The other options (blackbird, centipede, and earthworm) are all consumers that rely on eating other organisms for energy.
(a)(ii) A blackbird
Explanation: A secondary consumer eats primary consumers, while a tertiary consumer eats secondary consumers. The blackbird acts as both because it eats primary consumers like earthworms (making it a secondary consumer) and may also eat other secondary consumers like ground beetles (making it a tertiary consumer).
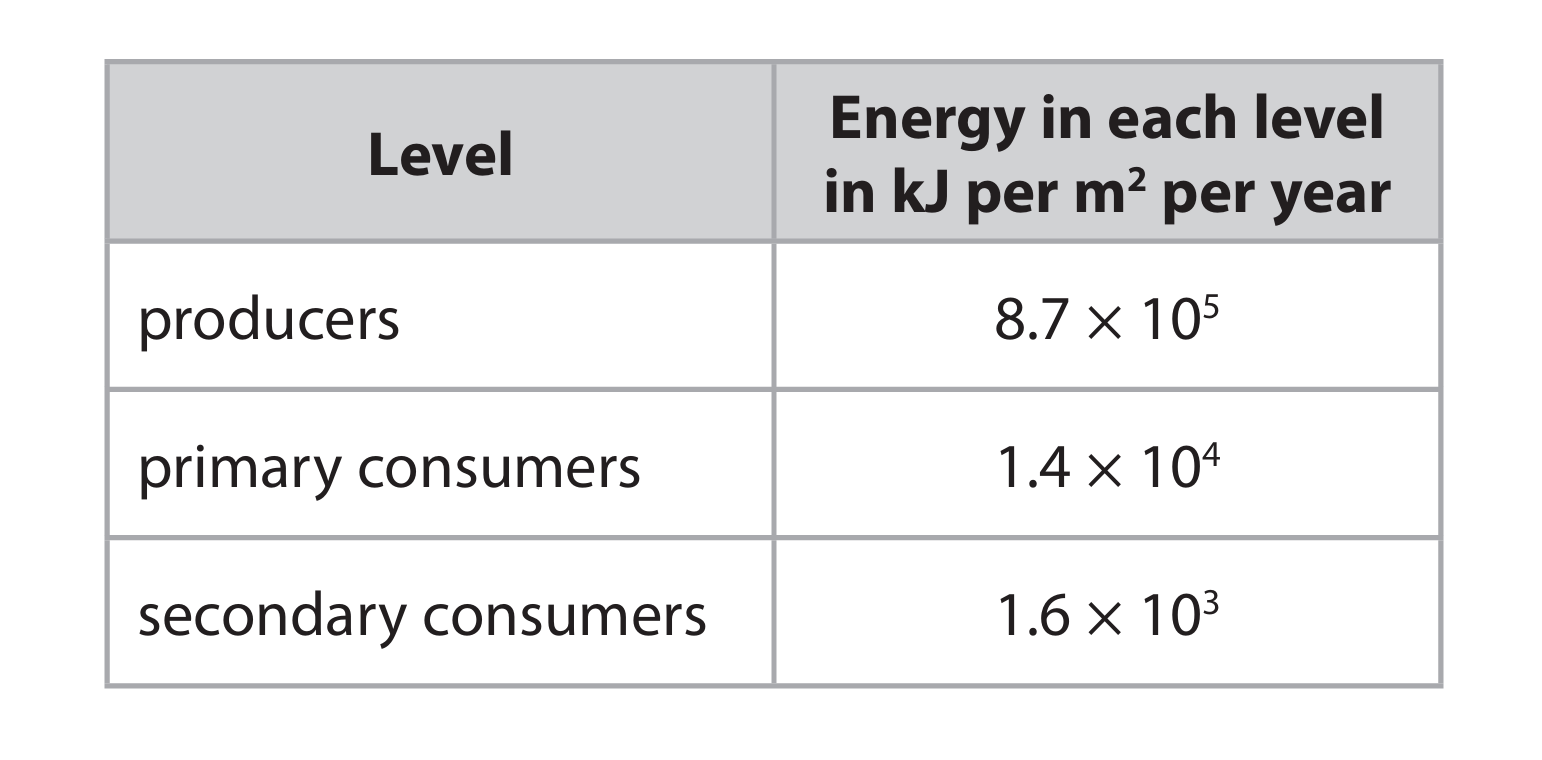
(b)(i)
Explanation: Plants cannot absorb all the light energy that reaches them because some light is reflected off their surfaces, particularly light of certain wavelengths that chlorophyll cannot absorb efficiently. Additionally, some light falls on non-photosynthetic parts of the plant like flowers or stems, or may not hit chloroplasts directly, reducing the overall energy absorption efficiency.
(b)(ii)
Explanation: To determine the efficiency of energy transfer, we calculate the percentage of energy transferred between trophic levels:
Producer to primary consumer: \( \frac{1.4 \times 10^4}{8.7 \times 10^5} \times 100 = 1.61\% \)
Primary to secondary consumer: \( \frac{1.6 \times 10^3}{1.4 \times 10^4} \times 100 = 11.43\% \)
The energy transfer between primary and secondary consumers (11.43%) is significantly more efficient than between producers and primary consumers (1.61%). Therefore, the student’s statement is incorrect.
(c)(i)
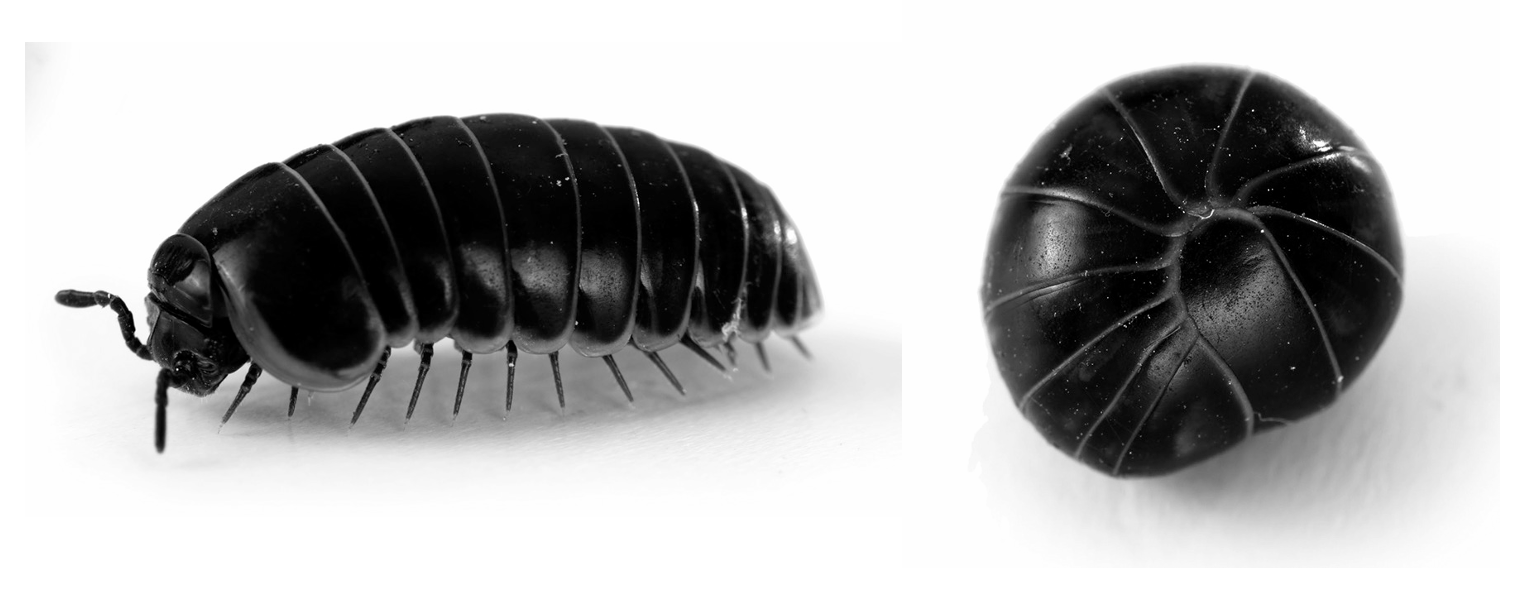
Explanation: A reflex response is an automatic, involuntary reaction to a stimulus that does not require conscious thought or involvement of the brain. It is a rapid, protective mechanism that helps organisms respond quickly to potential threats.
(c)(ii)
Explanation: This reflex response benefits the woodlouse by protecting it from predators. When curled into a ball, the woodlouse exposes only its hard exoskeleton, making it difficult for predators to attack or consume its vulnerable body parts.
(c)(iii)
Explanation: This reflex response could have evolved through natural selection via the following process:
1. Initially, genetic mutation created variation in the woodlouse population, with some individuals having a slight tendency to curl when threatened.
2. Woodlice that could curl into a ball had a survival advantage as they were better protected from predators.
3. These surviving woodlice reproduced and passed on the alleles responsible for this curling behavior to their offspring.
4. Over many generations, this reflex response became more common in the population as individuals with this trait continued to survive and reproduce more successfully than those without it.

▶️ Answer/Explanation
(a)(i) A gene is a section of DNA that codes for a specific protein or polypeptide.
Explanation: Genes are the basic units of heredity. They are located on chromosomes and contain the instructions needed to build and maintain an organism’s cells and pass genetic traits to offspring. Each gene provides the code for a specific protein, which in turn determines a particular characteristic.
(a)(ii) FF and Ff.
Explanation: Since the allele for normal feathers (F) is dominant, a chicken with normal feathers can have two possible genotypes. It can be homozygous dominant (FF) or heterozygous (Ff). In both cases, the dominant F allele will mask the effect of the recessive f allele, resulting in the normal feather phenotype.
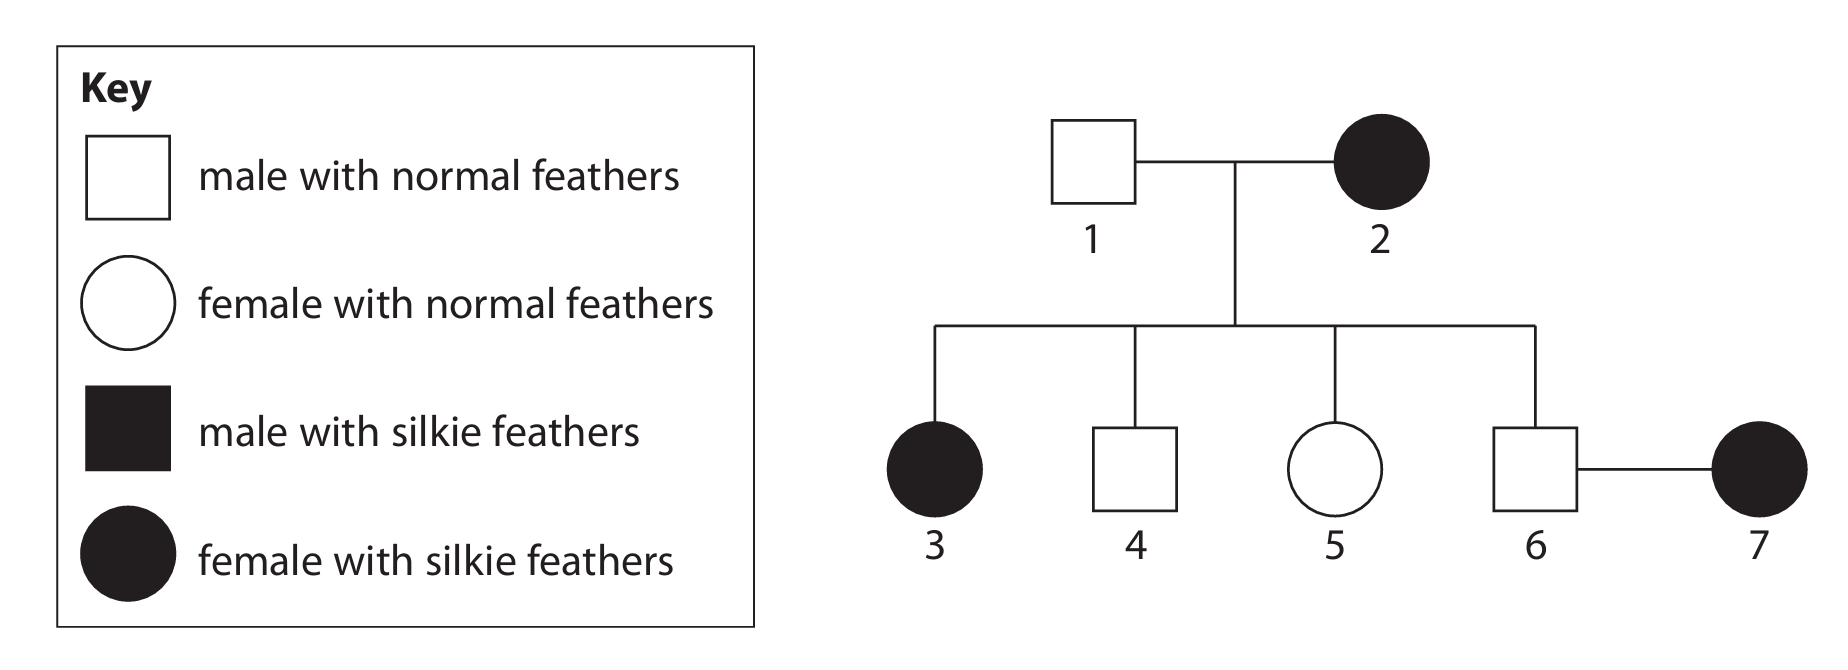
(b)(i) C (4)
Explanation: To be heterozygous means to have two different alleles for a gene (Ff). Looking at the pedigree:
- Individuals with silkie feathers must be homozygous recessive (ff). So individuals 2, 3, and 7 are ff and therefore not heterozygous.
- Individuals with normal feathers can be FF or Ff. To determine which are heterozygous, we look at their offspring. If two normal-feathered parents produce a silkie-feathered offspring (ff), both parents must be carriers of the recessive allele, meaning they are heterozygous (Ff).
- Individuals 1 and 4 are normal and produced silkie offspring (individual 3), so they must be Ff.
- Individual 5 is normal and produced a silkie offspring (individual 7), so it must be Ff.
- Individual 6 is normal and its mate (individual 7) is silkie (ff). All their offspring are normal, which means individual 6 must be homozygous dominant (FF) to always pass on a dominant F allele. Wait, let’s check the question for part (b)(ii): It asks for the probability of silkie offspring from individuals 6 and 7. If individual 6 were FF, the probability would be 0%. The mark scheme says the parental genotypes are Ff and ff, so individual 6 must be Ff. Therefore, the heterozygous individuals are 1, 4, 5, and 6. That makes 4 heterozygous chickens.
(b)(ii)
Genetic Diagram:
Parental Phenotypes: Normal Feathers x Silkie Feathers
Parental Genotypes: Ff x ff
Gametes: F, f and f, f
| F | f | |
| f | Ff | ff |
| f | Ff | ff |
Offspring Genotypes: 50% Ff, 50% ff
Offspring Phenotypes: 50% Normal feathers, 50% Silkie feathers
Probability of silkie feathers = ½ or 50%.
Explanation: The cross is between a heterozygous normal-feathered chicken (Ff) and a homozygous recessive silkie-feathered chicken (ff). The Punnett square shows that half of the possible offspring genotypes are Ff (normal feathers) and half are ff (silkie feathers). Therefore, the probability of an offspring having silkie feathers is 1 out of 2, or 50%.
(b)(iii) Feather type is controlled by a single gene (monogenic inheritance), resulting in discrete categories (normal or silkie). Height, however, is a continuous variation influenced by multiple genes (polygenic inheritance) and can also be affected by environmental factors like nutrition.
Explanation: Feather type is an example of discontinuous variation. It’s controlled by one gene with two clear-cut alleles, leading to distinct phenotypes with no intermediates. Height, on the other hand, is an example of continuous variation. It is a quantitative trait influenced by the combined effects of many different genes (polygenic), where each gene adds a small amount to the phenotype. Additionally, environmental factors such as diet, overall health, and access to food during development can significantly impact a chicken’s final height. The interaction of numerous genes and environmental influences creates a wide spectrum of possible heights, unlike the simple either/or outcome for feather type.
▶️ Answer/Explanation
(a)(i) Nucleus (present)
Explanation: Human red blood cells are unique among mammalian cells in that they lose their nucleus during development, a process called enucleation. This creates more space for hemoglobin, the oxygen-carrying protein. In contrast, fish red blood cells retain their nucleus throughout their lifespan, which takes up valuable space that could otherwise be used for oxygen transport.
(a)(ii)
Explanation: Fish red blood cells transport oxygen less efficiently due to two main structural differences. First, their spherical shape gives them a lower surface area to volume ratio compared to the biconcave disc shape of human red blood cells. A larger surface area allows for faster diffusion of oxygen into and out of the cell. Second, the presence of a nucleus in fish red blood cells reduces the available volume inside the cell for hemoglobin. With less hemoglobin, each fish red blood cell can carry less oxygen than a human red blood cell, making the transport process less efficient overall.
(b)
Explanation: Llamas evolved their efficient oxygen transport through the process of natural selection. Initially, there would have been genetic variation in the llama population regarding hemoglobin or red blood cell characteristics. Some individuals may have had mutations that resulted in hemoglobin with a higher affinity for oxygen or red blood cells that could carry more oxygen. At high altitudes where oxygen is scarce, these individuals with better oxygen-carrying capacity would have had a survival advantage. They would be more likely to survive, reproduce, and pass on these advantageous genes to their offspring. Over many generations, this natural selection process led to the entire llama population developing red blood cells that can absorb more oxygen, making them well-adapted to high-altitude environments.
(c)
Explanation: Phagocytes play a crucial role in the body’s immune defense system as part of the non-specific immune response. Their primary function is to engulf and destroy pathogens such as bacteria, viruses, and other foreign particles that enter the body. When phagocytes encounter these invaders, they extend their cell membrane around them, a process called phagocytosis, effectively “eating” the pathogen. Once inside the phagocyte, the pathogen is contained within a vesicle called a phagosome. This vesicle then fuses with lysosomes containing powerful digestive enzymes, which break down and destroy the captured pathogen, thus preventing infection and disease.
▶️ Answer/Explanation
(a)(i)
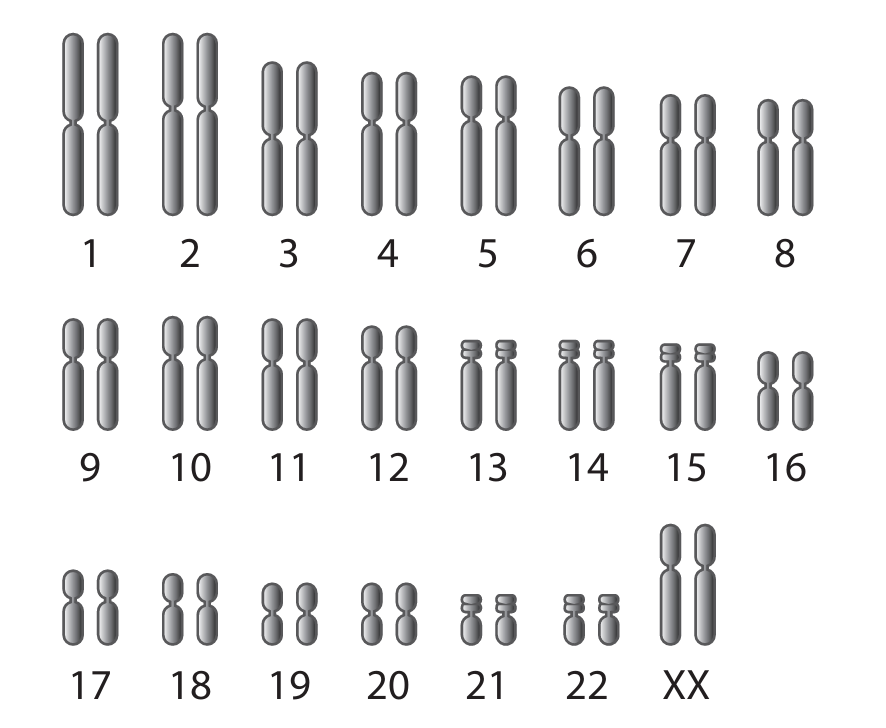
Answer: The person is male because the karyotype shows one X and one Y chromosome (XY). Females would have two X chromosomes (XX).
Explanation: In humans, sex is determined by the sex chromosomes. Females are homogametic (XX) while males are heterogametic (XY). When examining a karyotype, we look at the 23rd pair of chromosomes. If it shows two X chromosomes, the individual is female. If it shows one X and one Y chromosome, as in Diagram 1, the individual is male. The Y chromosome carries the SRY gene which triggers male development.
(a)(ii)
Answer: Diagram 1 shows a diploid cell with 46 chromosomes (23 pairs), while a haploid cell would have only 23 chromosomes (one of each pair).
Explanation: The terms diploid and haploid refer to the number of sets of chromosomes in a cell. Diploid cells (2n) contain two complete sets of chromosomes, one from each parent. In humans, this means 46 chromosomes arranged in 23 pairs, exactly as shown in Diagram 1. These are found in most body cells (somatic cells). Haploid cells (n) contain only one set of chromosomes – just 23 chromosomes with no pairs. These are the gametes (sperm and egg cells) produced through meiosis for sexual reproduction.
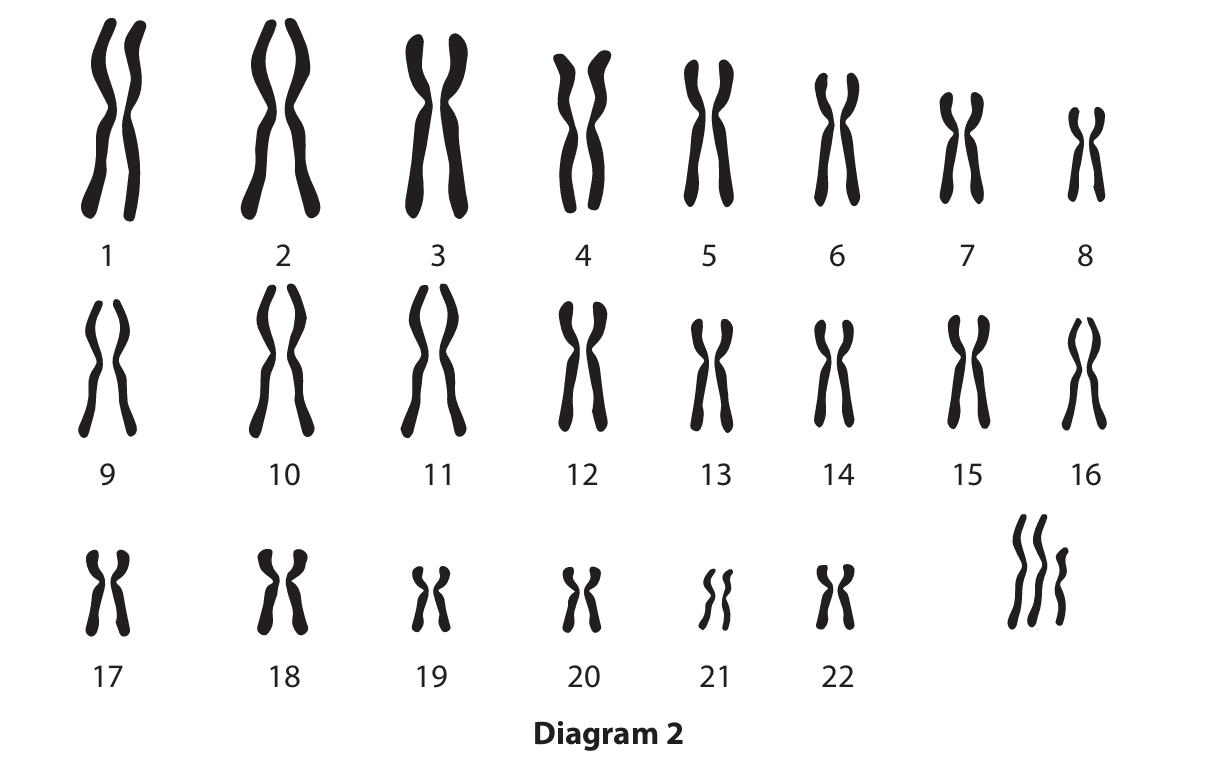
(b)(i)
Answer: Diagram 2 (Klinefelter syndrome) has 47 chromosomes instead of 46, with an extra X chromosome (XXY instead of XY).
Explanation: The most obvious difference is the total chromosome count. A normal male karyotype (Diagram 1) has 46 chromosomes. The Klinefelter syndrome karyotype (Diagram 2) has 47 chromosomes. Looking specifically at the sex chromosomes, Diagram 1 shows the normal XY pattern, while Diagram 2 shows XXY – meaning there are two X chromosomes and one Y chromosome. This extra X chromosome causes Klinefelter syndrome.
(b)(ii)
Answer: It was likely caused by nondisjunction during meiosis, where the sex chromosomes failed to separate properly during gamete formation.
Explanation: This abnormal chromosome number typically results from a process called nondisjunction. During meiosis (the cell division that produces gametes), chromosomes normally separate so that each gamete gets one of each chromosome pair. If nondisjunction occurs, the chromosomes don’t separate properly. In this case, the extra X chromosome in XXY could come from either parent – if an egg cell with two X chromosomes is fertilized by a normal Y sperm, or if a normal X egg is fertilized by a sperm carrying both X and Y chromosomes. This error in chromosome separation creates gametes with abnormal chromosome numbers.
(b)(iii)
Answer: 49,000 males
Explanation: Let’s work through this step by step:
First, calculate the total male population: 49% of 66 million = 0.49 × 66,000,000 = 32,340,000 males
Then, calculate how many have Klinefelter syndrome: 1 in every 660 males means we divide the total male population by 660
32,340,000 ÷ 660 = 49,000 males with Klinefelter syndrome
(b)(iv)
Answer: Older eggs are more likely to have chromosomal abnormalities due to increased chance of nondisjunction.
Explanation: As females age, their eggs also age since women are born with all the eggs they’ll ever have. Older eggs are more susceptible to errors during meiosis, particularly nondisjunction where chromosomes fail to separate properly. The mechanisms that ensure proper chromosome separation become less reliable over time. This is why various chromosomal conditions, including Klinefelter syndrome, Down syndrome, and others, become more common with advanced maternal age. The exact reasons are complex but involve deterioration of the protein structures that guide chromosome separation during cell division.
▶️ Answer/Explanation
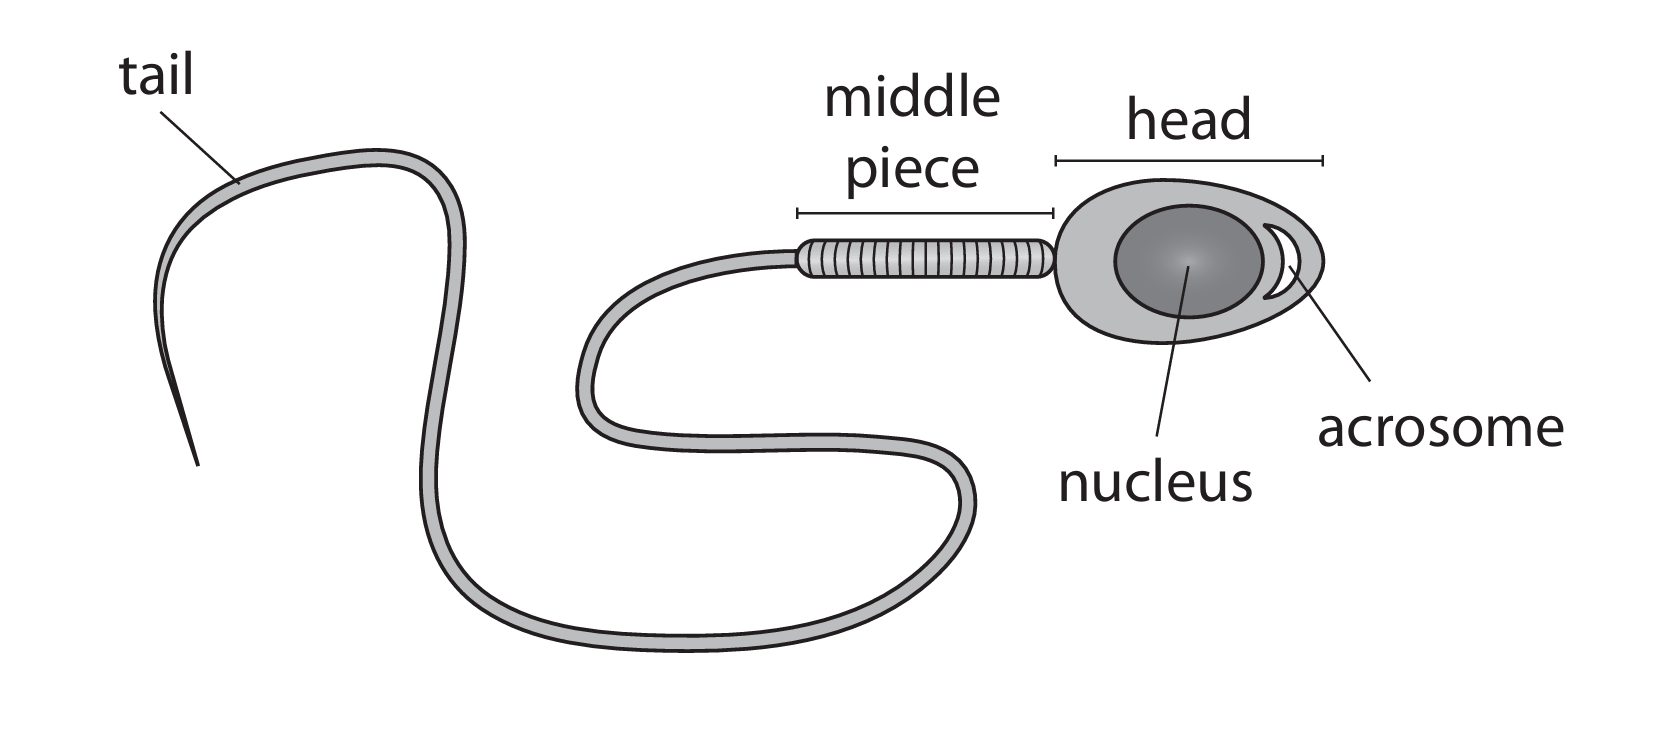
(a) B 1
Explanation: Human sperm cells are gametes produced by meiosis. They contain half the number of chromosomes (23) compared to body cells. Sex chromosomes in sperm can be either X or Y. The maximum number of X chromosomes a sperm can carry is therefore 1. If a sperm carries an X chromosome, the resulting offspring will be female (XX); if it carries a Y chromosome, the offspring will be male (XY). A sperm cannot have 0, 2, or 23 X chromosomes.
(b) The mitochondria in the middle piece provide the energy (in the form of ATP) required for the movement of the tail, enabling the sperm to swim towards the egg.
Explanation: The tail of the sperm is a flagellum whose movement is essential for propulsion through the female reproductive tract. This movement is an active process that requires a significant amount of energy. Mitochondria are the organelles responsible for aerobic respiration, where they break down energy-rich molecules to produce ATP (adenosine triphosphate). The ATP generated then fuels the motor proteins in the tail, allowing it to beat and propel the sperm forward in its journey to reach and fertilize the egg.
(c) The acrosome digests or breaks down the outer layers of the egg cell (the zona pellucida), allowing the sperm nucleus to penetrate and fuse with the egg nucleus for fertilization.
Explanation: The egg is surrounded by protective layers, including a thick glycoprotein layer called the zona pellucida. The acrosome, located at the tip of the sperm head, is a specialized cap-like structure filled with powerful digestive enzymes (e.g., hyaluronidase and acrosin). When the sperm reaches the egg, the acrosome releases these enzymes in a process known as the acrosome reaction. These enzymes chemically break down and dissolve a path through the zona pellucida, enabling the sperm to reach and fuse with the egg’s cell membrane, leading to fertilization.
(d) The sperm enters through the vagina, travels through the cervix into the uterus, and then moves into the oviduct (Fallopian tube) where fertilization occurs.
Explanation: The journey of the sperm is a long and challenging one. It begins when sperm are deposited in the vagina during sexual intercourse. From there, they must swim through the cervix (the opening to the uterus) and into the womb or uterus. The final and most specific part of the journey involves entering the correct oviduct (Fallopian tube). Fertilization typically takes place in the upper third of the oviduct. Only a tiny fraction of the millions of sperm released actually complete this entire route to reach the egg.
▶️ Answer/Explanation
(a)

Explanation:
Eutrophication is the process where water bodies become enriched with nutrients (like fertilisers), leading to excessive growth of algae and other aquatic plants. This depletes oxygen in the water, harming other aquatic life.
Insect pollination occurs when insects transfer pollen from the anther of one flower to the stigma of another, facilitating fertilization in plants.
Active transport is the movement of ions or molecules across a cell membrane from a region of lower concentration to a region of higher concentration, requiring energy in the form of ATP.
(b)(i)
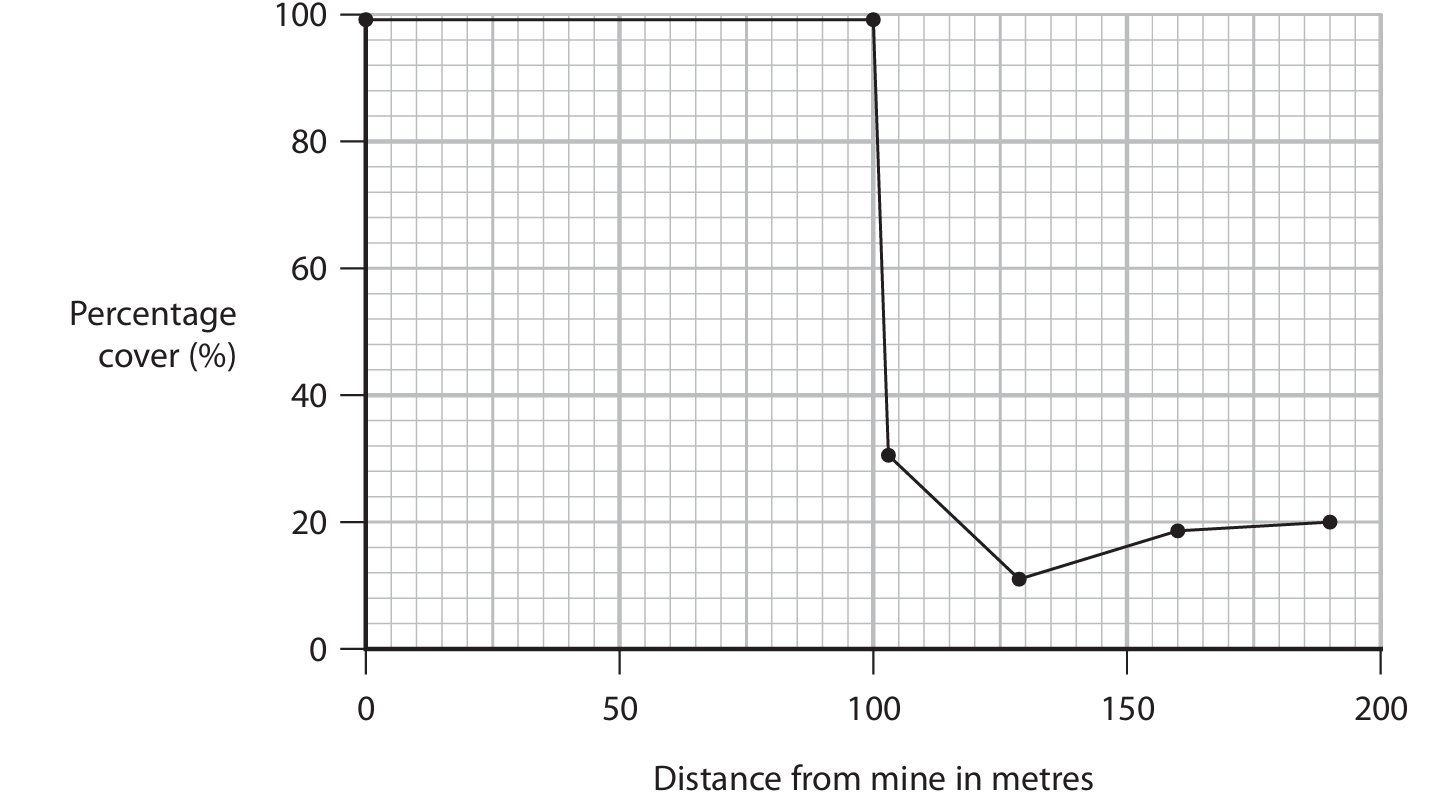
Explanation: Natural selection could explain the pattern seen in the graph between 0-100 meters from the mine through the following mechanism:
Initially, the high zinc concentration near the mine would be toxic to most individual grass plants. However, within the population, there might be genetic variation due to random mutations. A few individual grass plants might possess alleles that make them resistant to zinc toxicity. These resistant individuals would be more likely to survive and reproduce in the zinc-contaminated soil near the mine. They would pass these advantageous resistant alleles to their offspring. Over generations, the proportion of zinc-resistant grass plants in the population near the mine would increase. This results in a population that is better adapted to the high zinc levels, allowing the grass species to have a higher percentage cover closer to the mine (0-100m) than might be initially expected, as seen in the graph. The process involves variation, selection pressure (zinc), survival of the fittest (resistant plants), and inheritance of the resistant trait.
(b)(ii)
Explanation: To compare the population size of the grass species at 50m and 100m from the mine, the scientist could use a systematic sampling method like a belt transect or random quadrat sampling along a line.
First, a measuring tape would be laid out running perpendicular from the mine edge, passing through both the 50m and 100m points. For a belt transect, quadrats (e.g., 1m x 1m squares) would be placed contiguously along the tape between, for example, 45m-55m and 95m-105m to cover each area. Alternatively, for random sampling, multiple random coordinates within a 10m band centered on 50m and another band centered on 100m could be generated, and a quadrat placed at each coordinate.
Within each quadrat, the scientist would estimate the percentage cover of the specific grass species. This is a measure of how much of the ground within the quadrat is occupied by the vertical projection of its leaves and stems. This process would be repeated multiple times (e.g., 10-20 quadrats) at each distance to obtain a representative sample and calculate a mean percentage cover. The mean percentage cover at 50m can then be statistically compared to the mean percentage cover at 100m to determine if there is a significant difference in the population size of the grass species between the two distances.

▶️ Answer/Explanation
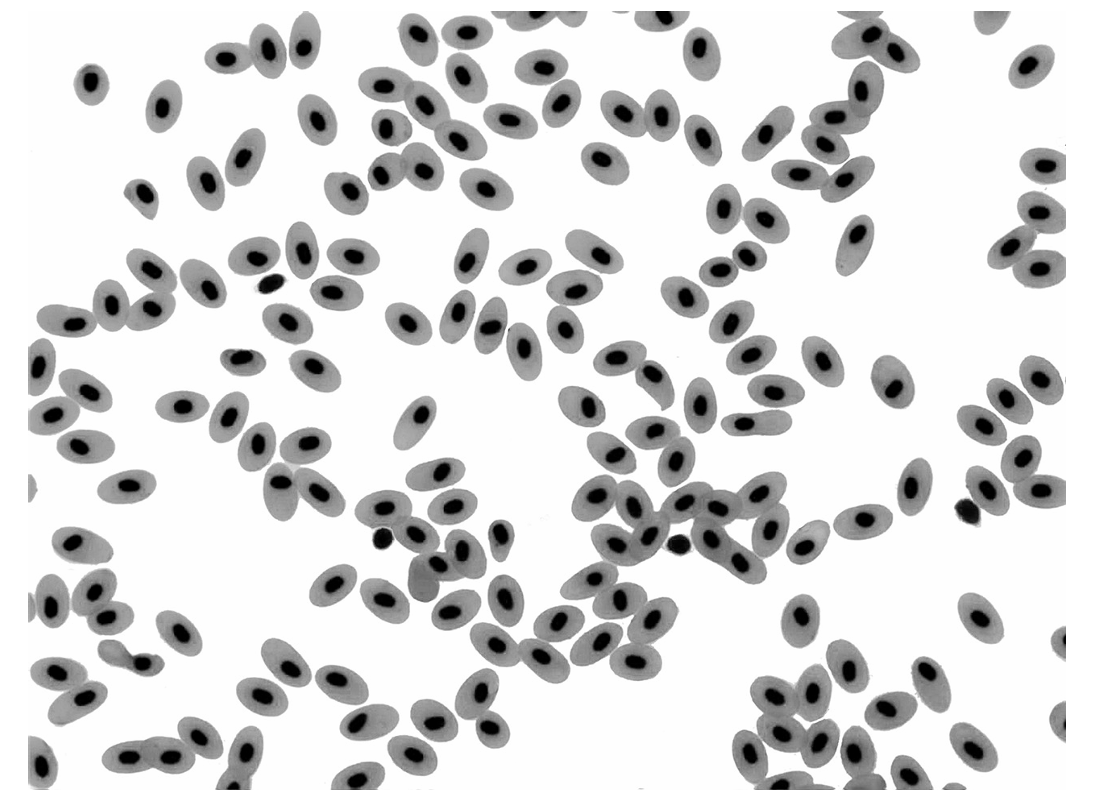
(a)(i) Sickle shaped red blood cells stick to each other / caught / trapped in walls of blood vessels.
Explanation: In sickle cell anaemia, the red blood cells become rigid and crescent-shaped instead of being flexible and biconcave. These abnormally shaped cells are less flexible and can get stuck to each other or to the walls of small blood vessels. This creates blockages that restrict blood flow to various parts of the body, leading to pain and potential tissue damage.
(a)(ii) An explanation that includes:
- Cold temperatures reduce blood flow / cause more sickling
- Less oxygen at high altitude
- Less respiration / more anaerobic respiration
- More lactic acid
- Less energy / ATP
Explanation: Cold temperatures cause blood vessels to constrict, reducing blood flow and potentially triggering more red blood cells to sickle. At high altitudes, the lower oxygen concentration means less oxygen is available to tissues. This reduced oxygen supply leads to less efficient aerobic respiration in cells, forcing them to rely more on anaerobic respiration which produces lactic acid. The combination of reduced energy production (ATP) from less efficient respiration and the buildup of lactic acid exacerbates symptoms like tiredness and joint pain.
(b)(i) Only expressed when homozygous / two copies / no dominant allele present / not expressed in heterozygote.
Explanation: A recessive allele is one whose effect is masked or “hidden” when a dominant allele is present. For a recessive trait to be physically expressed in an individual, that person must inherit two copies of the recessive allele (one from each parent), making them homozygous recessive. If they have one dominant and one recessive allele (heterozygous), the dominant allele will determine the trait, and the recessive allele will not be visible but can be passed to offspring.
(b)(ii) 0.375 or 3/8 or 37.5%
Explanation: First, we need to find the probability of the child not having sickle cell anaemia. Since both parents are heterozygous (HbA Hbs), we can use a Punnett square:
Parental genotypes: HbA Hbs × HbA Hbs
Possible offspring genotypes:
- HbA HbA (normal) – 1/4 probability
- HbA Hbs (carrier, no disease) – 2/4 probability
- Hbs Hbs (sickle cell anaemia) – 1/4 probability
Probability of not having sickle cell anaemia = 1/4 + 2/4 = 3/4
Probability of being female = 1/2
Since these are independent events, we multiply the probabilities:
3/4 × 1/2 = 3/8 = 0.375 = 37.5%
(c) D protoctist
Explanation: Malaria is caused by parasites belonging to the genus Plasmodium, which are single-celled eukaryotic organisms classified as protoctists (or protists). These are not bacteria (which are prokaryotic), fungi, or plants. The Plasmodium parasite is transmitted to humans through the bite of infected Anopheles mosquitoes.
(d) B haemoglobin
Explanation: Haemoglobin is the iron-containing protein pigment found in red blood cells that gives them their characteristic red color. Its crucial function is to bind with oxygen in the lungs and transport it to tissues throughout the body, while also helping to carry some carbon dioxide back to the lungs. Chlorophyll is found in plants, iron is a mineral component of haemoglobin but not the pigment itself, and magnesium is not the primary pigment in red blood cells.
(e) Two differences:
- Red blood cells are smaller than white blood cells
- Red blood cells have no nucleus while white blood cells do
- Red blood cells are biconcave in shape while white blood cells are spherical or irregular
Explanation: Red blood cells (erythrocytes) and white blood cells (leukocytes) have distinct structural differences that relate to their different functions. Red blood cells are smaller and lack a nucleus, which allows more space for haemoglobin and makes them more flexible for moving through narrow capillaries. Their biconcave disc shape provides a large surface area for efficient gas exchange. In contrast, white blood cells are generally larger, have a nucleus (essential for their immune functions), and can change shape to engulf pathogens or move through tissues.
▶️ Answer/Explanation
(a)(i) An explanation that makes reference to three of the following points:
• oxygen
• glucose
• respiration
• energy / ATP
Example answer: The blood contains glucose and oxygen. These are used by the fetus’s cells in respiration to release energy in the form of ATP. This ATP provides the energy required for active transport processes to occur.
(a)(ii) An explanation that makes reference to two of the following points:
• antibodies (from mother)
• (bind to) antigens
• to kill bacteria / pathogen / virus eq
Example answer: Antibodies from the mother’s blood cross the placenta. These antibodies bind to antigens on pathogens, marking them for destruction or neutralizing them, which helps protect the fetus from infection.
(b) An answer that makes reference to two of the following points:
• fetus is female / a girl
• cells contain 46 chromosomes / 23 pairs / has a diploid number / has two sets of chromosomes / normal number of chromosomes / eq
• chromosomes have different lengths / sizes / shapes
Example answer: 1. The fetus is female because the sex chromosomes are XX. 2. The cell has the normal diploid number of 46 chromosomes (23 pairs).
(c)(i) An answer that makes reference to four of the following points:
• calcium for bone / teeth growth / bone / teeth development / prevent rickets
• protein to grow / for enzymes / antibodies / eq
• iron for haemoglobin / red blood cells / prevent anaemia
• vitamin D for bone growth / bone development / calcium absorption / strong bones
• more energy as baby is heavy / mother becomes heavy / more energy for fetal development / to carry baby / eq
Example answer: Extra calcium and vitamin D are required for the development of the fetus’s bones and teeth. Additional iron is needed to make haemoglobin for the increased blood volume and to prevent anaemia. More protein is required for the growth of fetal tissues and the production of enzymes and antibodies. Increased energy is needed as the mother’s body works harder and carries extra weight.
(c)(ii)
• \(9.0 \text{ mg} = 50\%\) more
• \(100\% = 9.0 \times 2 = 18 \text{ mg}\)
• Total needed \(= 18 + 9 = 27 \text{ mg}\)
Award full marks for correct numerical answer without working.
Final Answer: \(27 \text{ mg}\)
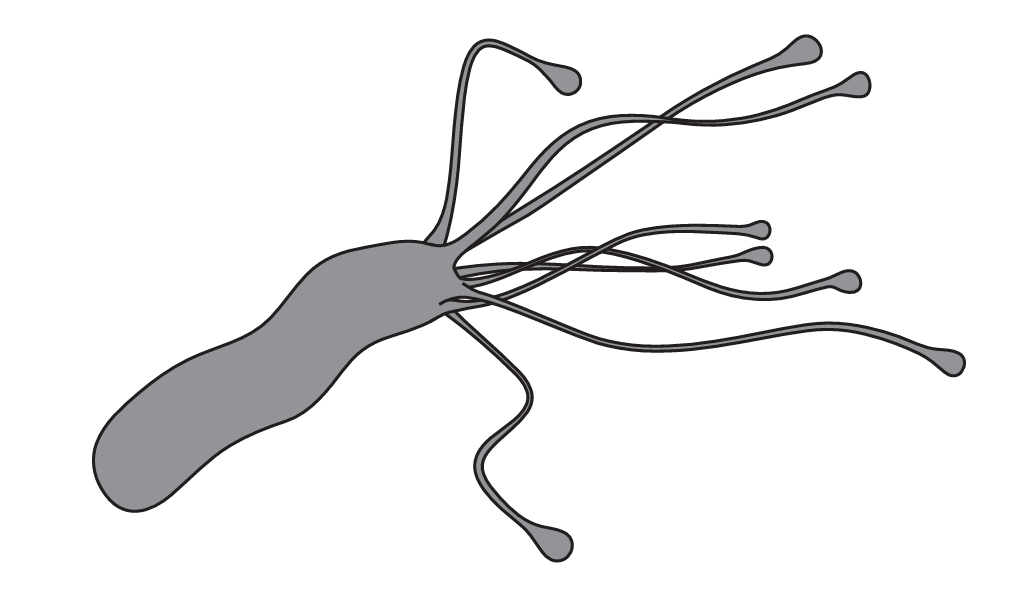
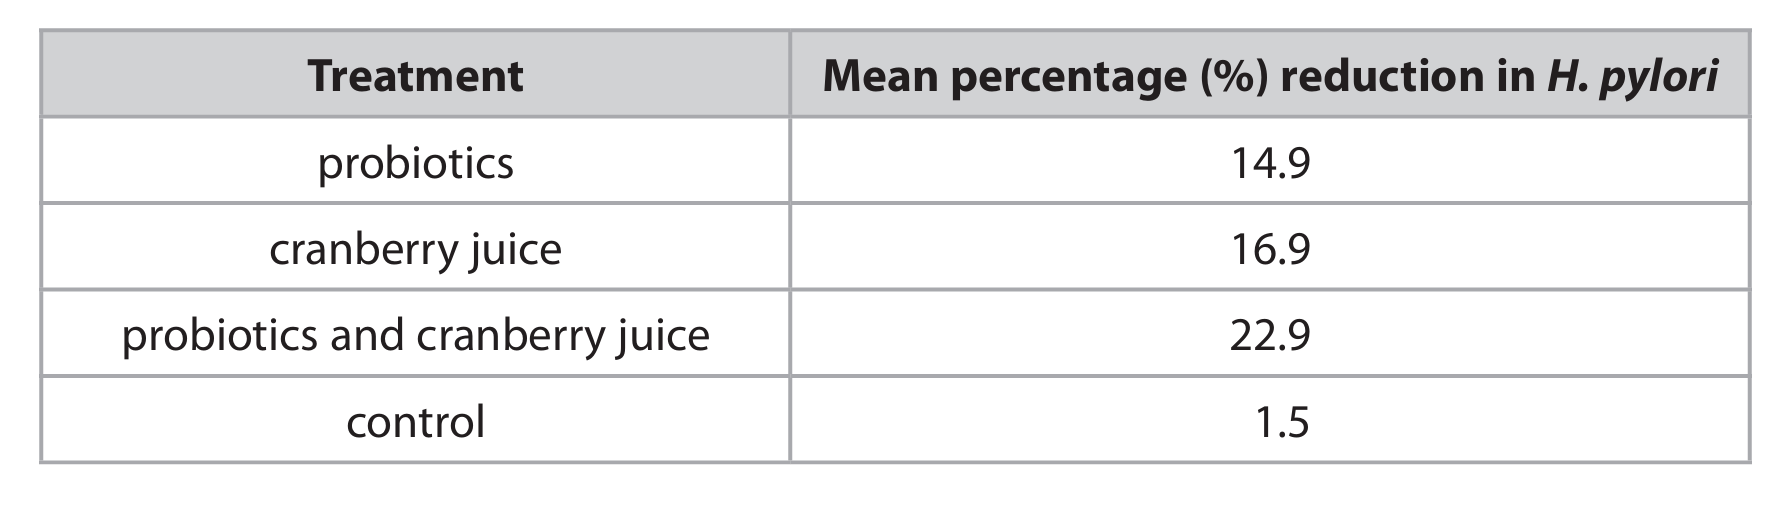
▶️ Answer/Explanation
(a)(i) C cytoplasm
Explanation: Bacteria are prokaryotic cells, which means they lack a true nucleus (option D) and membrane-bound organelles. Their genetic material is found in the cytoplasm. Cellulose (option A) is a structural component of plant cell walls, and chitin (option B) is found in the cell walls of fungi and the exoskeletons of arthropods. Bacterial cell walls are typically made of peptidoglycan, not cellulose or chitin. Therefore, the only component from the list that is definitively found in a bacterial cell is the cytoplasm.
(a)(ii) C 7
Explanation: The stomach is highly acidic, with a pH typically around 1.5 to 3.5 due to hydrochloric acid. Neutralization means bringing the pH to a neutral level. On the pH scale, 7 is neutral. Urease produced by H. pylori breaks down urea to produce ammonia, which is alkaline, thereby neutralizing the stomach acid in its immediate vicinity and raising the pH towards 7. Options A (1) and B (2) are acidic, and option D (12) is strongly alkaline, none of which represent a neutral pH.
(a)(iii)
Explanation: According to the theory of evolution by natural selection, the evolution of urease production in H. pylori can be explained step-by-step. Initially, within a population of ancestral H. pylori bacteria, there would have been genetic variation. Some of this variation arose from random mutations in the bacterial DNA. One such mutation might have resulted in a bacterium that could produce the enzyme urease. This urease enzyme conferred a significant advantage in the harsh, acidic environment of the stomach. By neutralizing the acid around it, this bacterium was more likely to survive and live longer than its peers that lacked the mutation. With increased survival, this bacterium had a greater chance to reproduce asexually (through binary fission) and pass on the gene for urease production to its offspring. Over many generations, the allele for urease production became more and more common in the population because individuals possessing it were consistently selected for by the environmental pressure of stomach acidity. Eventually, the entire population of H. pylori evolved to produce urease.
(b)
Two conclusions:
- All three treatments (probiotics, cranberry juice, and their combination) cause a greater reduction in H. pylori compared to the control, meaning they are all more effective than no treatment.
- The combination of probiotics and cranberry juice results in a greater reduction of H. pylori than either treatment used alone, suggesting a synergistic effect where the two work better together.
Explanation: By analyzing the data in the table, we can draw clear comparisons. The control group, which likely received a placebo or no treatment, showed only a 1.5% reduction, establishing a baseline. The probiotics alone led to a 14.9% reduction, and cranberry juice alone led to a 16.9% reduction. Both are substantially higher than the control, indicating they are effective treatments. However, when used together, the reduction jumps to 22.9%, which is higher than the sum of their individual effects if they were simply additive. This indicates that the two treatments may work well in combination, potentially enhancing each other’s effectiveness against H. pylori.

▶️ Answer/Explanation
(a)(i) D testis
Explanation: Meiosis is the type of cell division that produces gametes (sex cells). In human males, meiosis occurs specifically in the testes to produce sperm cells. The kidney, penis, and skin do not undergo meiosis – kidney and skin cells undergo mitosis for growth and repair, while the penis contains various tissues but not sites of gamete production.
(a)(ii) C root tip
Explanation: Root tips are commonly used to demonstrate mitosis in flowering plants because they contain meristematic tissue where active cell division occurs for root growth. The anther is where meiosis occurs to produce pollen grains, the cotyledon is a seed leaf that stores food, and xylem is vascular tissue for water transport that doesn’t undergo active division.
(b) Completed Table:
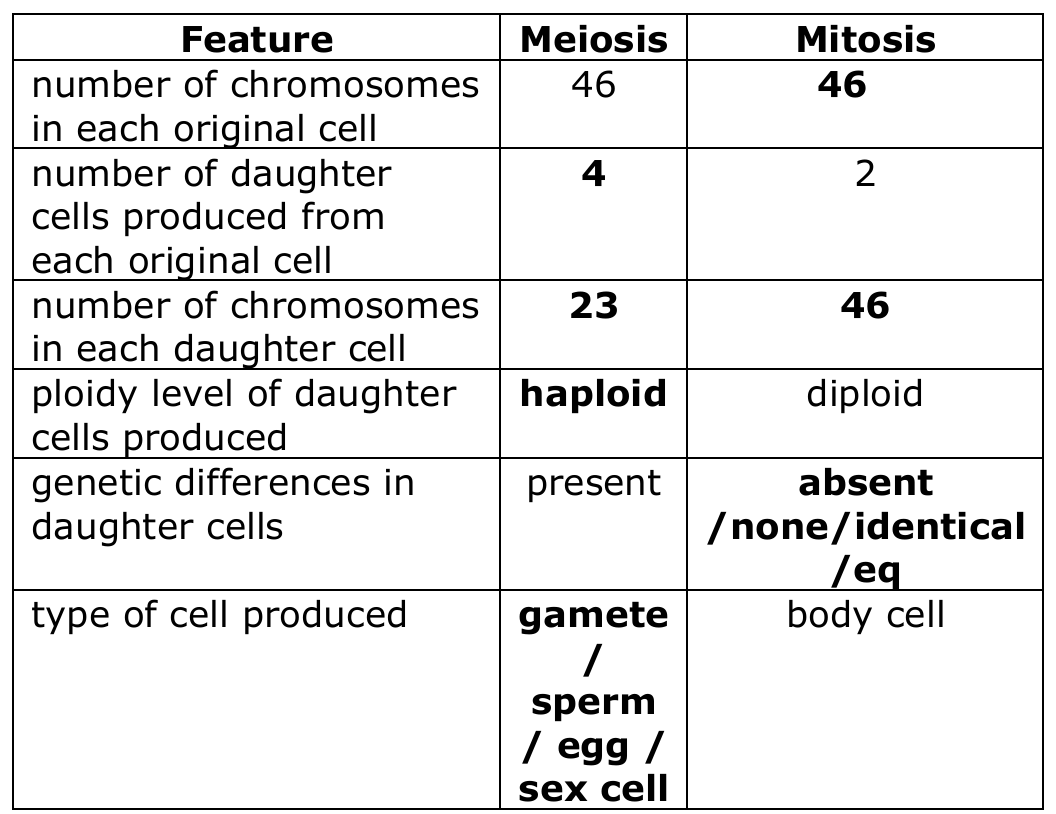
Explanation: Meiosis reduces the chromosome number by half (from diploid 46 to haploid 23) and produces four genetically unique daughter cells (gametes) due to crossing over and independent assortment. Mitosis maintains the chromosome number (diploid 46) and produces two genetically identical daughter cells for growth and repair.
(c)(i) Other causes of variation in offspring include:
Explanation: Beyond cell division mechanisms, variation arises from random mating where individuals choose partners without specific genetic preferences, creating new allele combinations. Random fertilization means any sperm can fertilize any egg, further mixing genetic material. Environmental factors like nutrition, temperature, and exposure to chemicals can cause phenotypic variation even with identical genotypes. Additionally, mutations – spontaneous changes in DNA sequence – introduce entirely new genetic variations that can be passed to offspring.
(c)(ii) Advantages of using homozygous rats:
Explanation: Using rats that are homozygous for many genes provides little to no genetic variation within the test population, meaning all individuals have the same genotype and alleles. This eliminates genotype-environment interactions and ensures that all rats respond to drugs in the same way, making experimental results more consistent and reliable. This genetic uniformity helps scientists isolate the specific effects of the drug treatment without confounding variables from genetic differences.
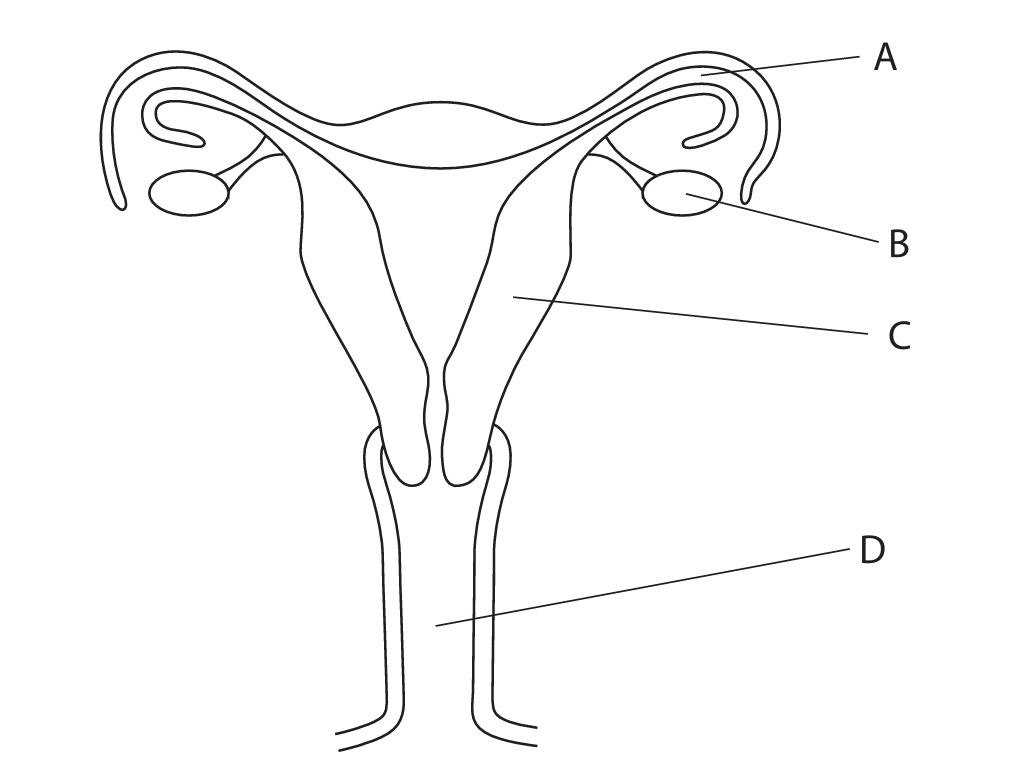
▶️ Answer/Explanation
(a) Asexual reproduction differs from sexual reproduction in several key ways. In asexual reproduction, there is no formation of gametes and no meiosis occurs. This means there is no fusion of gametes or formation of a zygote. As a result, the offspring produced are genetically identical to the parent and to each other; they are clones with no genetic variation. Only one parent is involved in asexual reproduction.
Explanation: The main differences lie in the processes involved and the genetic outcome. Asexual reproduction is simpler and faster, producing identical offspring, while sexual reproduction involves the combination of genetic material from two parents, leading to genetic diversity.
(b)(i) A (the oviduct)
Explanation: Fertilisation, the fusion of sperm and egg, typically occurs in the oviduct (Fallopian tube). The other structures are not the site of this process.
(b)(ii) C (uterus / womb)
Explanation: After fertilisation, the embryo implants in the lining of the uterus, where it develops into a fetus. The other structures do not serve as the primary site for fetal development.
(b)(iii) Structure B is the ovary, which produces the hormones oestrogen and progesterone. Oestrogen is involved in the development and regulation of the female reproductive system. It thickens the lining of the uterus (endometrium) during the menstrual cycle and is also responsible for the development of secondary sexual characteristics, such as breast development. Progesterone’s main role is to maintain the thickened lining of the uterus, making it suitable for the implantation of a fertilised egg and for supporting a pregnancy. It also inhibits further ovulation during pregnancy.
Explanation: These hormones work together in a complex feedback system to regulate the menstrual cycle, prepare the body for pregnancy, and develop female physical characteristics.
(c)(i) Mean number of sperm = 200 million
Explanation: This is calculated by multiplying the mean semen volume by the mean sperm concentration for the 40-43 age group: \( 3.22 \, \text{cm}^3 \times 62.1 \, \text{million/cm}^3 = 199.962 \, \text{million} \), which rounds to 200 million.
(c)(ii) The mean number of sperm released is a better measure of fertility because it takes both semen volume and sperm concentration into account. A high semen volume with a very low sperm concentration could still result in a low total sperm count. Conversely, a high sperm concentration in a very small volume of semen would also lead to a low total count. Therefore, the total number of sperm released gives a more complete picture of the potential for fertilisation than either factor alone.
Explanation: Fertility is directly related to the total number of functional sperm available. Relying only on concentration or volume could be misleading, as both are needed to calculate the actual quantity of sperm ejaculated.
(c)(iii) Percentage decrease = 29.7%
Explanation: The calculation is done as follows: First, find the difference in mean sperm number between the two age groups: \( 202 – 142 = 60 \) million. Then, divide this difference by the original value (for the 37-39 age group): \( \frac{60}{202} = 0.297 \). Finally, multiply by 100 to get the percentage: \( 0.297 \times 100 = 29.7\% \). This shows a significant decrease in the average number of sperm released as men get older.


▶️ Answer/Explanation
(a)
| Individual | Genotype |
|---|---|
| P | Dd |
| Q | Dd |
| R | Dd |
| S | dd |
Explanation: The condition is caused by a recessive allele (d) because both parents (P and Q) are unaffected but have an affected child (S, genotype dd). This means both parents must be heterozygous carriers (Dd). Child R is unaffected, so their genotype must be Dd (as given). Child S is affected, so their genotype is dd.
(b) \( \frac{1}{8} \) / 0.125 / 12.5%
Explanation: To find the probability that the third child is female AND has the condition, we consider two independent events:
1. Probability of being female: This is \( \frac{1}{2} \) (assuming equal chance of male or female).
2. Probability of having the condition (genotype dd): Both parents are Dd. A Punnett square for Dd × Dd gives: 25% DD (unaffected), 50% Dd (unaffected carriers), 25% dd (affected). So, the probability of being affected is \( \frac{1}{4} \).
To find the combined probability, we multiply the probabilities of the two independent events: \( \frac{1}{2} \times \frac{1}{4} = \frac{1}{8} \).
So, the probability is \( \frac{1}{8} \), 0.125, or 12.5%.
(c)
Explanation: The graphs show distinct hormonal profiles for Child R and Child S, indicating their different sexes and the onset of puberty.
Child R: Shows a significant increase in testosterone concentration with age, while oestrogen levels remain low. This pattern is characteristic of male puberty. Testosterone promotes the development of male secondary sexual characteristics, such as increased muscle mass, deepening of the voice, growth of facial and body hair, and the production of sperm.
Child S: Shows a significant increase in oestrogen concentration with age, while testosterone levels remain low. This pattern is characteristic of female puberty. Oestrogen promotes the development of female secondary sexual characteristics, such as the development of breasts, widening of the hips, the onset of menstruation, and the distribution of body fat.
In summary, the differing hormone profiles drive the development of sex-specific physical characteristics during adolescence for each child.
▶️ Answer/Explanation
(a) Homeostasis
Explanation: Homeostasis is the biological term that describes the process by which organisms maintain a relatively stable internal environment despite changes in external conditions. This involves regulating various factors such as body temperature, blood glucose levels, and water balance through feedback mechanisms.
(b)
Explanation: The withdrawal reflex is an automatic, rapid response that protects the body from harm. When a finger touches a hot object, here’s how the reflex arc functions:
First, specialized heat receptors in the skin of the finger detect the damaging stimulus (the heat). These receptors generate an electrical impulse.
This impulse travels along a sensory neurone towards the spinal cord (part of the central nervous system). At the junction (synapse) between the sensory neurone and a relay neurone in the spinal cord, the impulse triggers the release of chemical messengers called neurotransmitters, which diffuse across the gap.
The relay neurone then passes the signal to a motor neurone. The impulse travels along the motor neurone to the effector, which in this case is the muscles in the arm and hand.
Finally, the muscles contract, pulling the hand away from the hot object. This entire process happens incredibly quickly, without involving the brain for conscious thought, which helps to minimize tissue damage.
(c)(i)
Explanation: Structure A represents a sweat gland. As a person enters a cold environment, the activity of the sweat glands is significantly reduced. This means less sweat is produced and released onto the skin’s surface. Since the evaporation of sweat is a primary method the body uses to lose heat, reducing sweat production helps to conserve body heat and prevent the body from cooling down too much in the cold.
(c)(ii)
Explanation: Structure B represents a blood vessel near the skin’s surface. In response to cold, these blood vessels undergo vasoconstriction. This means the smooth muscles in the vessel walls contract, causing the diameter of the blood vessels to narrow. As a result, less warm blood flows from the body’s core to the skin’s surface. This reduces the amount of heat lost from the blood to the external environment through radiation and convection. By diverting blood away from the skin, more heat is retained in the core of the body, which is essential for maintaining the temperature of vital organs.
(d)
Explanation: The reduction in body hair in modern humans compared to their ancestors is a classic example of evolution by natural selection. Initially, there would have been genetic variation within the ancestral population regarding the amount of body hair, caused by random mutations.
In the warm climates where early humans likely lived and became more active (e.g., through persistence hunting), having less body hair would have been advantageous. It would have allowed for more efficient cooling through sweating, preventing overheating during physical exertion. Individuals with less body hair were therefore more likely to survive the heat and have the energy to hunt and gather food.
These individuals, being better adapted to their environment, had a higher chance of surviving to reproductive age and producing offspring. They passed on the alleles (genes) for reduced body hair to their children.
Over many generations, the allele for less body hair became more common in the population, while the allele for thick body hair became less common, as those individuals were at a selective disadvantage. This gradual change in the inherited characteristics of the population is evolution by natural selection.