
▶️ Answer/Explanation
(a)(i) • water / protein (1)
Accept amino acids
(a)(ii) 26 (2)
Example calculation: \( 9.2 \div 35 \times 100 = 26.28571 \)
One mark for correct answer to any number of decimal places e.g. 26.28571…
OR
One mark for \( 9.2 \div 35 \)
OR
One mark for \( 0.26(28571) \)
Correct answer gains both marks
(a)(iii) An answer that makes reference to one of the following: (1)
• helps peristalsis / eq (1)
• prevents constipation / eq (1)
• helps intestines push food / eq (1)
• helps release faeces / eq (1)
• helps egestion / eq (1)
• helps in movement of food / eq (1)
Reject excrete faeces
(b) An answer that makes reference to three of the following: (3)
• amylase (1)
• from salivary glands / from pancreas / eq (1)
Accept (released into / digested in) mouth
Accept (released into / digested in) small intestine / duodenum / ileum
• starch / it, is digested into maltose (1)
Accept broken down / hydrolysed / turned into for digested
• maltase digests maltose (into glucose) (1)
(c)(i) An answer that makes reference to the following: (1)
• 38 (mg per cm³) (1)
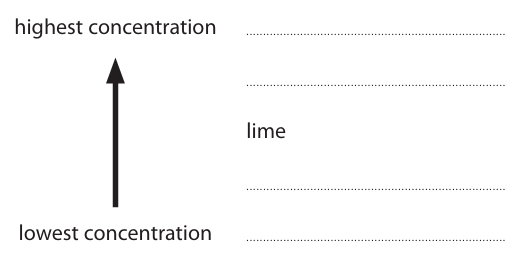
(c)(ii) An answer that makes reference to the following order: (1)
• orange lemon (lime) apple grape (1)
Accept numbers from table i.e. 3 4 (lime = 7) 18 22
(c)(iii) An answer that makes reference to two of the following: (2)
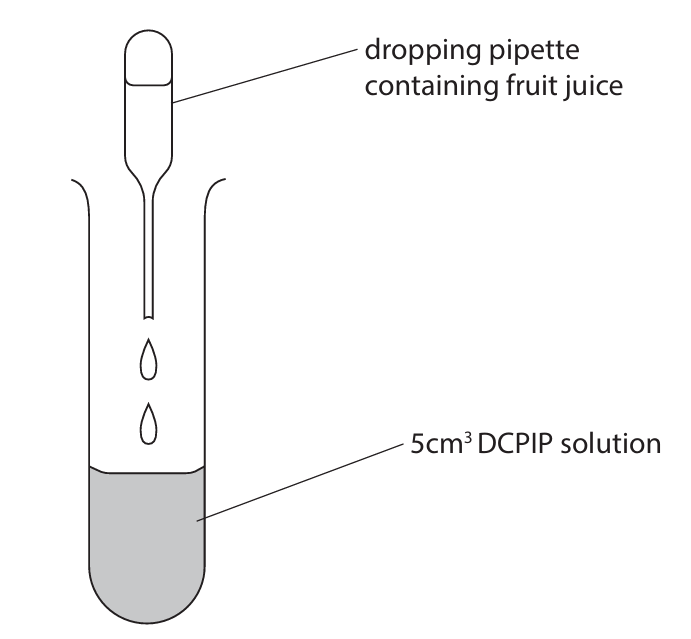
• use a syringe / graduated pipette / measuring cylinder / burette / eq (1)
• to measure volume / ml / cm³ / dm³ / mm³ / eq (1)
• as drop sizes vary / masses of drops vary / volumes of drops vary / eq (1)
• mix / swirl / stir (solution after adding drops) / eq (1)
Ignore pipette alone
Accept Automatic pipette
Accept volumetric pipette
Accept balance / scale
Accept use titration
Accept mass / weight (of juice)
Accept idea that method does not control drop size
Ignore references to repeats / replicates
(Total for Question 4 = 11 marks)


▶️ Answer/Explanation
(a)(i) A (P)
B is not the answer as Q is not the oesophagus.
C is not the answer as R is not the oesophagus.
D is not the answer as U is not the oesophagus.
(a)(ii) D (T)
A is not the answer as P is not part of the large intestine.
B is not the answer as Q is not part of the large intestine.
C is not the answer as R is not part of the large intestine.
(a)(iii) C (S)
A is not the answer as Q does not contain villi.
B is not the answer as R does not contain villi.
D is not the answer as V does not contain villi.
(a)(iv) A (Q)
B is not the answer as S is not the stomach.
C is not the answer as T is not the stomach.
D is not the answer as V is not the stomach.
(b) A description that makes reference to the following:
- peristalsis (1)
- muscles contract (behind food) / muscles push (food along) / muscles squeeze / eq (1)
(c)(i) An answer that makes reference to four of the following (allow converse for adult):
- more protein in young dog food as they are growing more / for growth / eq (1)
- amino acids for protein synthesis / eq (1)
- more fat in young dog food as more active / for growth / eq (1)
- more fat for energy / for respiration / eq (1)
- more calcium in young dog food as more bone and teeth growth / eq (1)
- more phosphate for bones / ATP / DNA / eq (1)
- all components higher in young dog food / total percentage higher / eq (1) (stated not cumulative)
(c)(ii) An answer that makes reference to three of the following:
- excess carbohydrates / starch / glucose / energy converted to fat / eq (1)
- may gain (too much) mass / become obese / overweight / eq (1) (ignore become fat)
- may become diabetic / have heart disease / CHD / eq (1)
- may fail to thrive / grow / eq (1)
- as lack protein / eq (1)

▶️ Answer/Explanation
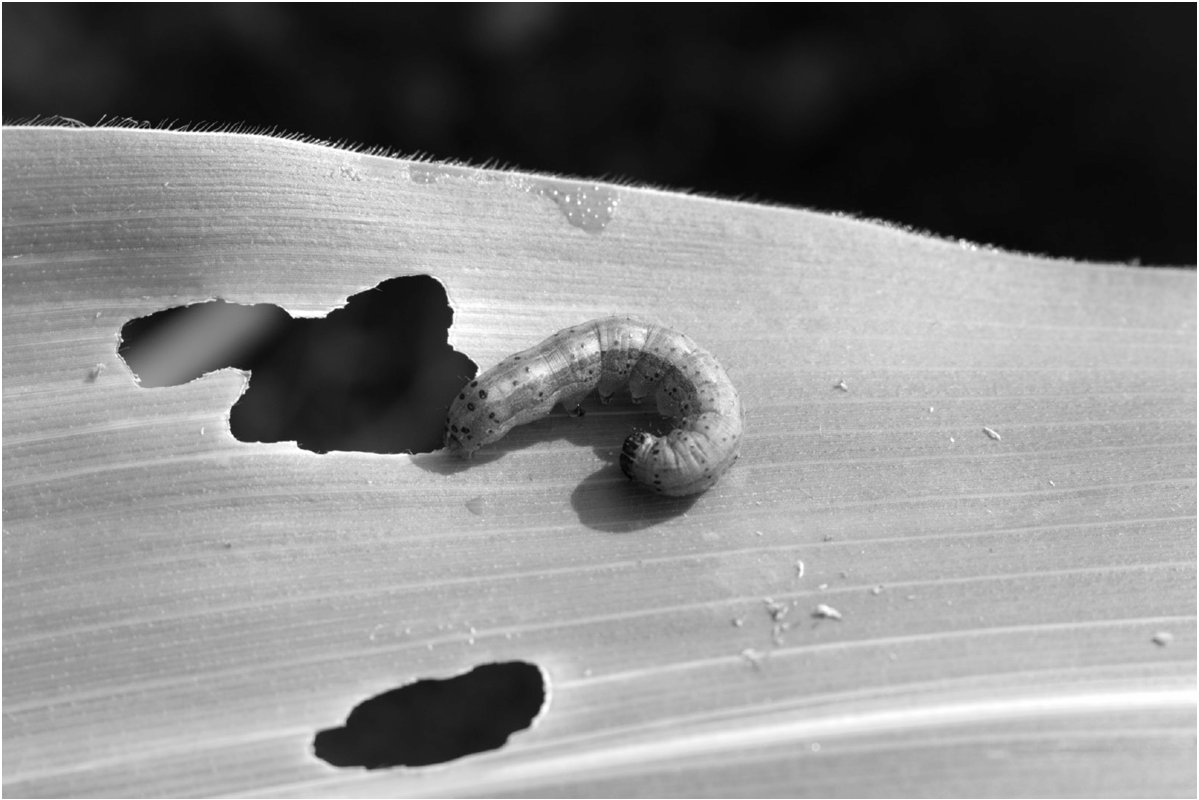
(a) An explanation that makes reference to two of the following points:
- less (leaf) area / surface / fewer leaves
- fewer chloroplasts / less chlorophyll
- (less) photosynthesis
- less carbohydrate / glucose / sugar produced
(b) An explanation that makes reference to four of the following points (advantages of biological control):
- lasts longer / does not need reapplication
- specific / does not affect food chain / other organisms
- no residue on crop / not eaten by humans / does not affect humans
- no bioaccumulation / biomagnification
- pest does not become resistant
(c)(i) An explanation that makes reference to three of the following points:
- moth population rises (up to 6 months)
- wasp population also rises as more moths / food is available
- (from 6 months) moth population falls as eaten by wasp
- wasp population falls as fewer moths to feed on / less food available
- moth population recovers / repeats pattern
(c)(ii)
Maximum moth number \( \approx 2150 \) (at ~7 months).
Minimum moth number \( \approx 850 \) (at ~11 months).
Maximum range \( = 2150 – 850 = 1300 \).
(c)(iii) An explanation that makes reference to two of the following points:
- some moths remain / doesn’t kill all moths
- delay to act / kill moths / slower (than chemical)
- numbers vary with time of year / seasons
- wasps are expensive
- wasps may become pest / may kill other organisms / may affect food chain / farmers may not want to leave wasps in their fields / may sting farmers

Most-appropriate topic codes (Edexcel IGCSE Biology):
- 2(e): Nutrition – Flowering plants — parts (a), (b), (c)
- 2(d): Movement of substances into and out of cells — part (d)
- 2(f): Respiration — parts (b), (d)
- 3(h): Transport – Flowering plants — parts (c), (d)
- Appendix 5: Suggested practical investigations — part (b)
▶️ Answer/Explanation
(a) Energy conversion during photosynthesis:
from light/solar energy to chemical energy
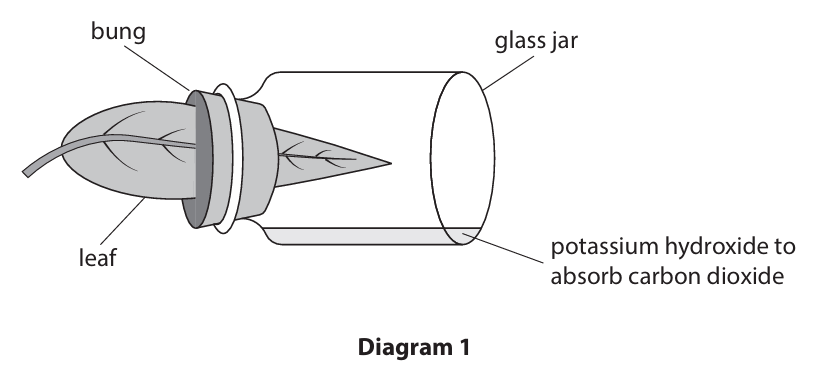
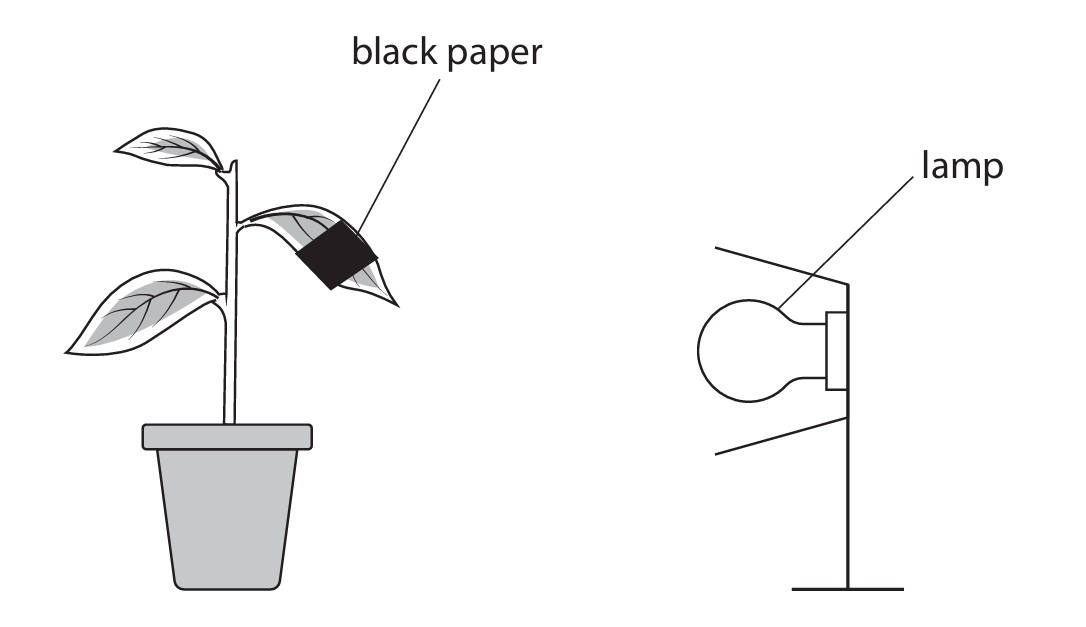
(b)(i) To remove all starch from the plant’s leaves:
• Keep the plant in darkness for 12/24/48 hours
• This allows all starch to be used up in respiration
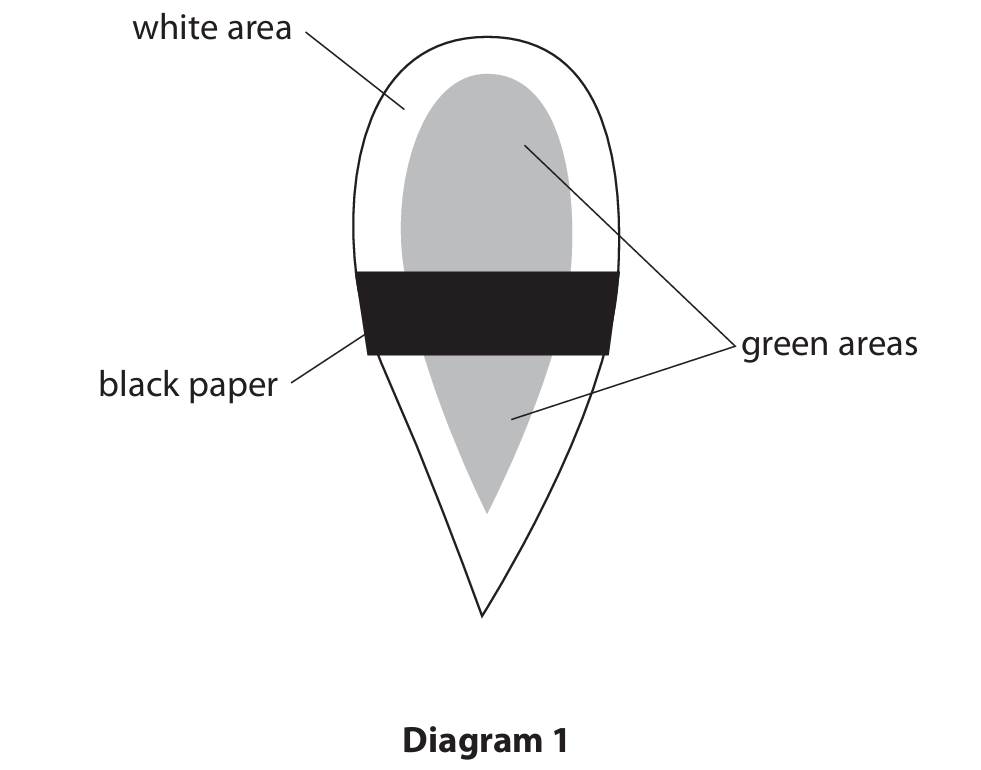
(b)(ii) Diagram 2 results:
• Left side (outside flask): black/blue/starch present
• Right side (inside flask): yellow/orange/brown/no starch
The part exposed to carbon dioxide (outside flask) tests positive for starch, while the part without carbon dioxide (inside flask) tests negative.
(c) Functions of two named mineral ions:
Nitrate ions: needed for amino acids/proteins/enzymes/DNA
Magnesium ions: needed for chlorophyll/chloroplasts/photosynthesis
Other acceptable pairs:
• Iron: for chlorophyll/chloroplasts/photosynthesis/respiration
• Phosphate: for DNA/ATP/cell membranes
• Calcium: for cell walls/cell membranes
• Potassium: for water balance/enzymes/photosynthesis/respiration
(d) Why plants in waterlogged soil cannot absorb mineral ions:
• Mineral ions are absorbed by active transport
• Waterlogged soil has no/less oxygen
• Therefore, there is no/less respiration
• Resulting in no/less energy/ATP for active transport
Most-appropriate topic codes (Edexcel IGCSE Biology):
- 3(h): Transport — part (a)
- 6(a): Food production — parts (b)(i), (b)(ii)
- 5(d): Human influences on the environment — parts (b)(i), (b)(ii)
- 5(b): Feeding relationships — part (b)(i)
- 2(e): Nutrition — part (a)(ii)
▶️ Answer/Explanation
(a)(i) Two substances carried in the phloem:
1. Sucrose/sugars (1)
2. Amino acids (1)
Marking guidance: ignore glucose; allow water/plant hormones/named plant hormone
(a)(ii) Explanation why insects feeding from phloem reduce crop yield:
An explanation that makes reference to three of the following:
- No/less respiration/no/less energy (1)
- No/less protein (1)
- No/less growth/new cells (1)
- Less fruit production/fewer oranges/smaller fruit (1)
Marking guidance: No credit for less sugar amino acid or glucose; Ignore less crops/less yield
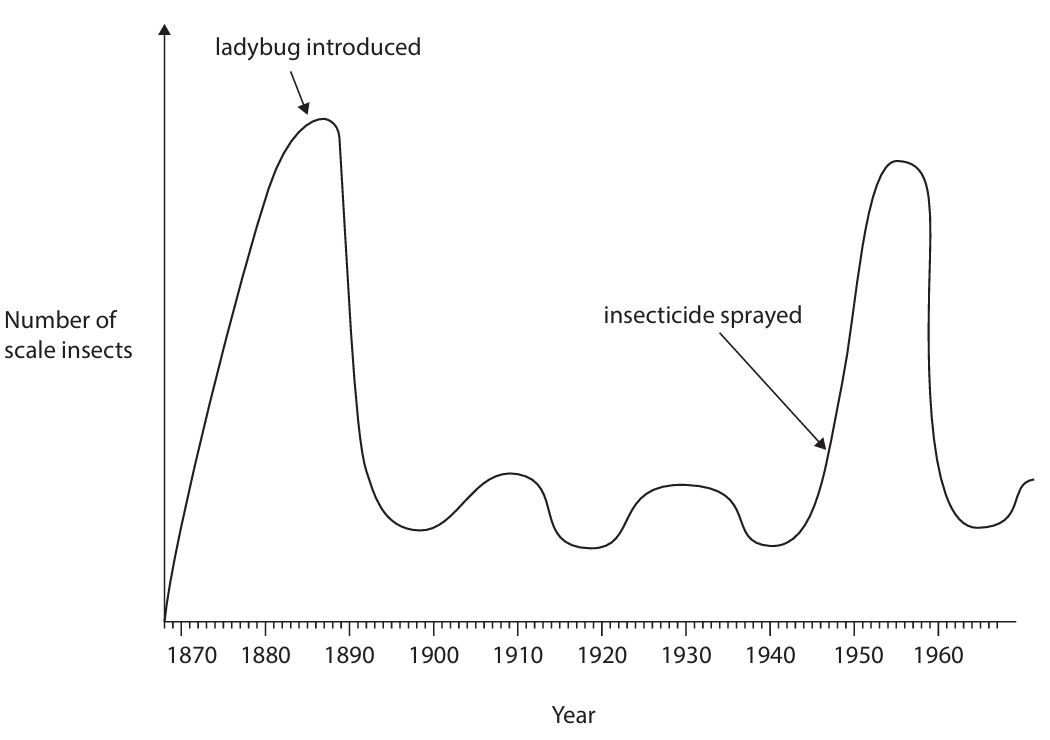
(b)(i) Discussion of effects on scale insect numbers:
An answer that makes reference to five of the following:
- Reduce (quickly/steeply) after ladybug introduced (1)
- As the ladybugs feed on scale/pests (1)
- Scale insects numbers go up and down/fluctuate/oscillate (1)
- Some pests required for ladybugs to feed on/scale insects never completely wiped out (1)
- Insecticide release causes (rapid) increase in scale insects/pests (1)
- As (more) ladybugs killed (than scales/pests) (1)
- Fewer scale insects are eaten/less predation (1)
- Insecticide becomes less effective/disperses/ladybugs recover/ladybugs develop resistance (1)
- Scale insects/pest numbers drop (1)
- Ladybugs/biological control more effective than insecticide/kill more pests (1)
(b)(ii) Three advantages of biological control instead of pesticides:
An explanation that makes reference to four of the following points:
- Lasts longer/does not need reapplication (1)
- Specific/does not affect food chain/other organisms (1)
- No residue on crop/not eaten by humans/does not affect humans (1)
- No bioaccumulation/biomagnification (1)
- Pest does not become resistant (1)
Marking guidance: allow converse; ignore cheaper alone; ignore pollution alone; allow contaminate crops; ignore immune
▶️ Answer/Explanation
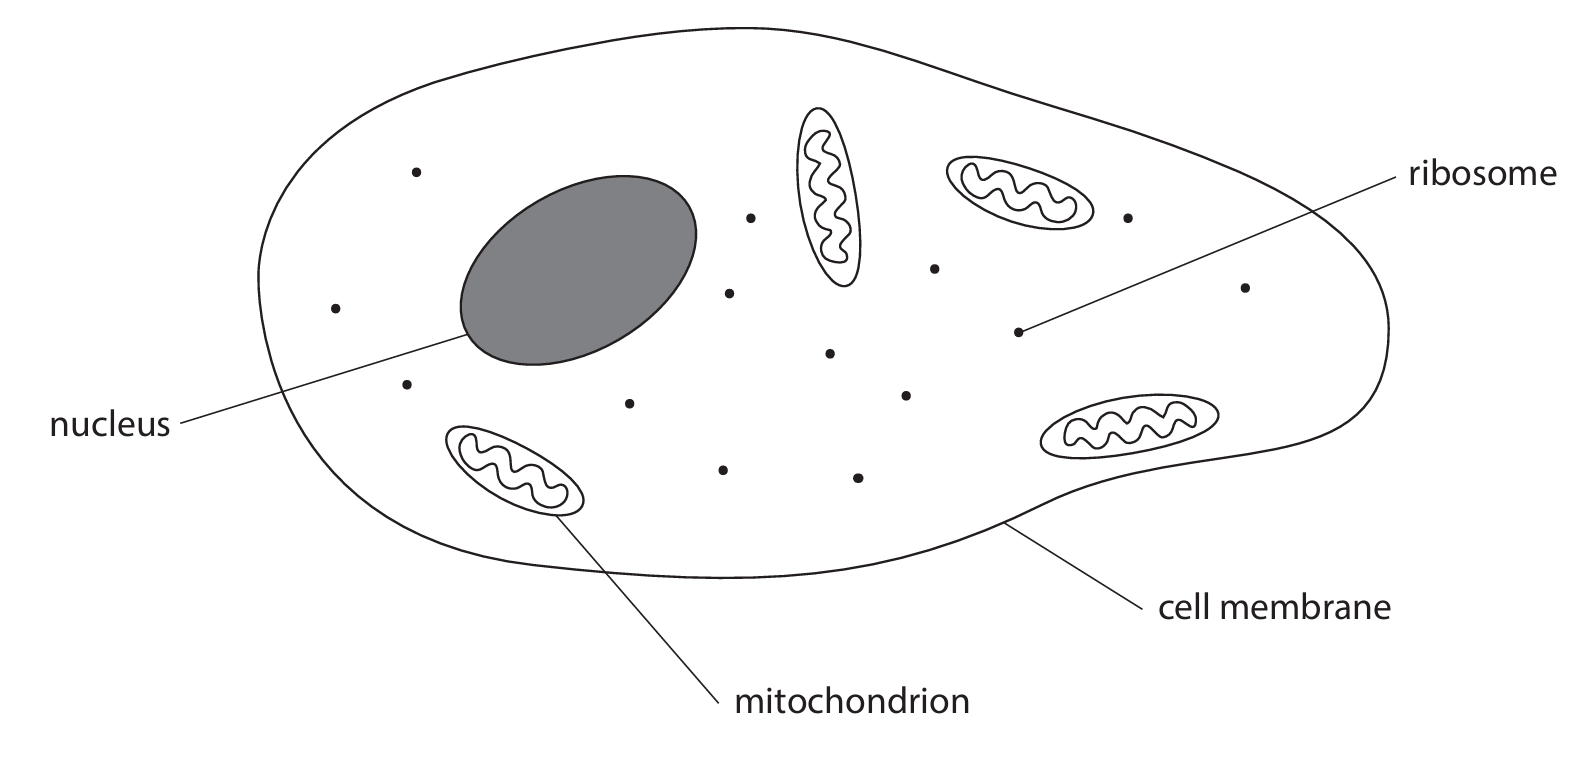
(a)(i) D (ribosome)
A is incorrect as cell membrane does not synthesise protein
B is incorrect as mitochondria does not synthesise protein
C is incorrect as the nucleus does not synthesise protein
(a)(ii) C (mitochondrion, nucleus and ribosome)
A is incorrect as ribosomes are also present in both
B is incorrect as nuclei are also present in both
D is incorrect as mitochondrion is also present in both
(b)(i) 40:1
Example calculation:
• Number of mitochondria per 10 μm3 for sperm = 12
• Volume of sperm cell = (75 ÷ 12) × 10 = 62.5 μm3
• Ratio = 2500:62.5 = 40:1
(b)(ii) An explanation that makes reference to four of the following:
• villus has highest number of mitochondria per cell / sperm has lowest number of mitochondria per cell
• sperm has highest number of mitochondria per 10 μm3 / skin has lowest number per 10 μm3
• mitochondria perform aerobic respiration / make ATP / release energy
• villus cells do active transport (so need lot of energy)
• sperm cells move / swim (so need lot of energy)
• skin cells have few active processes / use little energy
▶️ Answer/Explanation
(a)(i) • producer / first trophic level (1)
(a)(ii) • tertiary consumer / third consumer / fourth trophic level (1)
(b)(i)
Calculation method (not marking points):
Full marks for correct answer with no working.
Example: Measured length = 75 mm = 75 × 1000 = 75000 µm
Magnification = image size / actual size = 75000 µm / 10 µm = × 7500 (2)
(Allow answers in the range 7400 to 7600 depending on measurement. Ignore units in final answer.)
(b)(ii)
Calculation method (not marking points):
Full marks for correct answer with no working.
Example using formula: \( V = \frac{4}{3} \pi r^3 \)
\( r^3 = 5^3 = 125 \)
\( V = \frac{4}{3} \times 3.14 \times 125 = \frac{4 \times 392.5}{3} = \frac{1570}{3} = 523.33 \)
Volume = 523 µm3 (2) (Allow 522–524). If they round 4/3 to 1.33, answer will be = 522.
(b)(iii) A description that includes two of the following points:
• absorbs / traps (sun)light / light energy (1)
• site of photosynthesis (1)
• produces glucose / carbohydrate / sugar / starch (1)
(Note: Ignore “uses”. “Converts light energy into chemical energy” scores the first and third marking points.) (2)
(b)(iv) A description that includes the following points:
• provides an energy store / energy reservoir / stores carbohydrate (1)
• (can be broken down to release energy in) respiration (1) (2)
(c) A description that includes four of the following points:
• use quadrats (1)
• random sampling (1)
• use coordinates / grid to select sample positions (1)
• count number of individuals / plants in each quadrat (1)
• repeat and (calculate) mean / average (1)
• multiply (mean count) by size of (total) area to estimate population size (1)
(Note: “Use quadrats” scores the first and fifth marking points.) (4)
▶️ Answer/Explanation
(a)(i) C (maltose)
(a)(ii) C (2 and 3 only)
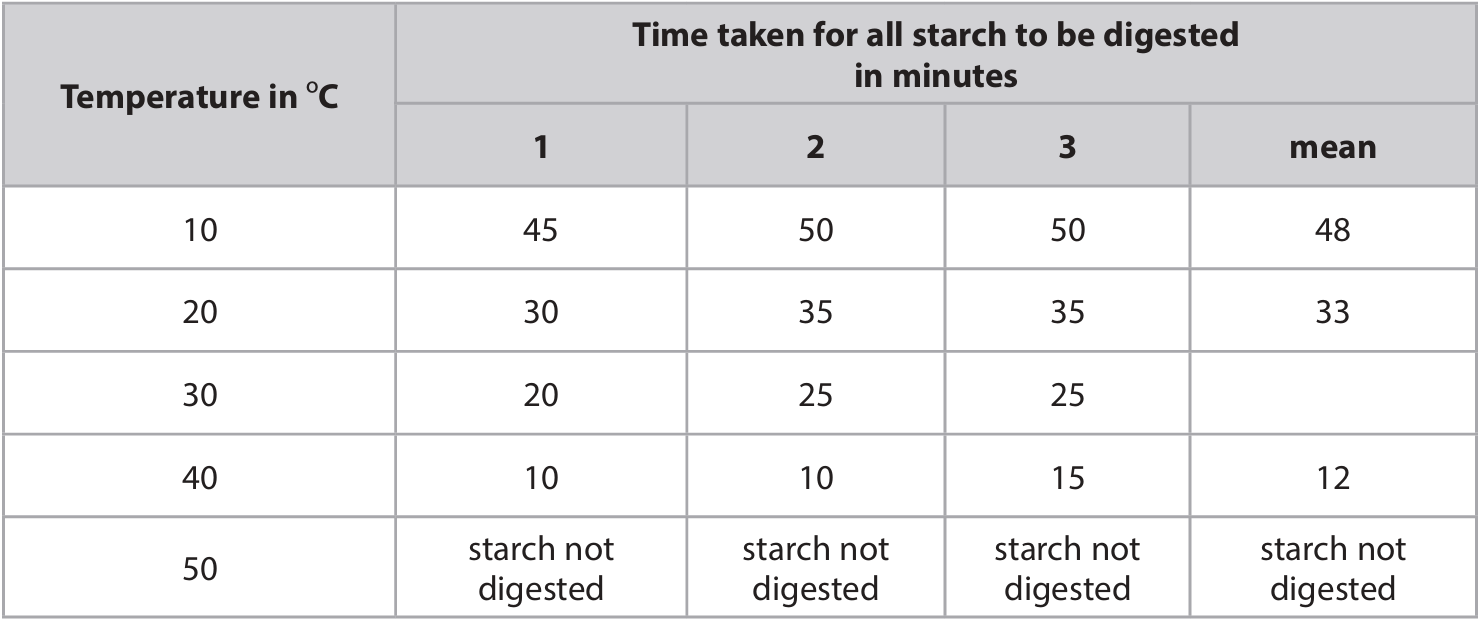
(b)(i) to reach temperature / bring to temperature / make sure at 10°C / equilibrate / warm up
(b)(ii) • add iodine (solution) (1)
• black / (dark) blue (colour) (1)
(c)(i) \(\frac{20 + 25 + 25}{3} = \frac{70}{3} = 23.333…\)
Mean time = 23 minutes (to two significant figures)
(c)(ii) An explanation that makes reference to two of the following:
• increased (kinetic) energy (1)
• faster movement (of enzyme and substrate) / more collisions / greater rate of collisions / more enzyme-substrate complexes (1)
• reaches optimum temperature for enzymes (1)
(c)(iii) An explanation that makes reference to two of the following:
• enzyme denatures / amylase denatures (1)
• active site changes shape / enzyme is not complementary to substrate (1)
• substrate / starch no longer binds / fits (1)
(c)(iv) An explanation that makes reference to two of the following:
• use smaller temperature intervals / use 5°C intervals / use 1°C intervals (1)
• between 30 and 40 / between 30 and 50 / between 40 and 50 / the rate may be faster at temperatures above or below 40 / optimal may not be at 40 (1)
• use smaller time intervals (1)
• as similar recorded times may actually be different (1)
▶️ Answer/Explanation
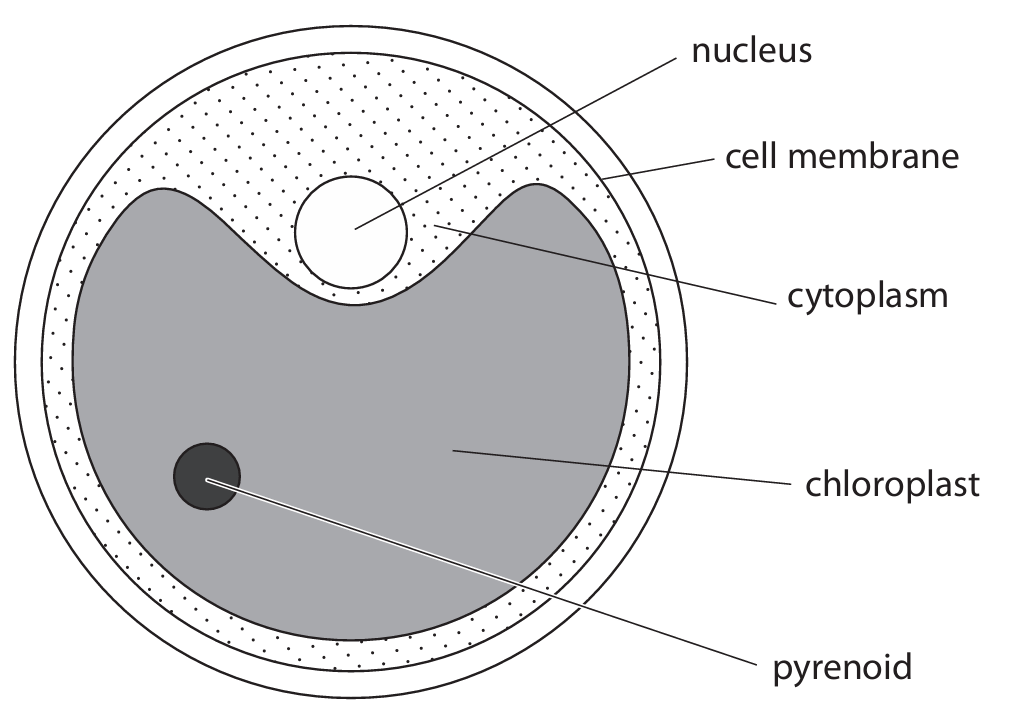
(a)(i) C (2 and 3 only)
A is incorrect because chitin is not present in either.
B is incorrect because chitin is not present in either.
D is incorrect because both have chloroplasts.
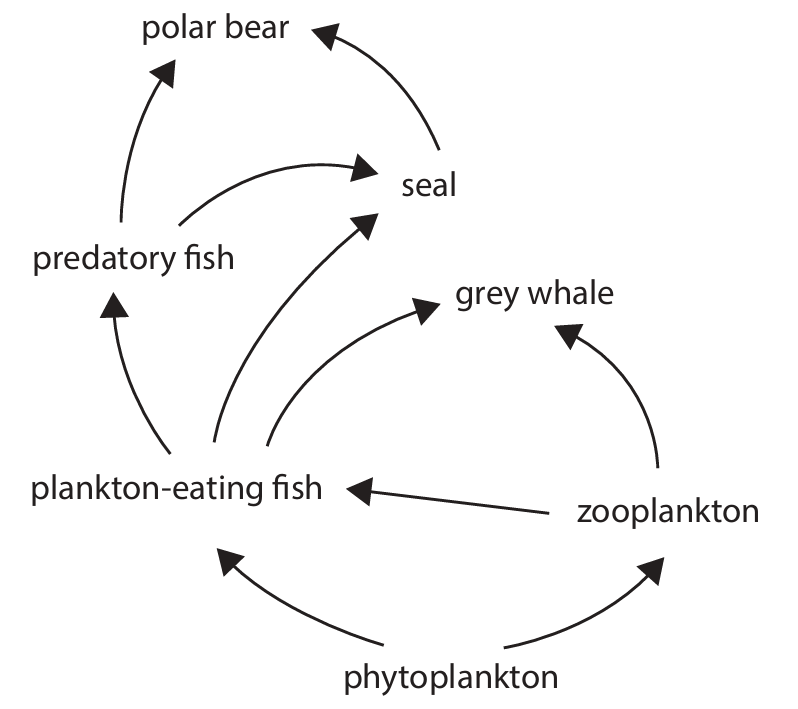
(a)(ii) Any two of: polar bear, seal, grey whale, predatory fish.
(a)(iii) phytoplankton → zooplankton → plankton-eating fish → predatory fish → seal → polar bear
One mark for correct organisms in order. One mark for correct arrow direction.
(b)(i) 950%
Working:
Increase = \(12.6 – 1.2 = 11.4\ \text{mg per dm}^3\)
Percentage Increase = \(\frac{11.4}{1.2} \times 100 = 950\%\)
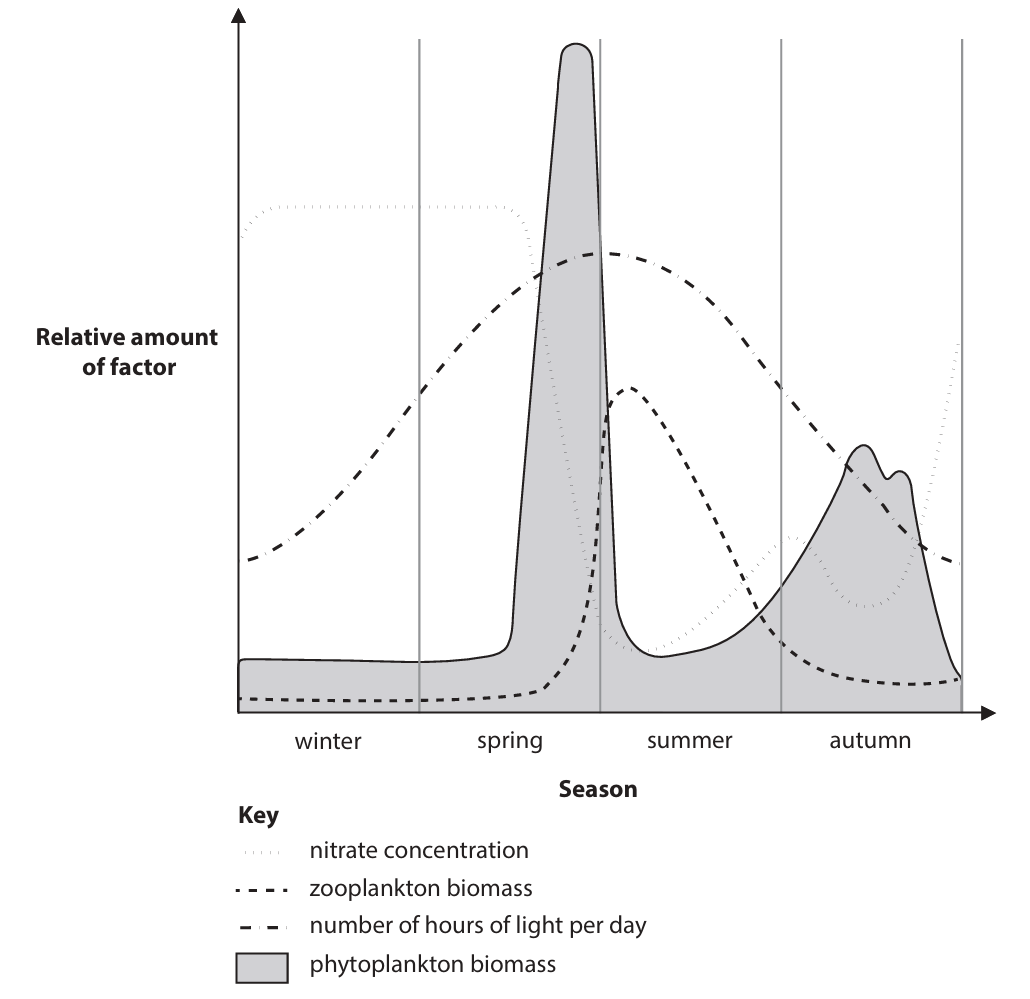
(b)(ii) An answer that makes reference to points such as:
• Phytoplankton biomass is low in winter due to low light and temperature, reducing photosynthesis.
• Biomass increases in spring as light intensity and duration increase, enhancing photosynthesis.
• Increased photosynthesis produces more glucose, allowing phytoplankton growth.
• Zooplankton biomass increases after phytoplankton increase, as they feed on phytoplankton.
• Phytoplankton decrease in late summer/autumn as zooplankton population peaks and consume them, and light/nitrate levels fall.
• Nitrate concentration decreases in spring/summer as phytoplankton absorb nitrates to make amino acids and proteins.
• The biomass of both is limited by abiotic factors (light, nitrates) and biotic factors (predation).

▶️ Answer/Explanation
(a)(i)
An answer that makes reference to the following points:
- Correct genotypes of parents (Dd, dd) (1)
- Correct gametes (D or d, d) (1)
- Correct genotypes of offspring (Dd, dd) (1)
- Correct probability of \( 0.5 \) / 50% / \( \frac{1}{2} \) (1)
Example genetic diagram:
Parents: Dd (Individual 4) × dd (Individual 5)
Gametes: D, d from parent 4; d, d from parent 5
Offspring genotypes: Dd, Dd, dd, dd
Probability of lactose intolerant child (dd) = \( \frac{2}{4} = \frac{1}{2} \) (50%)
(a)(ii)
An answer that makes reference to two of the following:
- Less water absorbed (into blood) (1)
- By colon / intestine (1)
- As sugar / lactose is not absorbed (1)
- (As lactose) affects osmosis / lowers water potential (1)
- (Lactose could cause) bacteria to grow / bacteria break down lactose (1)
(a)(iii)
An explanation that makes reference to four of the following points:
- Mutation (occurred) (1)
- Creating (genetic) variation (1)
- People with lactose tolerance (DD or Dd) can drink milk / did not get diarrhoea / can gain extra nutrients / were able to compete better / survived / had a selective advantage (1)
- Reproduced (more) / produced offspring (1)
- Pass on allele / gene / mutation (1)
(b)(i)
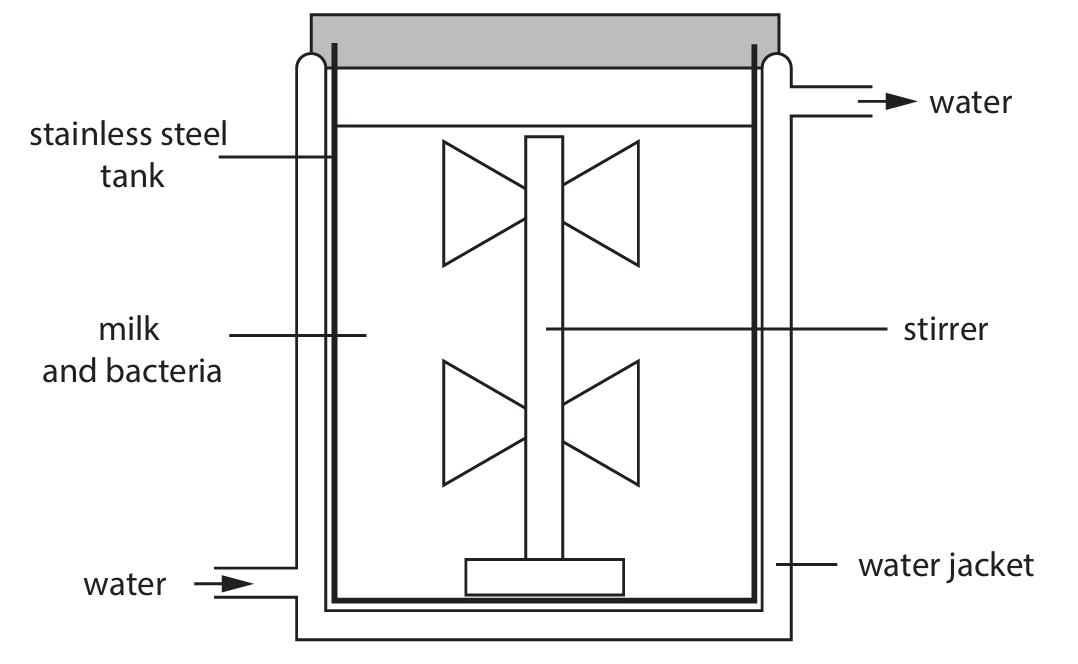
An explanation that makes reference to the following points:
- Mixes the contents / spreads nutrients / maintains even consistency / prevents settling (1)
- Maintains even temperature / prevents hot spots / maintains an even pH (1)
(b)(ii)
An explanation that makes reference to two of the following:
- Removes heat / cools the fermenter (1)
- To maintain optimal temperature (1)
- Prevents enzymes denaturing / prevents death of bacteria (1)
▶️ Answer/Explanation
(a) A description that makes reference to the following points:
- Plasmid (used) as vector (1).
- Restriction enzyme used to cut out gene / cut plasmid / cut DNA (1).
- Ligase used to insert gene into plasmid / stick DNA / glue DNA / stick gene with DNA (1).
(b) An explanation that makes reference to three of the following points:
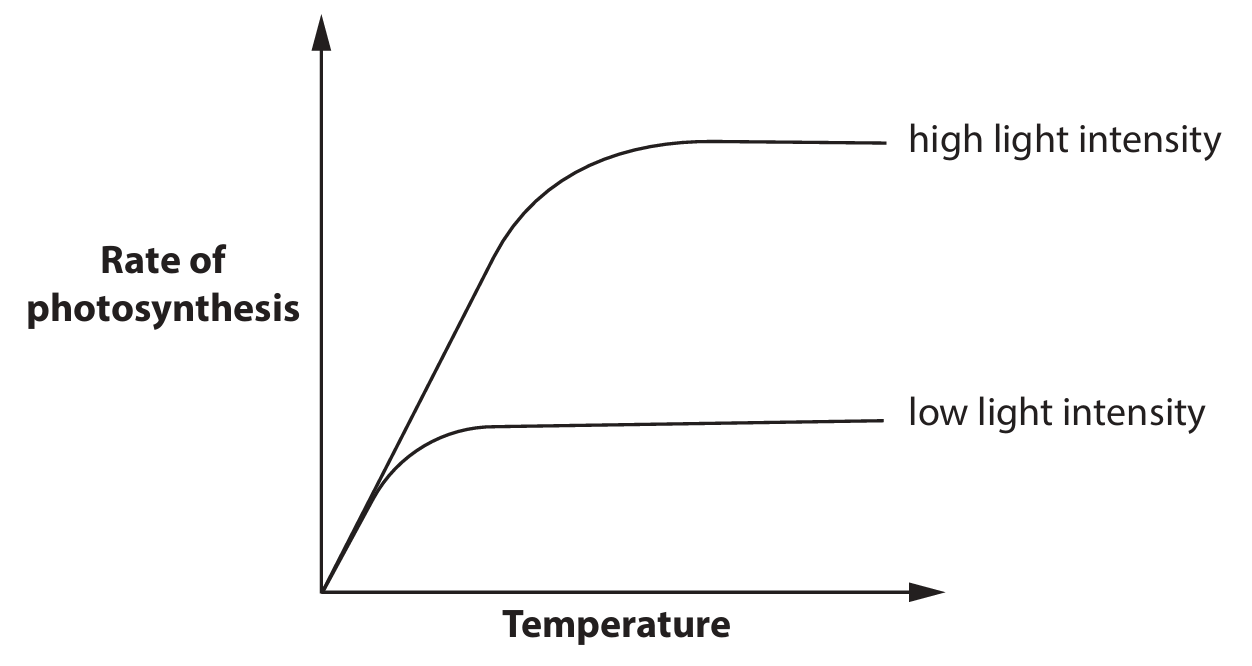
- Increasing temperature increases the rate of photosynthesis (1).
- Because particles have more (kinetic) energy / more frequent collisions / there is more enzyme activity (1).
- (At low light intensity rate levels off) so light is limiting (1).
- (At high light intensity) carbon dioxide limits rate / not enough carbon dioxide (1).
- (At high light intensity) rate levels off because temperature is no longer limiting / other factors become limiting (1).
(c) An answer that makes reference to five of the following points:
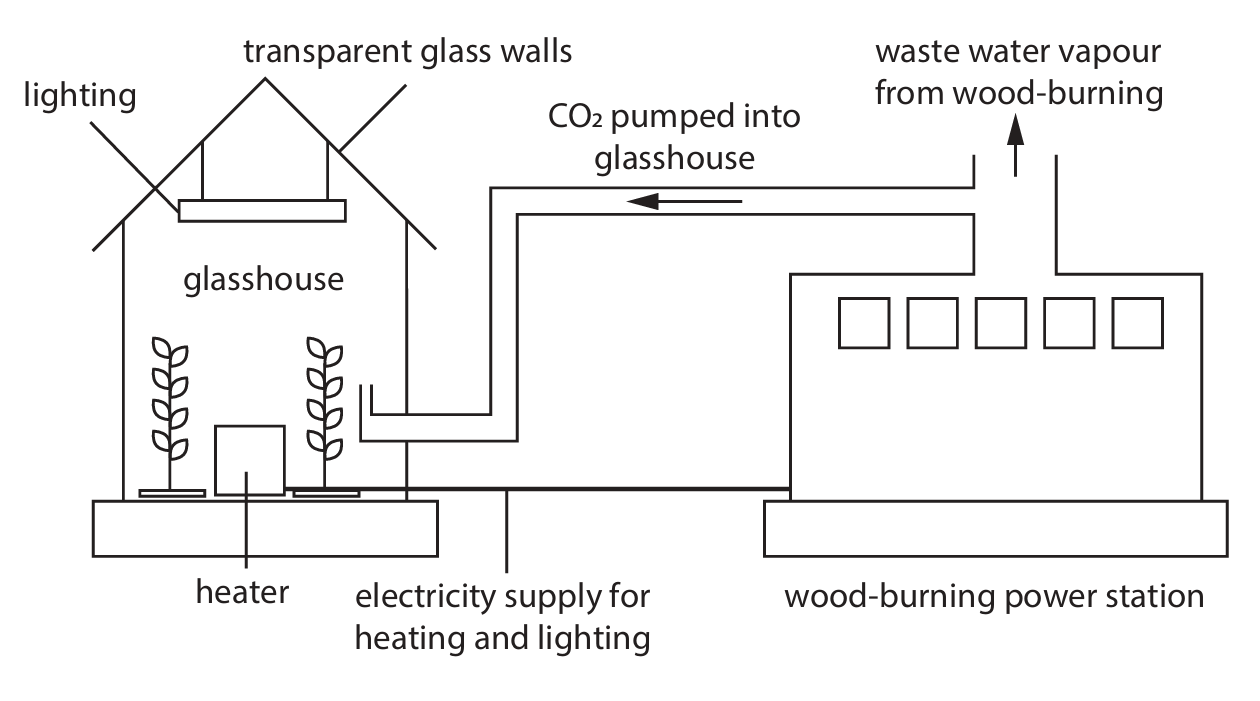
- Light, carbon dioxide and (warm) temperature are supplied / provided (1).
- Therefore no factors for photosynthesis are limiting / all factors present for photosynthesis / there is more photosynthesis (1).
- So high yield / fast production / (to give high profit) / more tomatoes (1).
- No need to buy carbon dioxide / no need to buy electricity / wood is cheaper than fossil fuel / wood cheaper than buying electricity (1).
- Tomatoes protected from pests / disease / frost / cold / bad weather (1).
- Wood is renewable (energy) (1).
- Less use of fossil fuel (1).
- Carbon dioxide not released into atmosphere / is reused (1).
- Less greenhouse effect / less climate change / less ice cap melting (1).
- Less release of sulfur dioxide / less acid rain (1).
▶️ Answer/Explanation
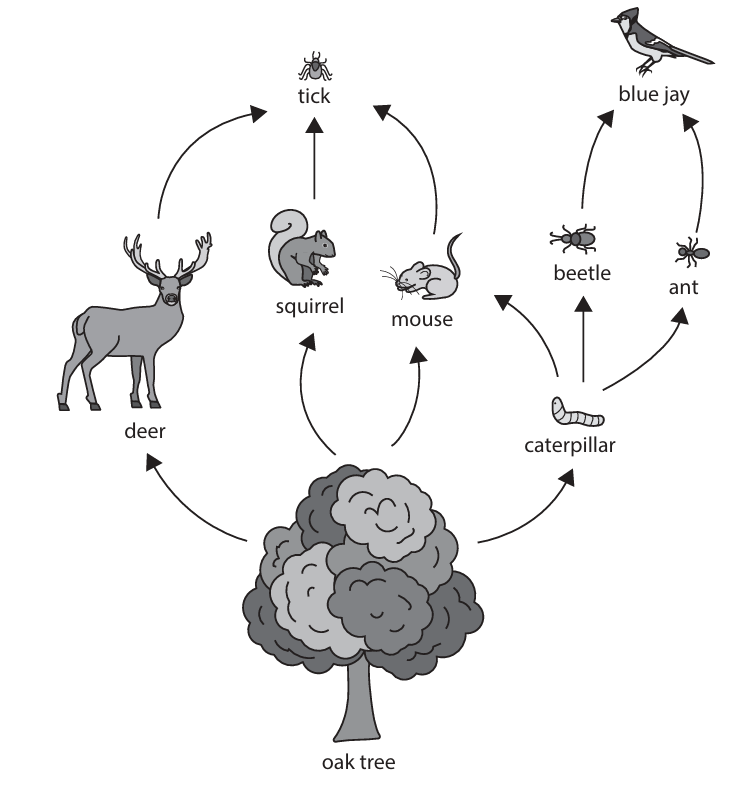
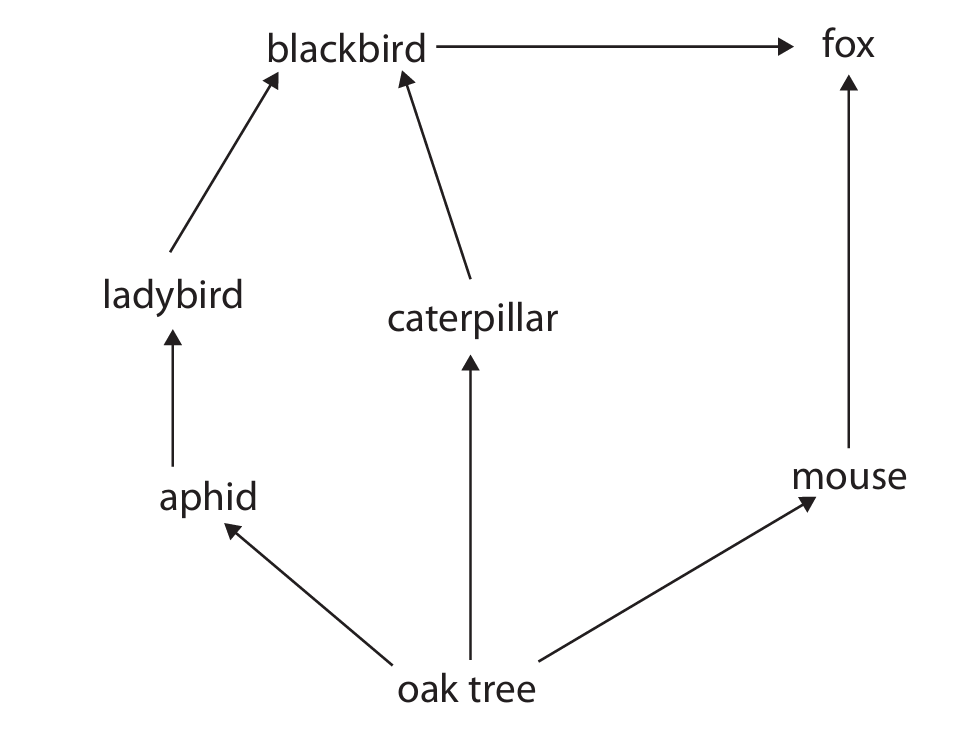
(a)(i) C (oak tree)
A is not the answer as beetle is not the producer
B is not the answer as deer is not the producer
D is not the answer as tick is not the producer
(a)(ii)
oak tree → caterpillar → mouse → tick
Allow 1 mark for correct order. No credit for pyramids.
(a)(iii) D (mouse)
A is not correct as the ant is not at two levels
B is not correct as the blue jay is not at two levels
C is not correct as the caterpillar is not at two levels
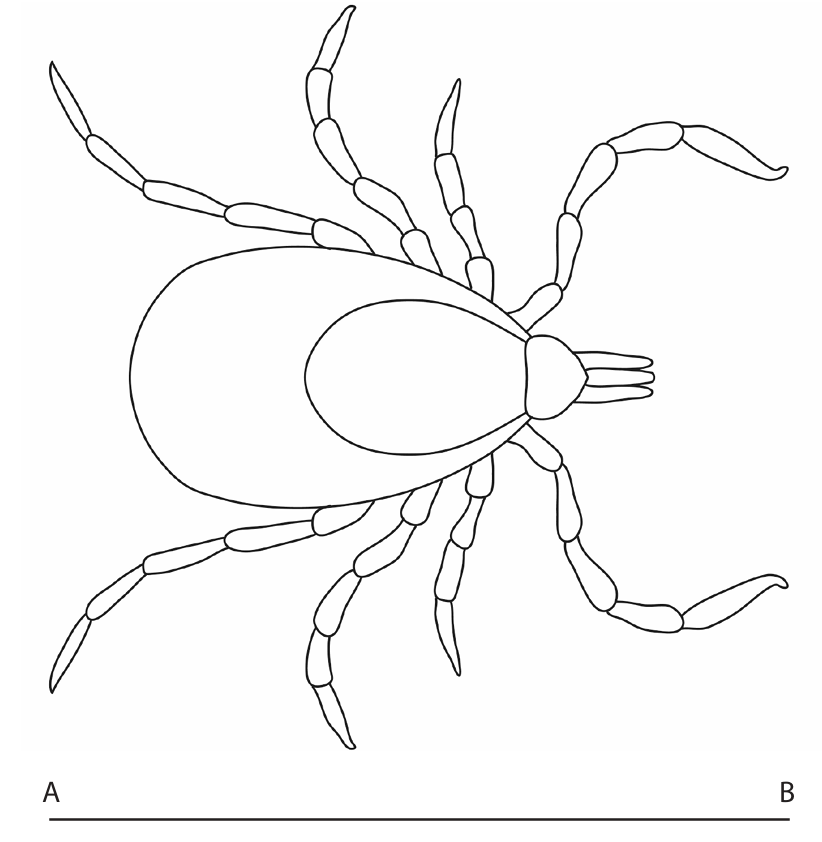
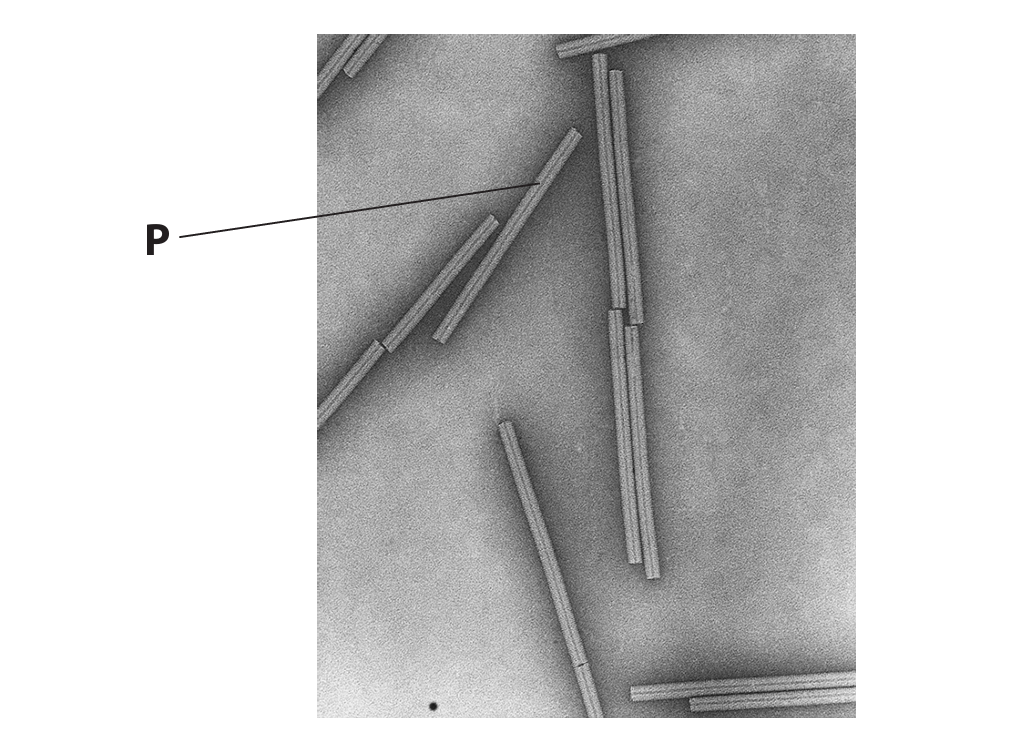
(b)(i)
Measurement of line = \(10.4 \text{ cm} = 104 \text{ mm}\)
Magnification = \(\frac{\text{image size}}{\text{actual size}} = \frac{104}{3.5}\)
Magnification = \(29.7\) (range \(29.0 – 30.0\) accepted)
Allow 1 mark for correct measurement of line (10.3-10.5 cm or 103-105 mm) with units.
(b)(ii)
An explanation makes reference to four of the following points (substance + matching function):
• Glucose (1) — for energy / respiration (1)
• Iron (1) — for haemoglobin / red blood cells (1)
• Amino acids (1) — for protein (synthesis) / growth (1)
• Fatty acids / lipids (1) — for energy / insulation (1)
• Water (1) — for keeping body hydrated / transport / solvent (1)
• Vitamin C (1) — for prevents scurvy (1)
Allow named vitamin or mineral for one mark each. Function must match substance.
(b)(iii)
An answer that makes reference to two of the following:
• Tick picks up / bites / sucks up / absorbs blood from infected animal / animal with disease (1)
• Bacteria / virus / pathogen is present in the blood (1)
• Tick then feeds on / bites a new / uninfected animal (1)
• Pathogen is transferred to the new host (1)
Allow ‘transfer’ if reference to biting is included.
▶️ Answer/Explanation
(a)(i) B (oxygen)
A is not the answer as carbon dioxide is not released
C is not the answer as methane is not released
D is not the answer as nitrogen is not released
(a)(ii) A (chloroplast)
B mitochondrion is not the site of photosynthesis
C nucleus is not the site of photosynthesis
D ribosome is not the site of photosynthesis
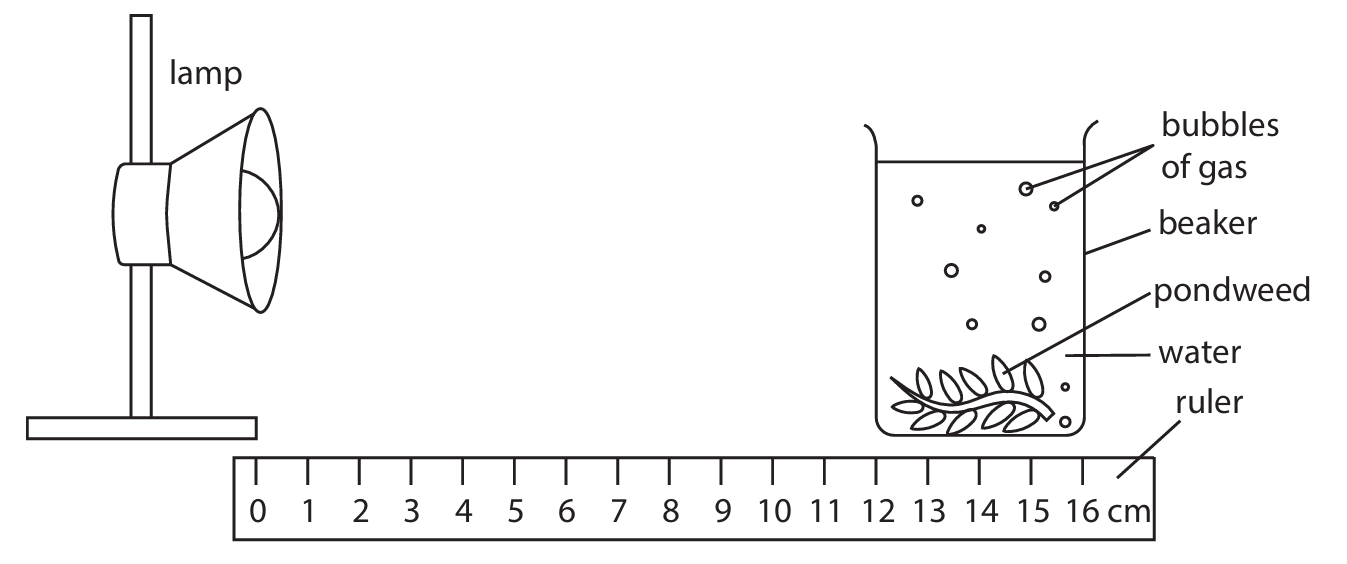
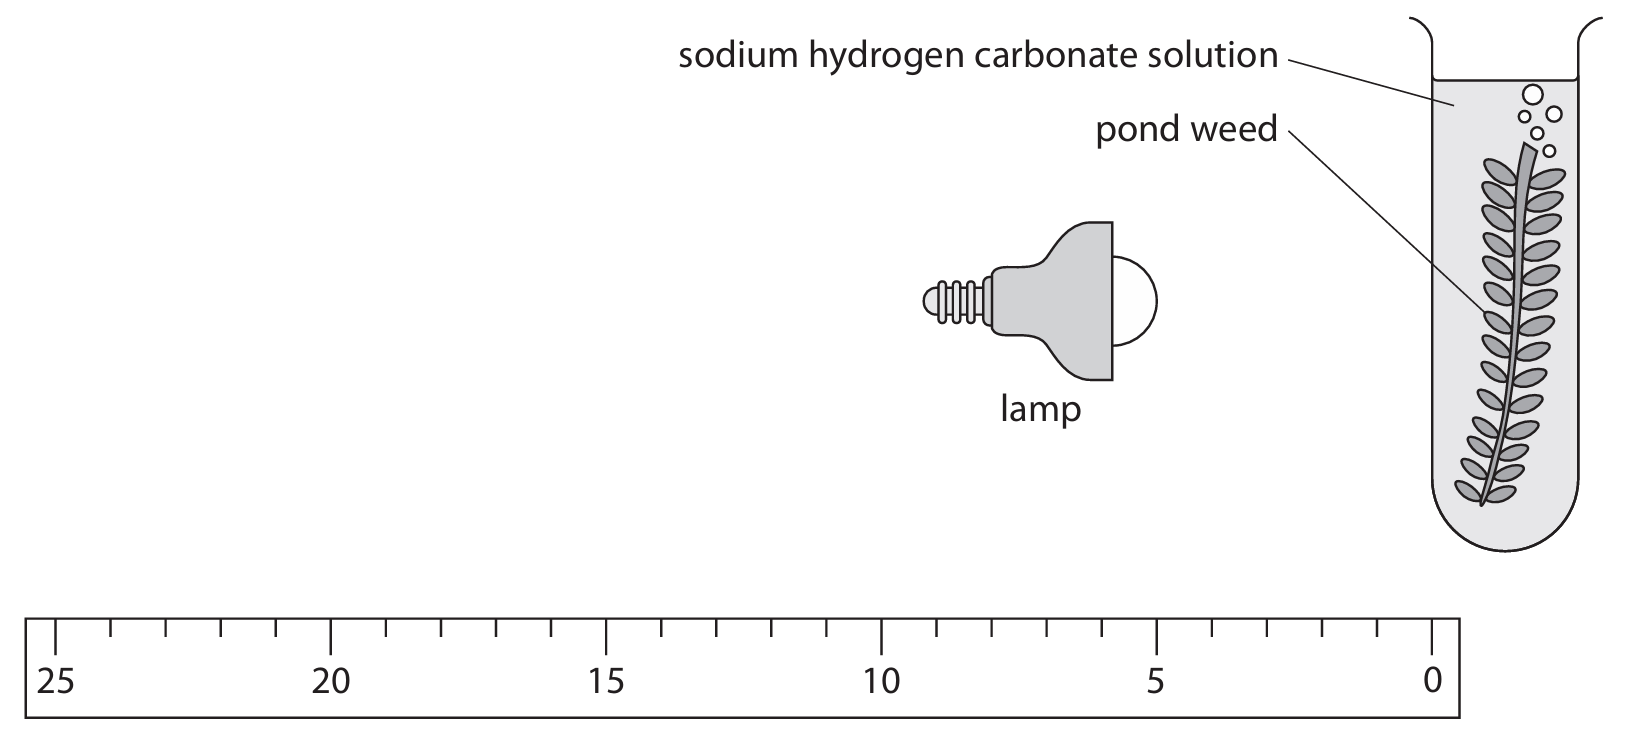
(a)(iii) • temperature / carbon dioxide concentration / pH / background light / same bulb/ lamp / time period / eq (1)
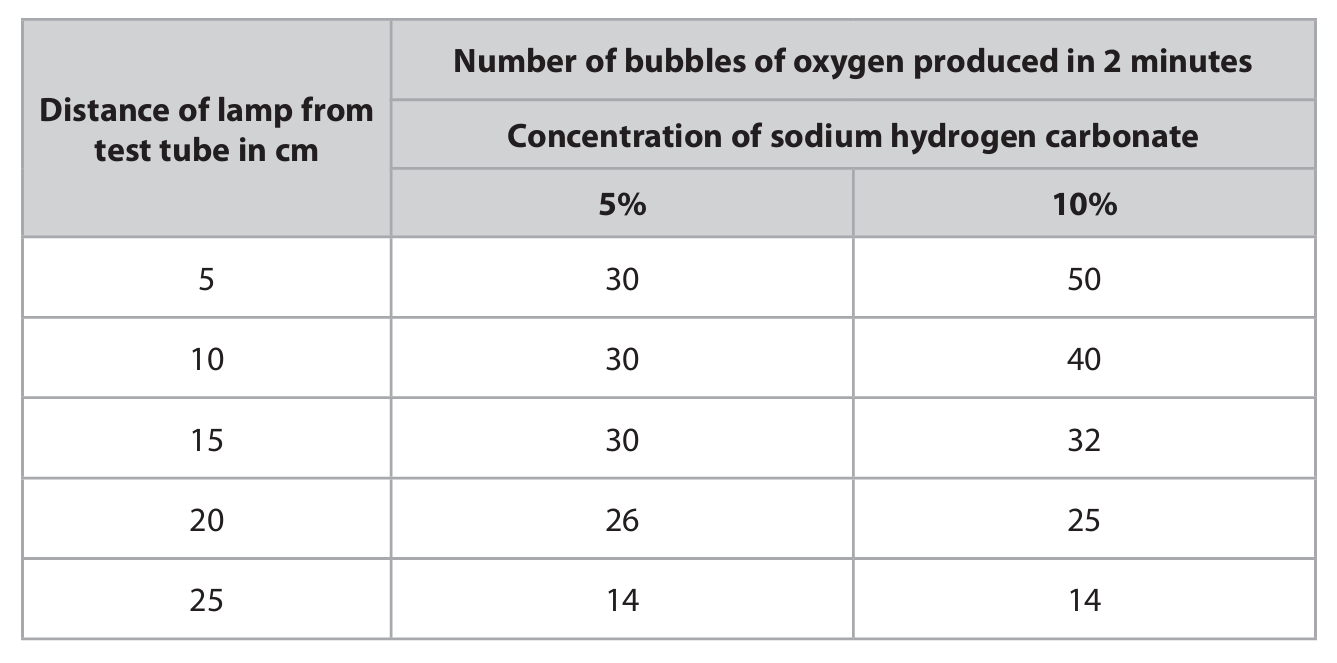
(b)(i) Line graph plotting criteria (from mark scheme):
• scale linear and plot half grid on y (1)
• lines straight and through points (1)
[Note: A full graph is expected here. The mark scheme awards marks for correct scaling, plotting, and straight line connections.]
(b)(ii) An explanation that refers to three of the following:
• as distance increases rate falls / fewer bubbles / eq (1)
• as light intensity reduces / less light energy / light becomes limiting factor (1)
• slower rate of / less photosynthesis (1)
• less oxygen released / fewer oxygen bubbles released (1)
▶️ Answer/Explanation
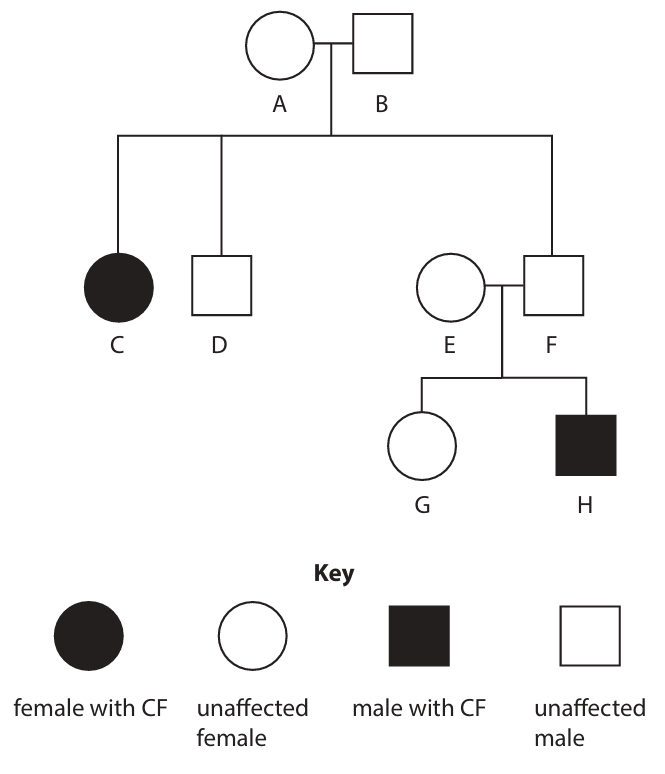
(a) An allele that is only expressed in the homozygote / only shown in phenotype if two copies are present / not expressed in the heterozygote / not expressed if a dominant allele is present. (1 mark)
(b)(i)
A: Ff (heterozygous) (1)
B: Ff (heterozygous) (1)
C: ff (homozygous recessive) (1)
(Total 3 marks)
(b)(ii) A genetic diagram showing:
• Parental genotypes: Ff and Ff (1)
• Gametes: F and f from each parent (1)
• Offspring genotypes and phenotypes: FF (unaffected), Ff (unaffected), Ff (unaffected), ff (affected) OR correct phenotype ratio (1)
(Total 3 marks)
(c)(i) An explanation that refers to three of the following:
• Pancreas produces/releases amylase/proteases/lipases. (1)
• No/less digestion of starch to maltose. (1)
• No/less digestion of proteins to amino acids. (1)
• No/less digestion of lipids to fatty acids and glycerol. (1)
• Less absorption of smaller/soluble molecules (e.g., amino acids, glucose, fatty acids). (1)
(Total 3 marks)
(c)(ii) An explanation that refers to two of the following:
• Reduces likelihood of pregnancy / less likely to conceive. (1)
• Sperm/semen cannot enter the fallopian tube/oviduct. (1)
• Fertilisation less likely / no fusion of gametes. (1)
(Total 2 marks)

▶️ Answer/Explanation
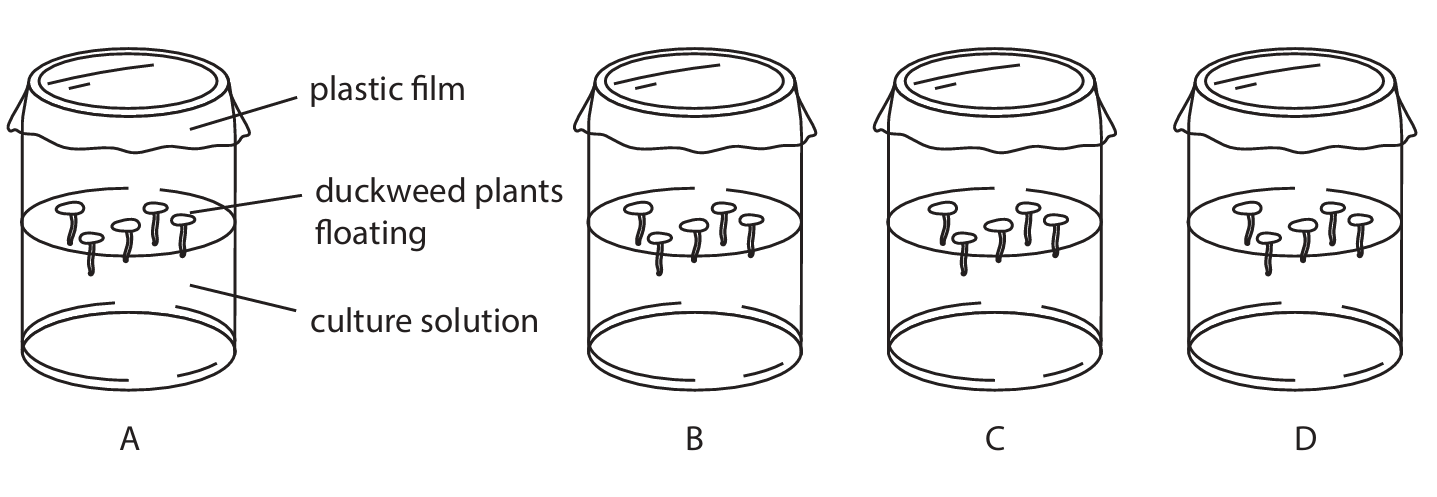
(a)(i) An answer that makes reference to two of the following:
• sunlight / light / eq (1)
• volume / mass of solution / eq (1)
• number of plants / number of leaves / size of leaves / size of plant / health of leaves (at start) / eq (1)
• same species / use duckweed / eq (1)
• time / duration / eq (1)
• all jars covered / eq (1)
(a)(ii) An explanation that makes reference to two of the following:
• it (complete solution) (contains all minerals) so produces normal growth / ideal growth / eq (1)
• distilled water contains no minerals / plant would be lacking all minerals / would not grow normally / eq (1)
• so any difference in growth due to missing one mineral / eq (1)
(a)(iii) An explanation that makes reference to two of the following:
• photosynthesis / eq (1)
• to produce glucose (for respiration) / eq (1)
• for growth / to allow normal growth / eq (1)
(a)(iv) • mineral that is missing / absent from solution / minerals present / composition of solution / solution / eq (1)
(b)(i) • (quantitative / number of leaves) uses number / is measured / counted / and (qualitative / size of leaf) is a type / category / uses words / observed / subjective / opinion / eq (1)
(b)(ii) An answer that makes reference to 6 of the following:
1. complete / no minerals lacking / A have most leaves / largest leaves / eq (1)
2. complete / no minerals lacking / A have dark green / greenest leaves / eq (1)
3. minus nitrate / B have few / least / smaller / smallest leaves / less green / yellow / eq (1)
4. nitrate required for amino acid / protein / chlorophyll / chloroplasts / nitrate required for growth / eq (1)
5. minus magnesium / C have few / smaller / less green / yellow / eq (1)
6. magnesium required for chlorophyll / chloroplasts / photosynthesis / eq (1)
7. minus iron / D have few / smaller leaves / less green / least green / yellow / eq (1)
8. iron required for chlorophyll / chloroplasts / photosynthesis / eq (1)
9. Not repeated / not reliable / few plants used / eq (1)
▶️ Answer/Explanation
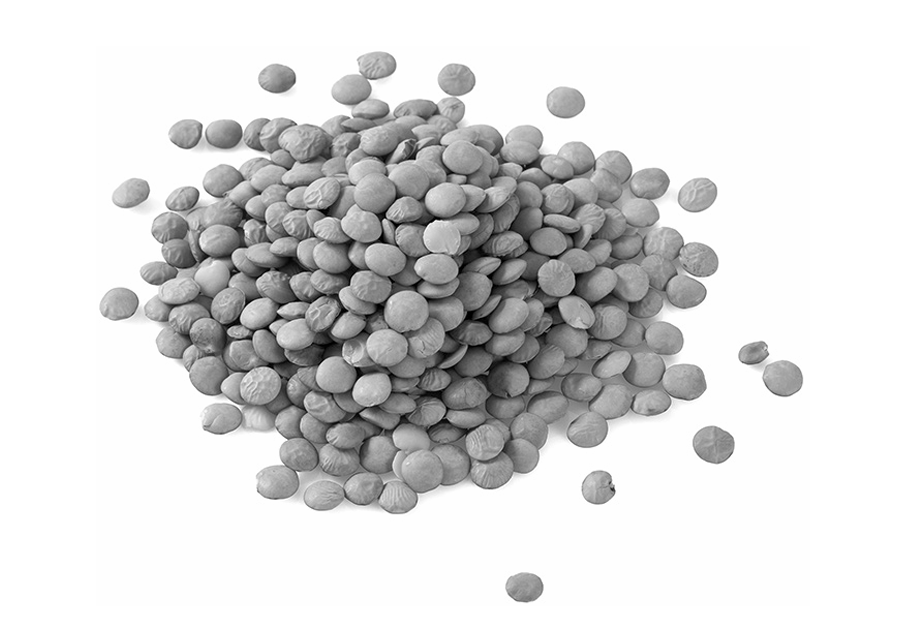
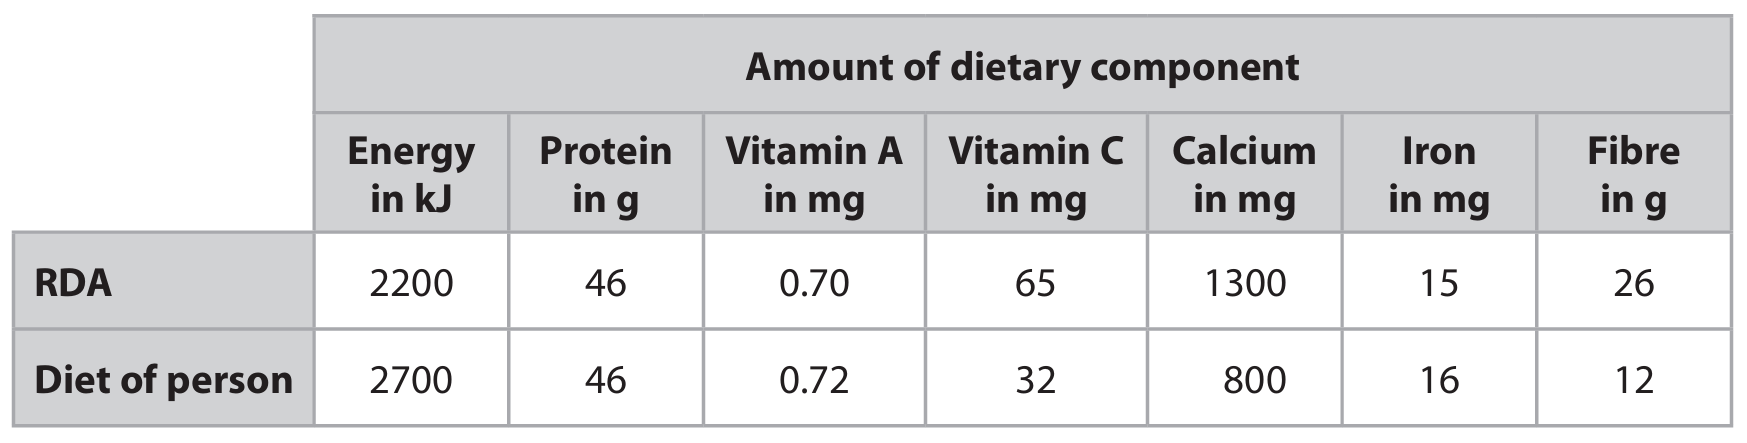
(a) The lentils are transported from the mouth to the stomach by the process of peristalsis. This involves waves of muscle contraction along the walls of the oesophagus (gullet), which push the food bolus downwards.
(b)(i) One component of a balanced diet not shown in the table is dietary fibre (or roughage). Other acceptable answers include water or another named vitamin/mineral not listed (e.g., vitamin A or iron).
(b)(ii)
- Vitamin C: A long-term dietary shortage of vitamin C can lead to a disease called scurvy. This condition is characterized by symptoms such as bleeding gums, slow wound healing, weakness, and joint pain, due to the role of vitamin C in collagen formation.
- Calcium: A long-term dietary shortage of calcium can lead to weak bones and an increased risk of developing osteoporosis (brittle bones) or rickets (in children), as calcium is essential for bone mineralization and strength.
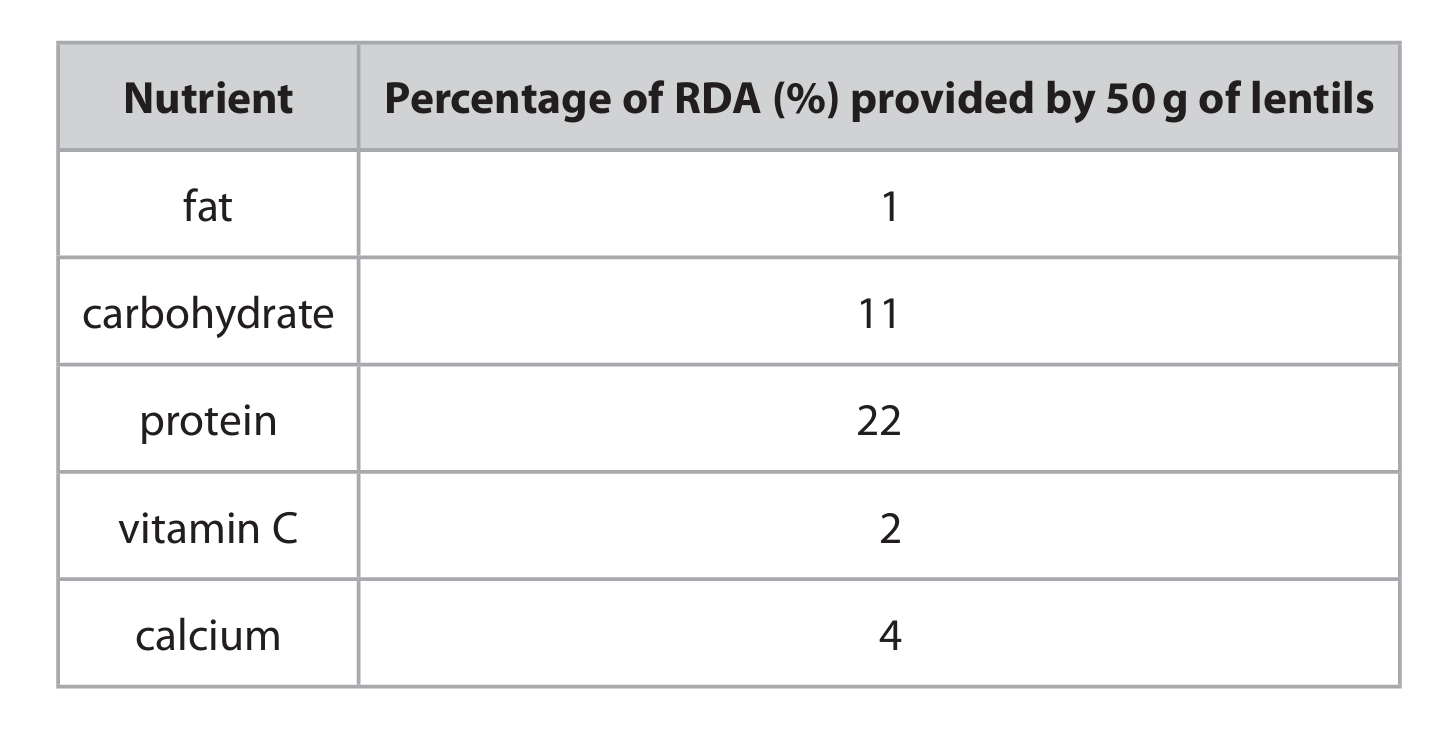
(b)(iii) The mass of lentils needed each day is 230 g (to two significant figures).
Calculation: If 50 g of lentils provides 22% of the RDA for protein, then 1% of the RDA is provided by \( \frac{50}{22} \) g. Therefore, 100% of the RDA (the full amount) is provided by \( \frac{50}{22} \times 100 = 227.2727… \) g. Rounded to two significant figures, this is 230 g.
(b)(iv) Protein digestion involves several stages and enzymes:
- Digestion begins in the stomach. The enzyme pepsin (a protease), which is active in the acidic conditions created by hydrochloric acid, breaks down large protein molecules into smaller polypeptides.
- The partially digested food (chyme) then moves into the small intestine, specifically the duodenum.
- Here, enzymes from the pancreas (such as trypsin and chymotrypsin) are released and further break down the polypeptides into even shorter peptide chains and individual amino acids.
- Finally, enzymes produced by the lining of the small intestine itself (e.g., peptidases) complete the digestion by breaking down the remaining peptides into amino acids, which are then absorbed into the bloodstream.
▶️ Answer/Explanation
(a) 6CO2 + 6H2O → C6H12O6 + 6O2
Explanation: The balanced equation for photosynthesis shows that six molecules of carbon dioxide and six molecules of water are used as reactants. In the presence of light energy and chlorophyll, these are converted into one molecule of glucose (a sugar) and six molecules of oxygen gas, which is released as a byproduct.
(b)(i) To destarch the leaves / remove starch / so no starch is present (in leaves) at the start of the experiment.
Explanation: Placing the plant in darkness for 24 hours ensures that any starch already present in the leaves is used up by the plant for respiration or converted to other forms for transport and storage. This is crucial because it means that any starch detected after the experiment must have been produced during the 24-hour light period, allowing the student to accurately investigate the effect of light on photosynthesis.
(b)(ii)

Explanation: Iodine solution turns blue-black in the presence of starch. Starch is only produced in areas of the leaf where photosynthesis occurs, which requires both chlorophyll (found only in the green parts) and light. Therefore, the green areas that were exposed to light will test positive for starch and appear black. The white areas lack chlorophyll and cannot photosynthesize, so they will not produce starch and will not turn black. The green area that was covered by the black paper was deprived of light and also could not photosynthesize, so it will not produce starch and will not turn black.
(c) A designed investigation that includes references to six of the following points:
- Control Variable: Plant ivy in areas with different exposures to light (e.g., a shaded area and an unshaded area).
- Organism: Use the same species/type of ivy. Use plants of the same age or starting size to ensure a fair test.
- Repeats: Repeat the investigation with multiple leaves and multiple plants in each light condition to improve reliability.
- Measurement 1: Measure the size of the leaves. This could be done by measuring their length, width, or calculating their surface area using a ruler.
- Measurement 2: Grow the ivy plants for a specified, identical period of time (e.g., one month) before taking measurements.
- Standardization 1: Control other factors that could affect leaf size, such as temperature, humidity, and carbon dioxide concentration.
- Standardization 2: Ensure the plants receive the same amounts of water, minerals, and the same type of soil to ensure any difference in leaf size is due to light intensity alone.
Example Investigation Description:
To investigate this, I would obtain several young ivy plants of the same species and similar size. I would place half of them in a very sunny location and the other half in a heavily shaded location. All plants would be planted in the same type of soil and would be given the same amount of water each day. I would leave the plants to grow for two months. After this time, I would randomly select 10 leaves from different parts of several plants in each group. I would measure the length and width of each leaf and calculate the average leaf size for the sunny group and the average leaf size for the shaded group. By comparing these averages, I could determine if the amount of sunlight affects leaf size. Using multiple plants and multiple leaves ensures the results are reliable.
▶️ Answer/Explanation
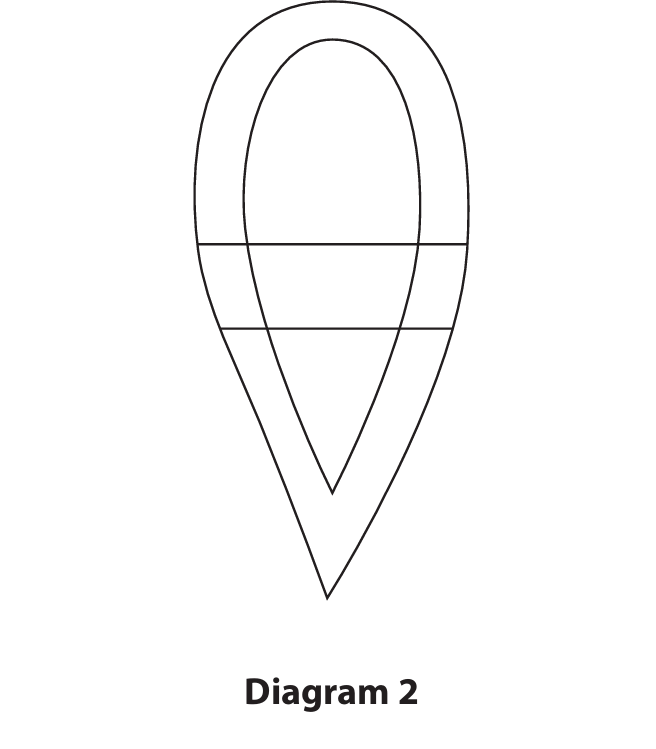
(a)(i) C (protein)
Explanation: The outer coat or capsid of a virus is primarily made up of protein subunits called capsomeres. This protein coat protects the viral genetic material inside (which, in this case, is RNA). Cellulose (A) is a polysaccharide that makes up plant cell walls. Chitin (B) is a polysaccharide found in the exoskeletons of insects and fungal cell walls. Starch (D) is a carbohydrate storage molecule in plants. Viruses do not contain these substances in their structure.
(a)(ii) Magnification = × 76,700 (or approximately × 77,000)
Explanation: To calculate magnification, we use the formula:
Magnification = Size of Image ÷ Size of Real Object
First, measure the length of the virus particle in the photograph (the image size). Assuming the measured length is 23 mm (this value can vary slightly between 22–24 mm).
Convert to micrometers (μm): 23 mm = 23,000 μm.
Actual size = 0.3 μm.
Magnification = 23,000 μm ÷ 0.3 μm ≈ 76,667.
Therefore, magnification ≈ × 76,700 (or × 77,000 rounded).
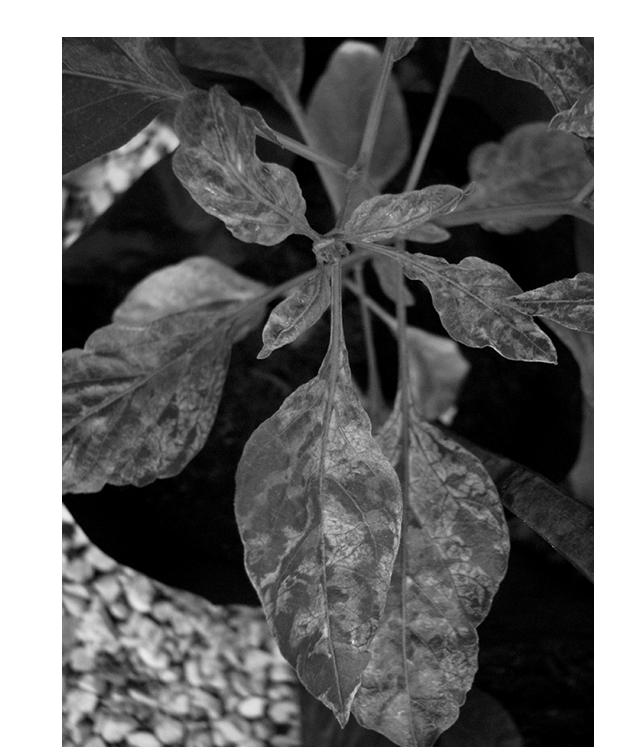
(b) Infected plants grow more slowly due to a cascade of effects caused by the virus halting chloroplast production. Chloroplasts are the organelles where photosynthesis occurs. Photosynthesis is the process that uses light energy to convert carbon dioxide and water into glucose, providing the plant with chemical energy and the building blocks for growth.
With fewer or no chloroplasts, the plant cannot perform photosynthesis effectively. This leads to a severe reduction in glucose production. Glucose is crucial for respiration (releasing energy for cellular processes) and for synthesizing starch and cellulose. A deficiency in energy and structural materials directly impedes growth.

▶️ Answer/Explanation
(a)(i) A (aphid)
Explanation: A primary consumer is an organism that eats producers. In this food web, the oak tree is the producer. The aphid feeds directly on the oak tree, making it the primary consumer. The blackbird and fox are consumers that eat other animals, so they are secondary or tertiary consumers.
(a)(ii) D (all the different species in the area)
Explanation: A community is defined as all the populations of different species living and interacting in a particular area at the same time. Option A describes an ecosystem (community + habitat). Option B describes a single population. Option C also describes an ecosystem.
(b)(i)
Answer: A pyramid of numbers represents the number of organisms at each trophic level. The base should be the producer (oak trees). Since there are 4 oak trees, the bar should be drawn to represent this number. The next level is the primary consumer (mice), with a bar for 20 mice. The top level is the secondary consumer (foxes), with a bar for 2 foxes. The pyramid should be drawn to scale, meaning the relative sizes of the bars should accurately reflect the numbers (e.g., the mouse bar should be 5 times wider than the fox bar, and the oak tree bar should be 5 times narrower than the mouse bar). The pyramid should be labelled with the names of the organisms and the trophic levels.
[A drawn pyramid with ‘Fox (2)’ at the top, ‘Mouse (20)’ in the middle, and ‘Oak Tree (4)’ at the bottom, all bars correctly scaled and labelled.]
(b)(ii) 100 kJ
Explanation: First, calculate the total energy transferred to all the mice. 8% of 25,000 kJ is transferred.
Calculation: \( \frac{8}{100} \times 25,000 = 2,000 \) kJ.
This is the total energy for 20 mice. To find the mean for one mouse, divide this total by 20.
Calculation: \( \frac{2,000}{20} = 100 \) kJ.
So, the mean amount of energy transferred to the biomass of one mouse each year is 100 kJ.
(b)(iii)
Explanation: Energy is lost at each stage of a food chain, which is why the percentage transferred is so low. The reasons include:
• Not all parts of the oak tree are eaten by the mice (e.g., deep roots, thick bark).
• Some of the energy absorbed by the mice is lost through respiration to fuel metabolic processes like movement and maintaining body temperature. This energy is lost as heat.
• Some of the ingested material is egested as faeces because it cannot be digested or absorbed.
• Energy is also lost in excretory materials, such as urine.
These losses mean that only a small fraction (in this case, 8%) of the energy from the oak trees’ biomass is available to be stored in the mice’s biomass for growth.
▶️ Answer/Explanation
(a)(i) Answer: B (carbon, hydrogen, and oxygen only)
Explanation: Carbohydrates are organic compounds composed solely of carbon (C), hydrogen (H), and oxygen (O) atoms. The general formula for many carbohydrates is Cₓ(H₂O)ᵧ, which is why they are called “carbohydrates” or “hydrates of carbon”. Lactose, the sugar in milk, is a disaccharide made up of these three elements. Options including nitrogen are incorrect as nitrogen is found in proteins and nucleic acids, not in carbohydrates.
(a)(ii) Answer: Use the biuret test.
Explanation: To test for protein in a sample of milk, you would perform the biuret test. First, add a few drops of sodium hydroxide solution (NaOH) to the milk sample to make it alkaline. Then, add a few drops of copper(II) sulfate solution. If protein is present, the solution will change color from blue to a violet or purple hue. This color change occurs due to the reaction between the peptide bonds in the proteins and the copper ions in an alkaline environment.
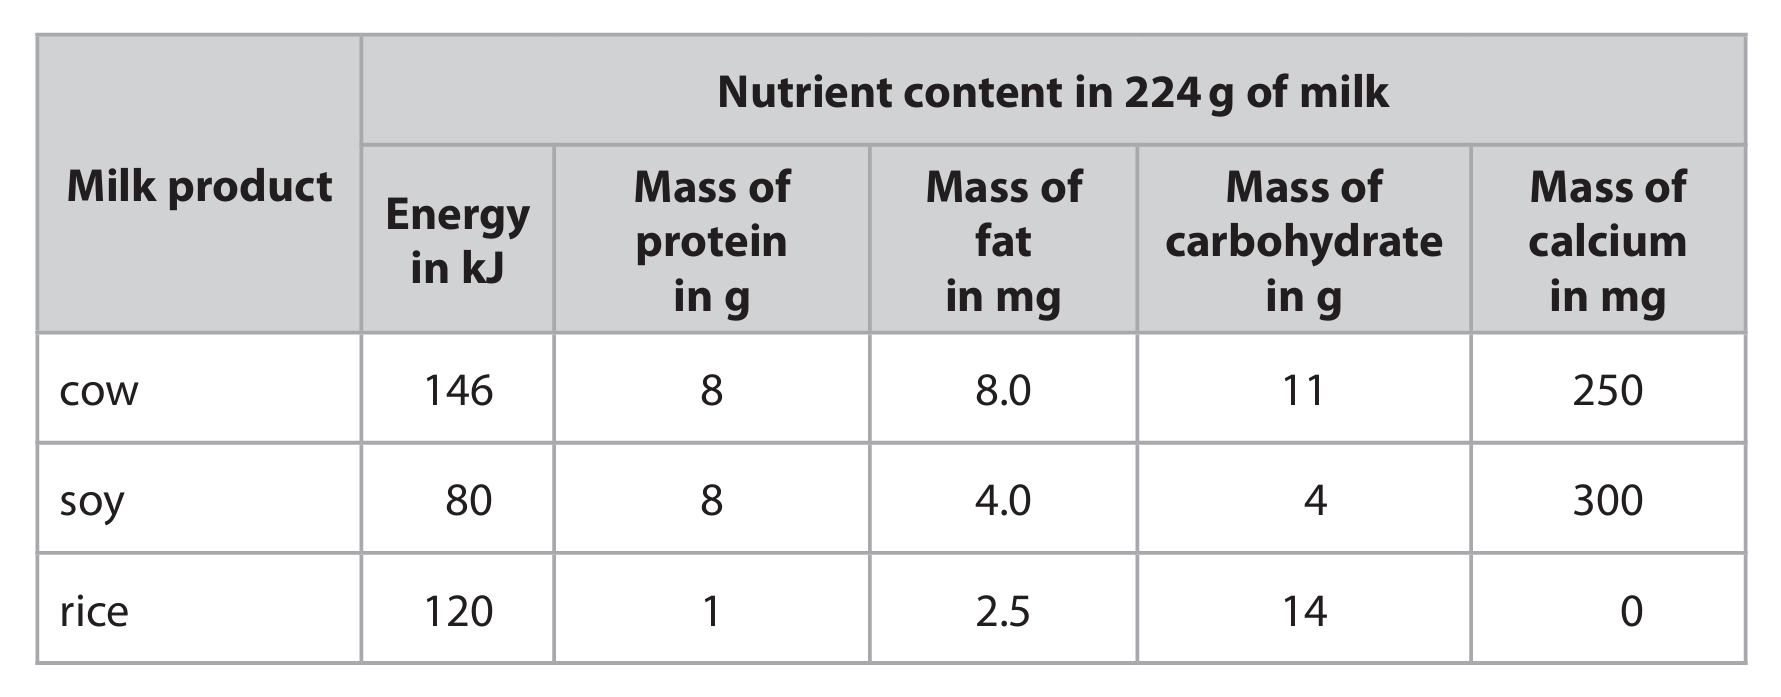
(b)(i) Answer: 1254.4 g (accept 1250 g or 1300 g)
Explanation: This is a simple proportionality calculation based on the data provided. The table states that 224 g of cow’s milk contains 250 mg of calcium. We need to find the mass (X) that contains 1400 mg.
The calculation is set up as: (224 g / 250 mg) = (X g / 1400 mg)
Solving for X: X = (224 g × 1400 mg) / 250 mg
First, calculate 224 × 1400 = 313,600
Then, divide by 250: 313,600 / 250 = 1254.4
Therefore, the mass of cow’s milk needed is 1254.4 grams. This can be rounded to 1250 g or 1300 g considering significant figures or practical measurement.
(b)(ii) Answer: When evaluating soy milk and rice milk as replacements for cow’s milk for children, we must compare their nutritional profiles to cow’s milk and consider the dietary needs of growing children.
Regarding Soy Milk: Soy milk has the same amount of protein as cow’s milk (8 g per 224 g serving), which is crucial for growth and repair in children. It also contains more calcium (300 mg vs. 250 mg). However, it provides significantly less energy (80 kJ vs. 146 kJ) and less fat (4.0 mg vs. 8.0 mg). While lower fat can be beneficial, fats are a dense energy source important for active children and for absorbing fat-soluble vitamins. The carbohydrate content is also lower (4 g vs. 11 g). The lower energy content might mean a child needs to consume more overall to meet their energy requirements, potentially leading to less room for other varied foods.
Regarding Rice Milk: Rice milk is a very poor source of protein compared to cow’s milk (1 g vs. 8 g). A severe lack of protein can lead to conditions like kwashiorkor, impairing growth and development. It contains no calcium, which is essential for building strong bones and teeth; a deficiency can lead to rickets. While its energy content (120 kJ) is closer to cow’s milk than soy milk is, and it has more carbohydrates (14 g), these are not sufficient to offset the critical lack of protein and calcium. The fat content is also lower (2.5 mg).
Conclusion: Soy milk, with its high protein and calcium content, is a much more suitable replacement for cow’s milk than rice milk. It is nutritionally closer, though attention may need to be paid to ensuring the child gets enough energy and fats from other dietary sources. Rice milk is not a suitable replacement due to its extremely low protein and zero calcium content, which would be detrimental to a child’s growth and development if used as a primary milk source.
▶️ Answer/Explanation
(a) 6CO2 + 6H2O
Explanation: The balanced equation for photosynthesis shows that six molecules of carbon dioxide react with six molecules of water in the presence of light energy and chlorophyll to produce one molecule of glucose and six molecules of oxygen.
(b)(i) The student could control temperature by using a water bath to maintain a constant temperature throughout the experiment.
Explanation: Temperature significantly affects enzyme activity in photosynthesis, including the enzymes involved in the light-independent reactions. By placing the test tube in a water bath set at a specific temperature (e.g., 25°C), the student ensures that temperature remains constant and doesn’t become a variable affecting the results.
(b)(ii) As the distance of the lamp increases, light intensity decreases. This reduces the rate of photosynthesis, shown by fewer oxygen bubbles. In the 5% solution, the rate stays constant between 5–15 cm, indicating CO2 is limiting. Beyond 15 cm, light becomes limiting. In the 10% solution, light is limiting across all distances as the rate steadily decreases.
Explanation: Light intensity drives the light-dependent reactions. The inverse square law means light intensity decreases sharply with distance. CO2 is used in the Calvin cycle. The plateau with 5% CO2 at close distances shows CO2 limitation, while higher CO2 (10%) allows photosynthesis to respond directly to light changes.
(b)(iii) The student could collect and measure the volume of oxygen produced instead of counting bubbles.
Explanation: Bubbles can vary in size, making counting imprecise. Using a graduated syringe or inverted measuring cylinder to measure oxygen volume provides a more accurate and quantitative measure of the rate of photosynthesis.
(b)(iv) The student could repeat each measurement multiple times and calculate the mean number of bubbles.
Explanation: Repeating experiments helps identify anomalies and reduces the effect of random errors. Calculating a mean from repeated trials increases reliability and confidence in the results.
▶️ Answer/Explanation
(a) (i)
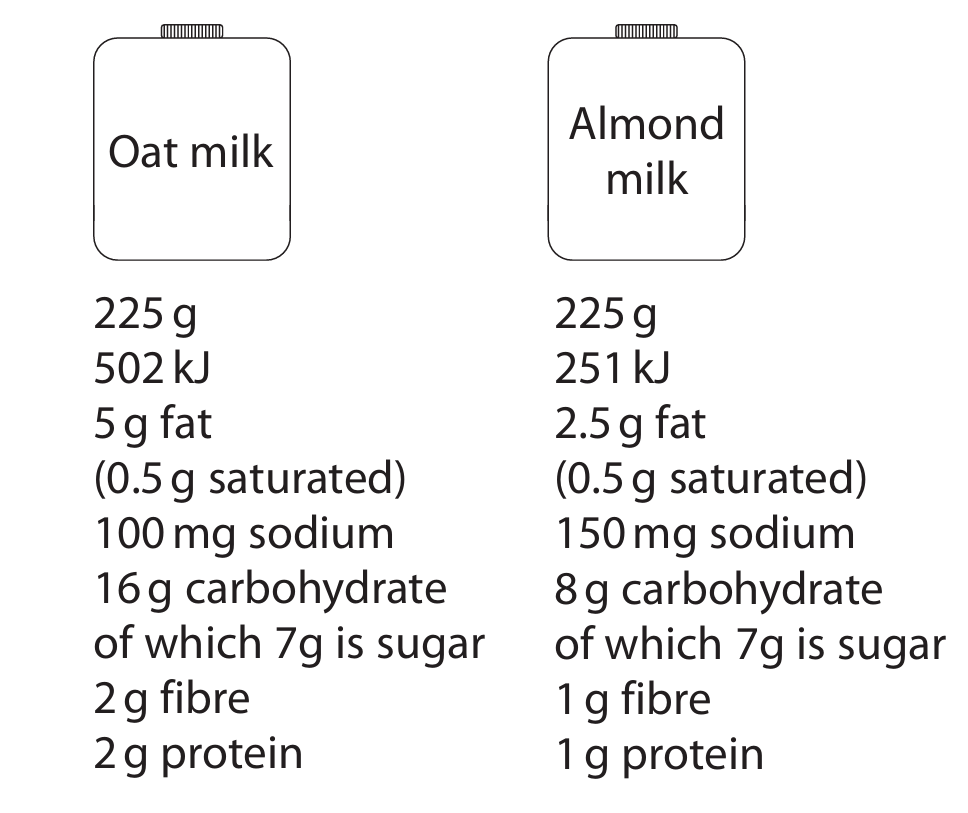
Almond milk would be the most suitable for a person trying to lose weight.
Explanation: Weight loss fundamentally depends on achieving a negative energy balance, where energy expenditure exceeds energy intake. When comparing the two milks per 225g serving, almond milk provides only 251 kJ of energy, which is half the energy content of oat milk (502 kJ). Consuming fewer calories from beverages can significantly contribute to an overall calorie deficit without requiring drastic changes to solid food intake.
Furthermore, almond milk contains only 2.5g of total fat, compared to 5g in oat milk. While the saturated fat content is the same (0.5g), a lower overall fat intake can be beneficial for weight management as fats are energy-dense. Almond milk also has half the carbohydrate content (8g vs. 16g) and half the protein content (1g vs. 2g). Although protein is important for satiety (feeling full), the difference of 1g is minimal in the context of an entire diet. The significantly lower energy (calorie) content of almond milk is the most decisive factor for weight loss. It is also important to note that both milks contain the same amount of sugar (7g), so there is no advantage for either on that point. A successful weight loss strategy involves the entire diet and exercise regimen, but choosing lower-calorie alternatives like almond milk can be a simple and effective step.
(a) (ii)
Explanation: A person might choose non-dairy milk like oat or almond milk over cow’s milk for several reasons. A very common reason is lactose intolerance, where an individual lacks sufficient amounts of the enzyme lactase needed to digest the lactose sugar found in cow’s milk, leading to digestive discomfort. Others may have a genuine milk allergy (an immune response to milk proteins). People following a vegan lifestyle abstain from all animal products, including cow’s milk. Some may also choose plant-based milks due to personal preferences, such as a desire to reduce saturated fat intake (though many plant milks are low in sat fat) or due to concerns about animal welfare in the dairy industry.
(b)
Explanation: To test a milk sample for glucose, a student could perform the Benedict’s test. First, they would place a sample of the milk in a clean test tube. It is often advisable to dilute the milk or filter it to reduce its opacity, which can make colour changes easier to see. Then, they would add an equal volume of Benedict’s reagent (a blue solution containing copper sulfate) to the test tube. The test tube would be placed in a water bath and heated at about 70-80°C for 5 minutes. If glucose (a reducing sugar) is present, the blue Benedict’s reagent will change colour. The final colour indicates the approximate concentration: green for a low concentration, yellow/orange for a medium concentration, and a brick-red precipitate for a high concentration of reducing sugar. The appearance of any colour other than blue indicates a positive test for reducing sugars like glucose.
(c)
Explanation: The special proteins in human breast milk that provide immunity are antibodies, specifically a type called IgA. These antibodies help protect the baby through a process called passive immunity. The mother’s body produces these antibodies in response to pathogens (like bacteria and viruses) she has encountered. The antibodies are then secreted into her breast milk. When the baby consumes the milk, these antibodies line the baby’s digestive and respiratory tracts. They work by recognizing and binding to specific antigens on the surface of pathogens. This binding can neutralize the pathogens, preventing them from infecting the baby’s cells, or it can clump them together (agglutination) making it easier for the baby’s immune cells to identify and destroy them. This provides crucial protection for the newborn while its own immune system is still developing and is not yet fully capable of fighting off infections on its own.


▶️ Answer/Explanation
(a) 6CO₂ + 6H₂O → C₆H₁₂O₆ + 6O₂
Explanation: The balanced chemical equation for photosynthesis shows that six molecules of carbon dioxide react with six molecules of water in the presence of light energy and chlorophyll to produce one molecule of glucose and six molecules of oxygen. The oxygen is released as a by-product, often measured as bubbles in experiments.
(b)(i) distance = 2.5 cm
Explanation: From the graph, a rate of 78 bubbles per minute corresponds to a light intensity of 0.16 arbitrary units. Using the formula: light intensity = 1/d² → 0.16 = 1/d² → d² = 1/0.16 = 6.25 → d = √6.25 = 2.5 cm.
(b)(ii) The rate of photosynthesis increases with increasing light intensity, but the relationship is not linear. At low light intensities, the rate rises steeply. At higher light intensities, the rate of increase slows and eventually plateaus, indicating that light is no longer the limiting factor.
(b)(iii) Between 0.4 and 0.8 arbitrary units, the rate of photosynthesis continues to increase, but at a slower rate compared to lower light intensities. This suggests that another factor (e.g., carbon dioxide concentration or temperature) is becoming limiting. The curve is flattening, showing diminishing returns from further increases in light intensity.
▶️ Answer/Explanation
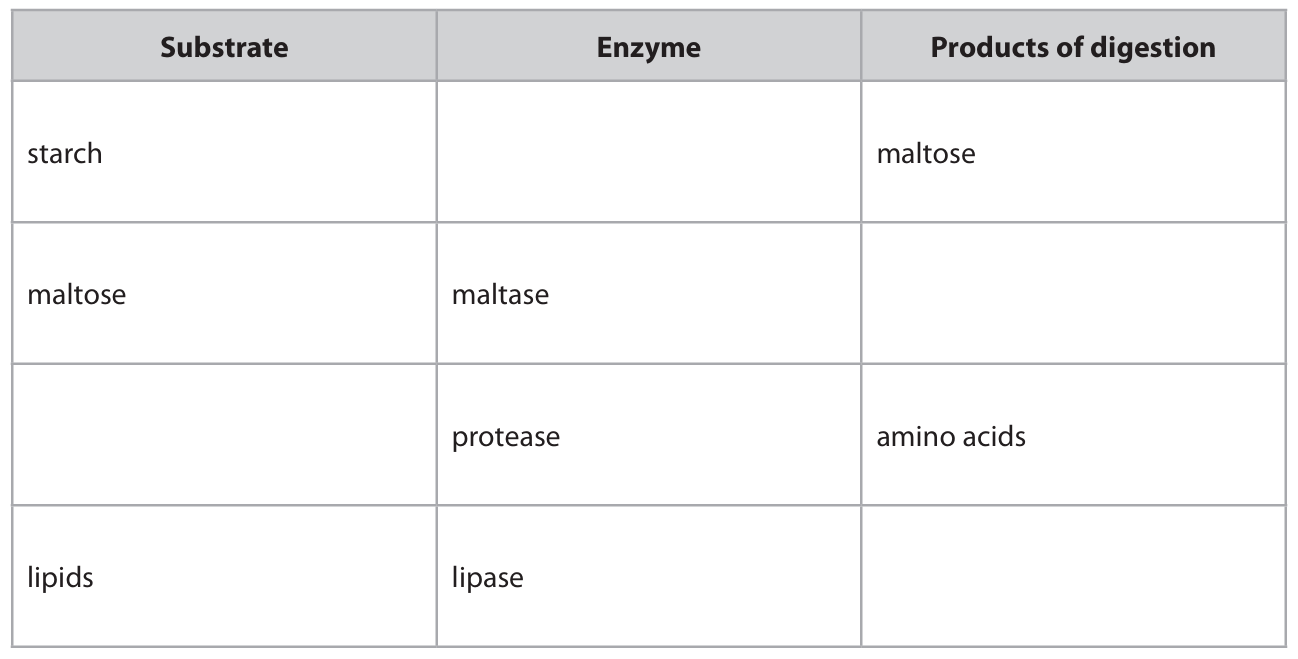
(a)
| Substrate | Enzyme | Products of digestion |
|---|---|---|
| starch | amylase | maltose |
| maltose | maltase | glucose |
| proteins / peptides / polypeptides | protease | amino acids |
| lipids | lipase | fatty acids / glycerol |
Explanation: The table is completed using knowledge of digestive enzymes and their specific substrates and products. Starch is broken down by the enzyme amylase into maltose. Maltose is further broken down by maltase into glucose. The enzyme protease breaks down proteins (or peptides/polypeptides) into amino acids. Finally, lipids are digested by the enzyme lipase into fatty acids and glycerol.
(b)
Designed Investigation:
To investigate the effect of vinegar (a weak acid) on the digestion of starch, one could set up the following experiment:
- Control Variable (C): Use different concentrations of vinegar (e.g., 0%, 1%, 5%, 10% vinegar solutions) or a range of pH values to treat the starch samples. This allows you to see how the acidity level affects the rate of digestion. (1 mark)
- Organism/Variable (O): Use the same mass of starch for each test. This could be in the form of a flour paste, a piece of bread, or a solution of known starch concentration. Keeping the amount of starch constant ensures that any differences observed are due to the vinegar and not the amount of substrate. (1 mark)
- Repeats (R): Repeat the experiment for each concentration of vinegar to ensure the results are reliable and to identify any anomalies. (1 mark)
- Measurement 1 (M1): Use iodine solution to test for the presence of starch at regular time intervals. Iodine turns blue-black in the presence of starch. (1 mark)
- Measurement 2 (M2): Measure the time it takes for the starch to be completely digested in each sample, indicated by the iodine test no longer turning blue-black (it remains orange/yellow). Alternatively, one could use Benedict’s test to measure the appearance of the sugar product (maltose) over time. (1 mark)
- Standardization (S1 & S2): Control all other variables to make it a fair test. This includes:
- Using a water bath to maintain the same temperature for all samples. (S1)
- Using the same volume and concentration of the amylase enzyme solution.
- Using the same volume of the vinegar solutions (if concentration is the variable).
- Allowing the same reaction time for each test before performing the iodine test. (S2)
(1 mark)
Explanation: This investigation is designed to be a fair test. The independent variable is the concentration of vinegar (acidity). The dependent variable is the time taken for starch digestion or the amount of product formed. By controlling all other factors (temperature, enzyme concentration, starch amount, volume), any change in the digestion rate can be confidently attributed to the effect of the vinegar. Iodine is used as a qualitative test for starch disappearance, providing a clear visual endpoint for the reaction. Repeats ensure the results are consistent.

▶️ Answer/Explanation
(a)(i) Peristalsis. Waves of muscular contractions.
Explanation: Food is moved down the oesophagus by a process called peristalsis. This involves rhythmic, wave-like contractions of the muscular walls of the oesophagus. These contractions squeeze the food bolus, pushing it along the digestive tract towards the stomach.
(a)(ii) C
Explanation: Bile is produced by the liver. In the diagram, structure C is labelled as the liver. The other structures are incorrect: A is the stomach, B is the pancreas, and D is the gall bladder (which stores and concentrates bile but does not produce it).
(a)(iii) Bile neutralises stomach acid and emulsifies fats.
Explanation: Bile has two main roles in digestion. First, it is alkaline and neutralises the hydrochloric acid from the stomach, creating the optimum alkaline pH for pancreatic enzymes to work in the small intestine. Second, bile salts emulsify lipids (fats). This means they break large fat globules into tiny droplets, massively increasing the surface area for the lipase enzymes to work on, which speeds up the digestion of fats.
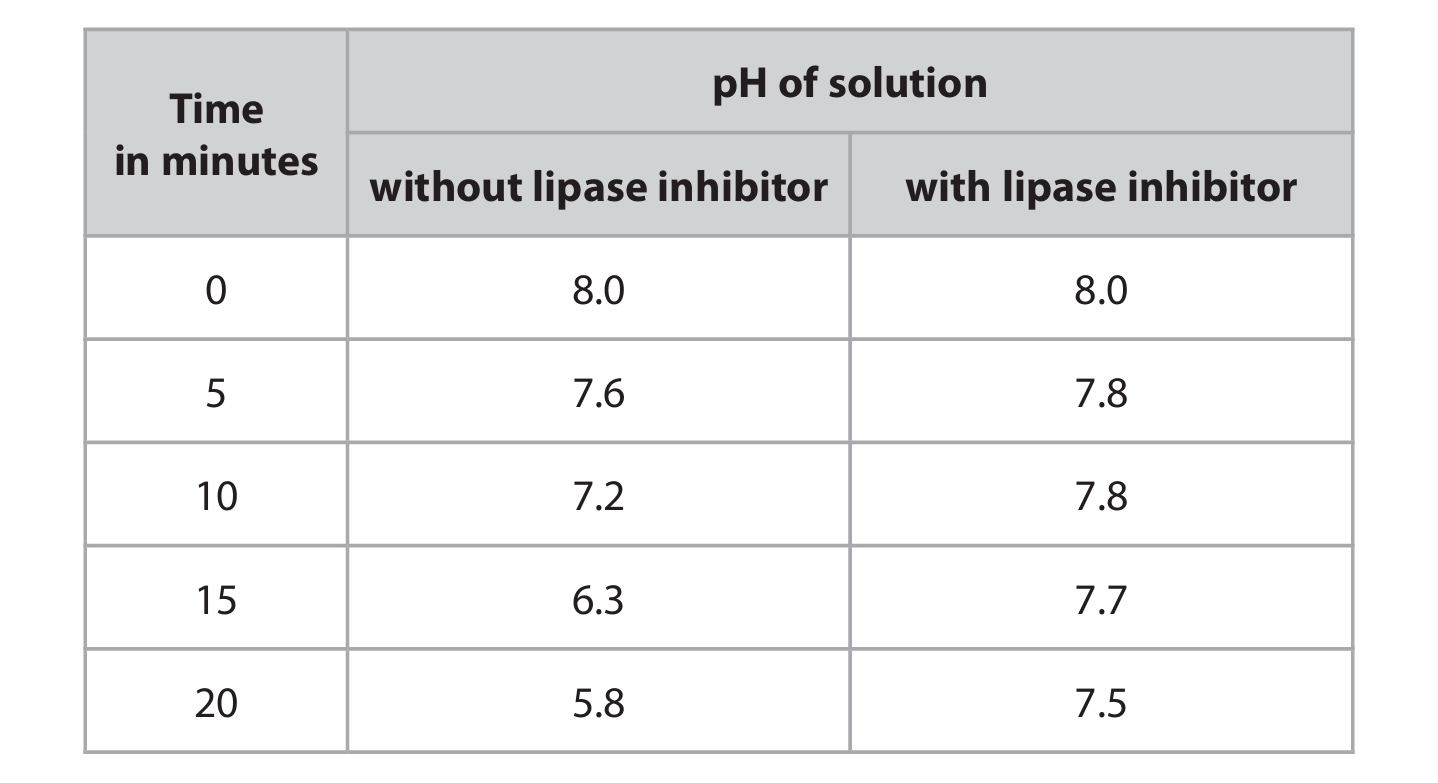
(b)(i) 0.11 per minute
Explanation: The mean rate of pH change is calculated by finding the total change in pH and dividing it by the total time. The pH without inhibitor changed from 8.0 to 5.8, a total change of \(8.0 – 5.8 = 2.2\). This change happened over 20 minutes. Therefore, the mean rate is \(2.2 \div 20 = 0.11\) pH units per minute.
(b)(ii) The pH falls faster in the solution without the inhibitor because fats are broken down into fatty acids.
Explanation: Lipase enzymes break down lipids (fats) into fatty acids and glycerol. Fatty acids are acidic, so their production causes the pH of the solution to decrease. In the test tube without the inhibitor, lipase is active, leading to rapid fat digestion and a significant drop in pH. In the test tube with the inhibitor, the lipase enzyme is blocked from working effectively. Therefore, far fewer fatty acids are produced, and the pH remains much higher and changes more slowly.
(b)(iii) Discussion points include lower blood lipid levels with the inhibitor, potential side effects, and limitations of the study.
Explanation: The data suggests the lipase inhibitor could be a useful treatment for obesity. The blood lipid concentration increased much less in the volunteers who took the inhibitor (to 38, 42, 43 mg/dm³) compared to two of the three volunteers who did not take it (62, 64 mg/dm³). This indicates that the inhibitor successfully reduced the amount of fat absorbed from the olive oil into the bloodstream. Since less fat is absorbed, less fat would be stored in the body, potentially leading to weight loss.
However, there are significant drawbacks and limitations. Two out of the three volunteers taking the inhibitor reported abdominal pains, suggesting it may cause unpleasant side effects. It’s also important to note that one volunteer without the inhibitor also had a relatively low final lipid reading (45 mg/dm³), showing there can be natural variation.
The study itself is very small, with only three people in each group, so its results are not very reliable. Other factors like the volunteers’ age, sex, overall diet, and activity levels were not controlled, and these could all influence obesity. The experiment only measured short-term fat absorption after a single large dose of oil; it did not actually measure long-term weight loss, which is the ultimate goal of an obesity treatment.
In conclusion, while the inhibitor shows promise in reducing fat absorption, its side effects and the need for much more extensive, long-term research mean it cannot be confidently recommended as a treatment based on this data alone.


▶️ Answer/Explanation
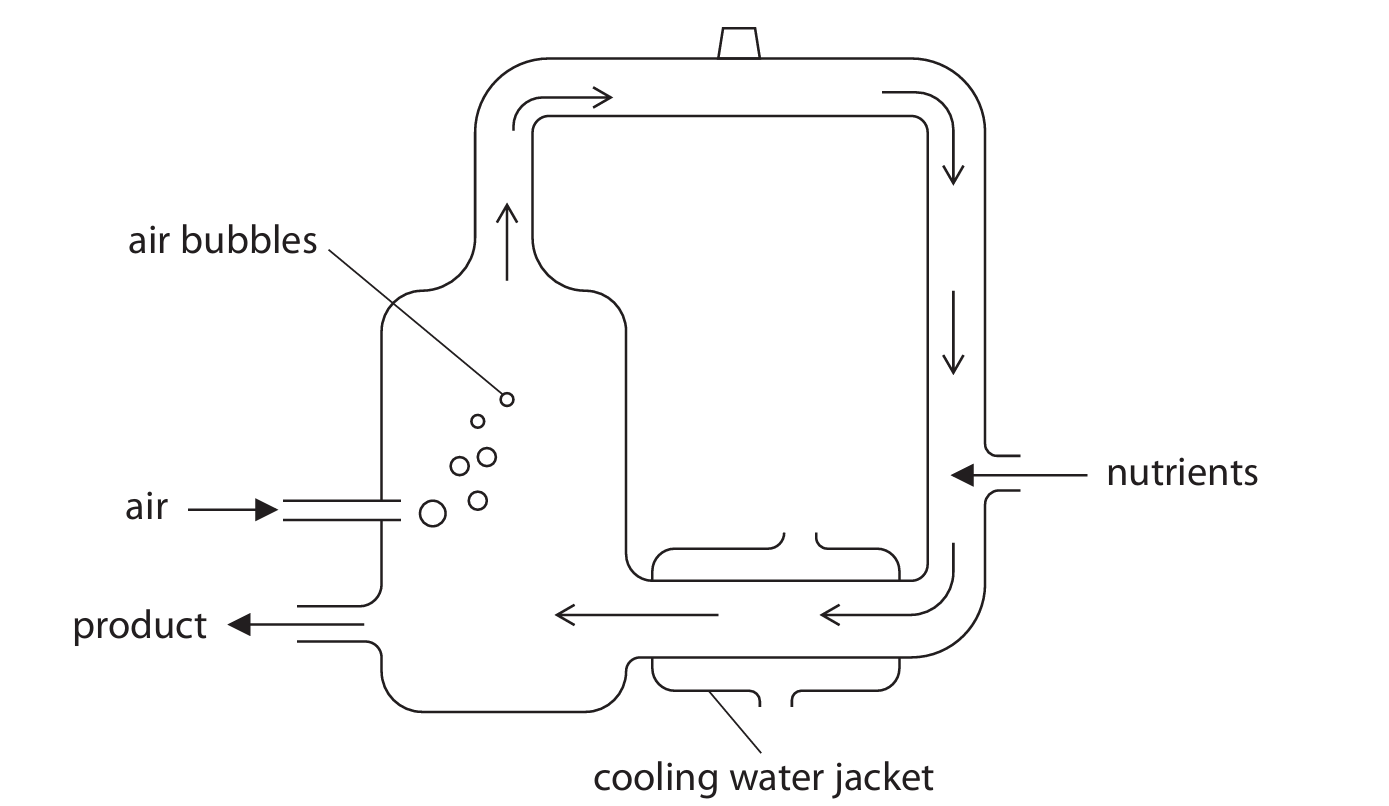
(a)(i) Air is bubbled into the fermenter to provide oxygen. The oxygen is required by the fungus for aerobic respiration. Aerobic respiration is the process that breaks down glucose to release energy, which the fungus needs for growth and to produce mycoprotein. Without a sufficient oxygen supply, the fungus might resort to less efficient anaerobic respiration, which would slow down its growth and reduce the yield of mycoprotein.
(a)(ii) The fermenter is cleaned with steam to sterilize it. Steam cleaning kills any pathogens or other unwanted microorganisms that might be present. This is crucial to prevent contamination of the culture. If other microorganisms were present, they could compete with the fungus for nutrients, potentially produce harmful toxins, or spoil the mycoprotein product, affecting its safety and quality. Steam is used because it is an effective sterilizing agent that, after condensing to water, does not leave behind chemical residues that could affect the product.
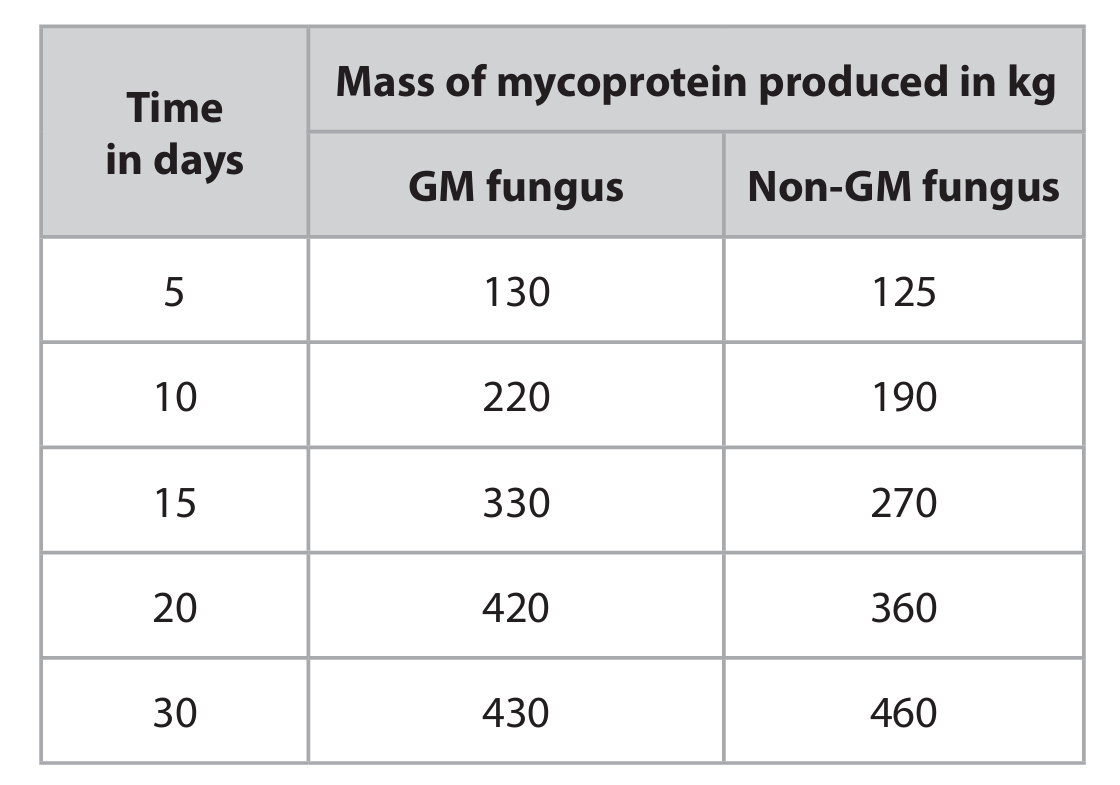
(b)(i) A line graph should be plotted with ‘Time (days)’ on the x-axis and ‘Mass of mycoprotein produced (kg)’ on the y-axis. Two lines should be drawn: one for the GM fungus and one for the non-GM fungus. The points for the GM fungus are (5,130), (10,220), (15,330), (20,420), (30,430). The points for the non-GM fungus are (5,125), (10,190), (15,270), (20,360), (30,460). These points should be joined with straight lines. A key must be included to distinguish between the two lines.
(b)(ii) The scientist’s claim is only partially supported by the data. The GM fungus does grow faster and produce more mycoprotein in the first 20 days (420 kg vs 360 kg), which could be advantageous for large-scale production if a quick yield is desired. However, by day 30, the non-GM fungus has produced a higher final yield (460 kg vs 430 kg). Furthermore, the GM fungus’s production appears to be leveling off or slowing down significantly after day 20, while the non-GM fungus is still increasing. Therefore, whether the GM fungus is “better” depends on the specific production goals: it is better for a shorter, faster production cycle, but the non-GM fungus is better for maximizing the total yield over a longer period.
(b)(iii) Whether mycoprotein is healthier than lamb for a growing human involves a trade-off between different nutritional components.
Arguments for mycoprotein being healthier:
- Mycoprotein contains significantly less fat (3.0g vs 25.5g per 100g) and no cholesterol (0.0g vs 0.1g). A diet lower in saturated fats and cholesterol is associated with a reduced risk of obesity and heart disease.
- Mycoprotein contains much more fibre (6.0g vs 0.7g). Fibre is essential for healthy digestion, preventing constipation, and may help reduce the risk of bowel cancer.
- Mycoprotein contains more calcium (0.048g vs 0.010g). Calcium is vital for the development of strong bones and teeth in a growing human.
Arguments against mycoprotein being healthier:
- Lamb contains almost twice as much protein (20.2g vs 10.5g). Protein is crucial for growth, muscle development, and repair of tissues, which are all very important for a growing individual.
- Lamb contains significantly more iron (0.0025g vs 0.00039g). Iron is essential for producing haemoglobin and preventing anaemia, which can cause fatigue and impair development.
Conclusion: Mycoprotein offers advantages for long-term cardiovascular and digestive health due to its low fat and high fibre content. However, for a growing human who has high requirements for protein and iron to support rapid growth and development, lamb provides these key nutrients in much greater quantities. Therefore, a balanced diet incorporating both sources might be most beneficial, or mycoprotein would need to be consumed in much larger quantities or fortified to meet the protein and iron needs of a growing human.
▶️ Answer/Explanation
(a) \( 6CO_2 + 6H_2O \rightarrow C_6H_{12}O_6 + 6O_2 \)
Explanation: This is the balanced equation for photosynthesis. It shows that six molecules of carbon dioxide and six molecules of water, in the presence of light energy (absorbed by chlorophyll), are converted into one molecule of glucose and six molecules of oxygen. The oxygen gas produced is what causes the leaf discs to rise in the experiment.
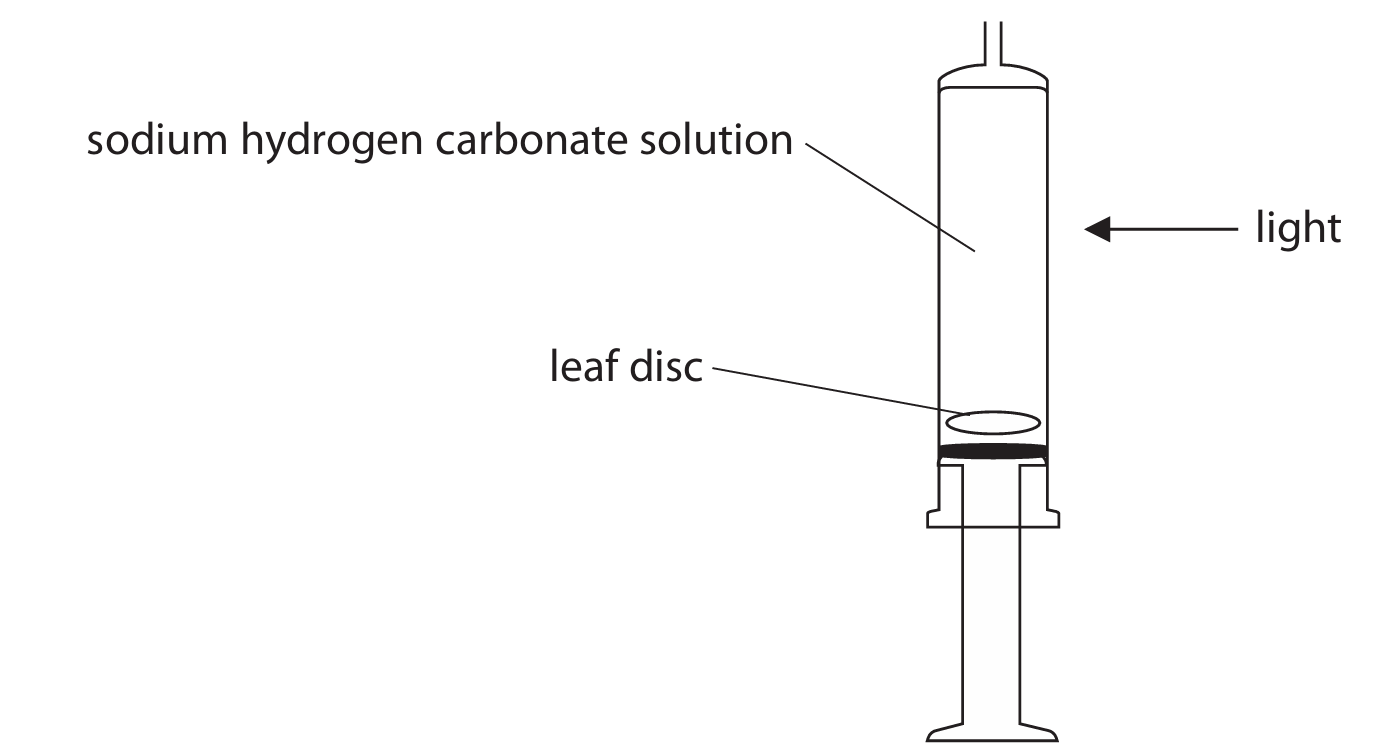
(b)(i) Repeat the experiment and calculate a mean time for each distance.
Explanation: Repeating the experiment multiple times for each lamp distance helps to identify and reduce the effect of random errors. Calculating a mean (average) time for the disc to rise at each distance provides a more reliable and accurate value than a single measurement, making the results more trustworthy.
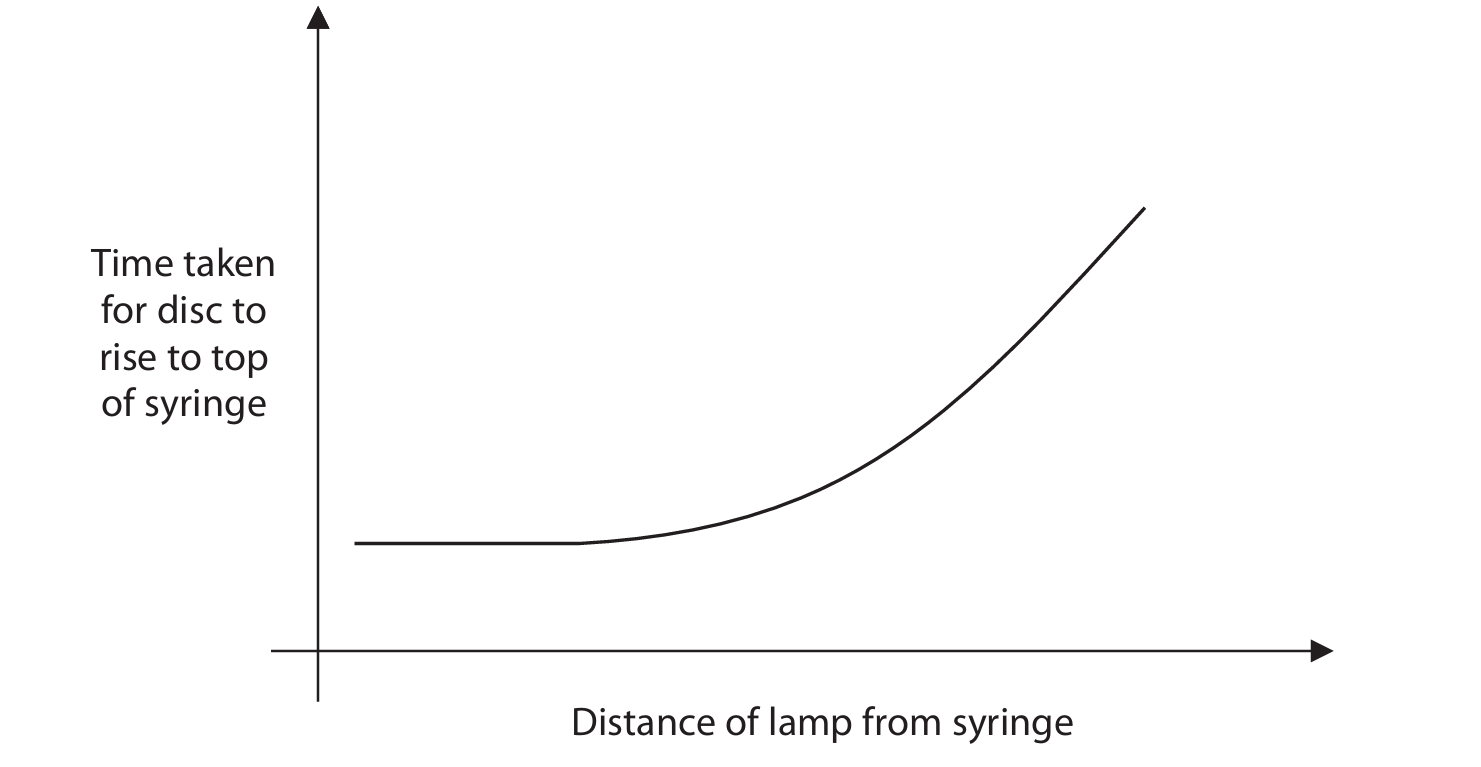
(b)(ii) The time taken for the leaf disc to rise.
Explanation: The dependent variable is what is measured in the experiment. In this case, the student is changing the independent variable (the distance of the lamp, which affects light intensity) and measuring how this change affects the time it takes for the disc to rise to the top of the syringe.
(c) As the distance of the lamp increases, the time taken for the leaf disc to rise increases.
Explanation: This happens because light intensity is inversely proportional to the square of the distance (Inverse Square Law). So, as the lamp is moved further away, the light intensity reaching the leaf disc decreases significantly. A lower light intensity means the rate of photosynthesis slows down. Photosynthesis produces oxygen gas. A slower rate of photosynthesis means oxygen is produced more slowly. The oxygen gas becomes trapped in the leaf’s air spaces, increasing its buoyancy and causing it to rise. If oxygen is produced more slowly, it takes longer for enough gas to accumulate to make the disc buoyant enough to rise. At very close distances (high light intensity), the rate of photosynthesis might be limited by another factor, such as carbon dioxide concentration or temperature, which is why the graph may level off or the time may not decrease infinitely.
(d)
- Place the leaf disc in boiling water for about one minute. This kills the leaf and stops all chemical reactions.
- Transfer the leaf to a test tube containing ethanol (alcohol). Heat the test tube in a water bath (e.g., a beaker of hot water) until the leaf loses its green colour (the chlorophyll is extracted into the ethanol). This step decolorizes the leaf, making the colour change easier to see.
- Rinse the decolorized leaf in warm water to soften it and remove the ethanol. Place the leaf on a white tile and add a few drops of iodine solution.
- If starch is present, the area where the iodine is added will turn blue-black. If no starch is present, the area will remain a yellowish-brown colour.
Explanation: This is the standard iodine test for starch. The process is necessary to break down the cell membranes (boiling), remove the masking green pigment (ethanol), and then apply the iodine reagent. Iodine reacts with starch to produce a characteristic blue-black colouration, indicating that photosynthesis has occurred and glucose has been converted into stored starch.

▶️ Answer/Explanation
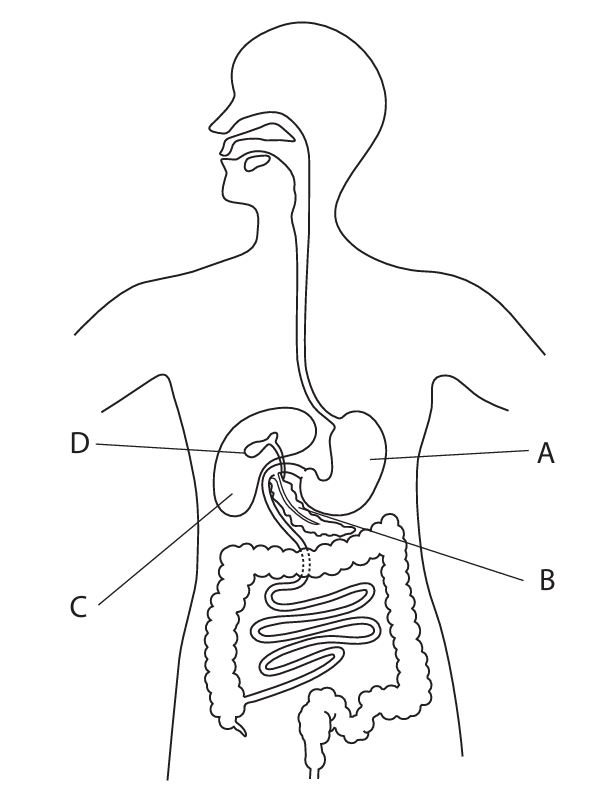
(a)
A: Oesophagus (or Gullet)
B: Stomach
C: Small intestine (or Ileum or Duodenum or Jejunum)
D: Large intestine (or Colon)
Explanation: The labels A-D are identified based on their location and function in the mammalian digestive system. A is the oesophagus, which carries food from the mouth to the stomach (B). C is the small intestine, where most digestion and absorption occurs. D is the large intestine, which absorbs water and forms faeces.
(b) The bacteria in the caecum and appendix produce the enzyme cellulase. Cellulase digests cellulose, a major component of plant cell walls, into glucose. The rabbit can then absorb this glucose and use it for energy through respiration.
Detailed Explanation: Rabbits are herbivores whose diet consists largely of cellulose from grass and plants. Mammals, including rabbits, cannot produce the enzyme cellulase themselves. However, symbiotic bacteria living in the enlarged caecum and appendix can. These bacteria break down the tough cellulose fibers into simpler sugar molecules, like glucose. This process, called fermentation, allows the rabbit to access the energy stored in plant material that would otherwise be indigestible and lost in faeces. The glucose is then absorbed into the rabbit’s bloodstream and used in cellular respiration to release energy.
(c)(i) Humans are omnivores and do not have a diet consisting mainly of cellulose, so a large fermentation chamber is not necessary.
Detailed Explanation: Unlike rabbits, which are specialized herbivores, humans have a more varied omnivorous diet that includes easier-to-digest foods like meats, fruits, and processed grains. While we do eat some plant material, we do not rely on breaking down large quantities of tough cellulose for energy. Therefore, there has been no evolutionary pressure for humans to develop a large caecum and appendix for housing cellulose-digesting bacteria.
(c)(ii) Removing the appendix removes a reservoir of useful gut bacteria. This reduces competition for resources and space, allowing harmful (pathogenic) bacteria to multiply more easily and cause infections.
Detailed Explanation: The appendix acts as a safe haven or “store” for beneficial gut flora. After an event like a diarrheal illness that flushes out bacteria from the main part of the gut, the appendix can help repopulate the intestine with these good bacteria. These beneficial bacteria compete with harmful bacteria for space and nutrients, keeping the population of pathogens in check. If the appendix is removed, this reservoir is lost. This means that after the gut flora is disturbed, it may be slower to recover or may not be repopulated with the same diversity of good bacteria. With reduced competition from beneficial bacteria, pathogenic bacteria can multiply to larger numbers, increasing the likelihood of them causing an infection in the colon.
▶️ Answer/Explanation
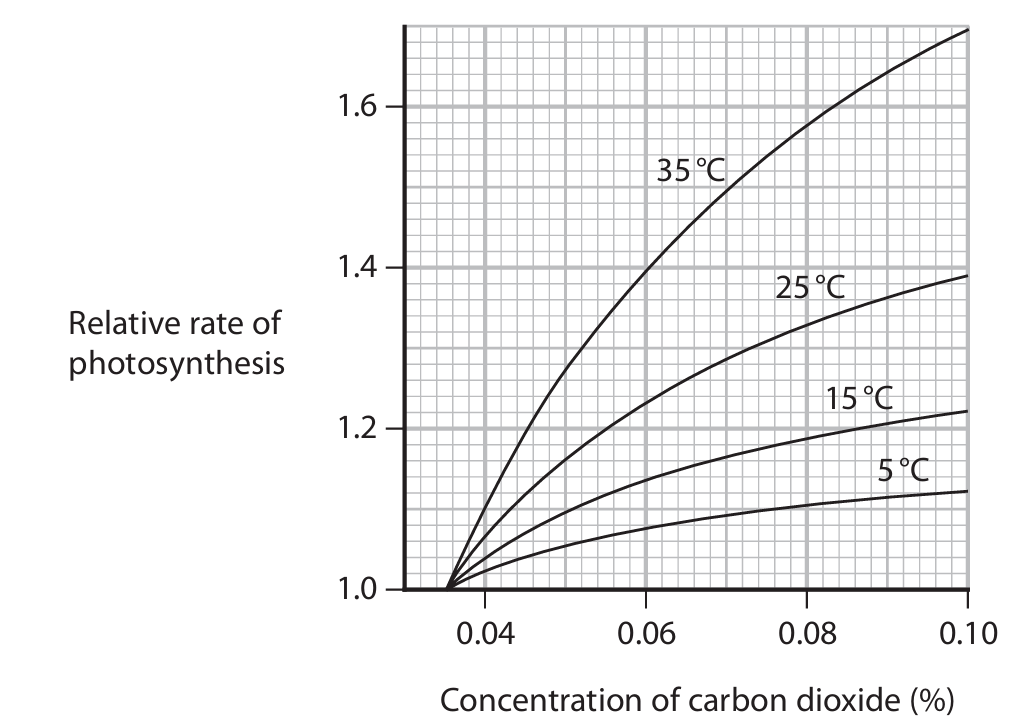
(a) 400 ppm
Explanation: To convert percentage to parts per million (ppm), we multiply by 10,000. Since 1% = 10,000 ppm, 0.04% = 0.04 × 10,000 = 400 ppm. This calculation shows that carbon dioxide makes up a much smaller proportion of the atmosphere compared to oxygen.
(b)(i) At 5°C, increasing the carbon dioxide concentration increases the relative rate of photosynthesis, but the rate begins to level off or reaches a maximum at around 0.10% CO₂ concentration.
Explanation: Even at this low temperature, which limits enzymatic activity, providing more CO₂ (a key reactant in photosynthesis) can enhance the rate up to a point. However, at 5°C, other factors like enzyme activity become limiting, so further increases in CO₂ have diminishing returns.
(b)(ii) The effect of increasing carbon dioxide concentration on the relative rate of photosynthesis becomes more pronounced at higher temperatures, with the steepest increase observed at 35°C.
Explanation: Temperature and CO₂ concentration interact in their effects on photosynthesis. At higher temperatures, enzymatic reactions proceed faster, making the plants more responsive to increased CO₂ availability. This synergistic effect means that optimal photosynthesis occurs when both temperature and CO₂ levels are adequately high.
(b)(iii) Increasing temperature from 5°C to 35°C increases the relative rate of photosynthesis because higher temperatures provide more kinetic energy to molecules, leading to more frequent and successful collisions between enzymes and substrates involved in photosynthesis.
Explanation: Photosynthesis is driven by enzymes that have an optimal temperature range. At 5°C, enzyme activity is very low due to insufficient kinetic energy. As temperature increases, molecular motion increases, enhancing the rate of enzymatic reactions like those in the Calvin cycle. However, beyond a certain point (typically around 35-40°C for many plants), enzymes may denature, reducing the rate again.
(c)(i) Lacking nitrate would affect plant growth because nitrate is essential for making amino acids and proteins, which are needed for cell growth and development. Without sufficient nitrate, plants would show stunted growth and yellowing of leaves.
Explanation: Nitrate is a crucial mineral obtained from the soil that plants use to synthesize amino acids, the building blocks of proteins. These proteins include enzymes that catalyze metabolic reactions and structural components of cells. Nitrogen deficiency typically manifests as chlorosis (yellowing) in older leaves first, as nitrogen is mobilized to younger tissues.
(c)(ii) Light intensity can affect the rate of photosynthesis because light provides the energy required to excite electrons in chlorophyll, driving the light-dependent reactions of photosynthesis.
Explanation: Light is the energy source for photosynthesis. When light intensity increases, more photons are available to excite electrons in photosystems, leading to increased ATP and NADPH production. These energy carriers are then used in the Calvin cycle to fix carbon dioxide into sugars. However, beyond a certain point, other factors like CO₂ concentration or enzyme activity become limiting, and further increases in light intensity won’t increase the photosynthesis rate.


▶️ Answer/Explanation
(a) C it is specific
Explanation: Biological control uses natural predators or parasites to target specific pests, unlike broad-spectrum chemical pesticides that can harm beneficial insects and other non-target organisms. This specificity reduces environmental impact and helps maintain ecological balance in the farming ecosystem.
(b)(i)
1. Sucrose/sugars
2. Amino acids
Explanation: Aphids feed directly on the phloem sap, which is rich in sugars (like sucrose) produced during photosynthesis, and amino acids, which are the building blocks of proteins. These compounds are transported throughout the plant via the phloem to support growth and storage.
(b)(ii)
Explanation: When aphids feed on phloem sap, they directly remove vital nutrients—sugars and amino acids—that the plant needs for energy and growth. This loss reduces the plant’s ability to perform essential functions. With less sugar available, respiration (the process of releasing energy) is compromised, leading to reduced ATP production. This energy deficit hinders active transport, limiting the plant’s uptake of minerals from the soil. Consequently, the plant experiences stunted growth, produces smaller leaves, tubers, fruits, or grains, and may store less starch and protein. In severe cases, the loss of nutrients can even reduce the rate of photosynthesis itself. Additionally, aphid feeding can weaken the plant and make it more susceptible to diseases, further reducing crop yield.
(c)
Explanation: The scientists’ conclusion that hoverflies are the most effective biological control agent is supported by the graph data, which shows that hoverfly larvae consume more aphids per day than silverfly larvae at all three temperatures tested (12°C, 15°C, and 18°C). This higher consumption rate means fewer hoverflies would be needed to control an aphid population, making them a potentially more efficient option. The difference in consumption is most pronounced at the lowest temperature (12°C), where hoverflies eat roughly three times more aphids, suggesting they might be particularly useful in cooler conditions.
However, the conclusion may not be entirely conclusive due to limitations in the method. The experiment used only a single larva per container, which is a very small sample size. To improve reliability, the experiment should be repeated with many more larvae to calculate a more robust average and account for individual variation. Furthermore, the controlled laboratory environment does not fully replicate field conditions, where factors like wind, rain, predators of the control agents themselves, and the spatial distribution of aphids could significantly influence feeding behavior. The study also only compared two species; other effective natural predators of aphids, like ladybugs or lacewings, were not included in the comparison. Therefore, while the data suggests hoverflies are promising, more extensive field trials and comparisons with other agents are needed to firmly establish them as the most effective option.
▶️ Answer/Explanation
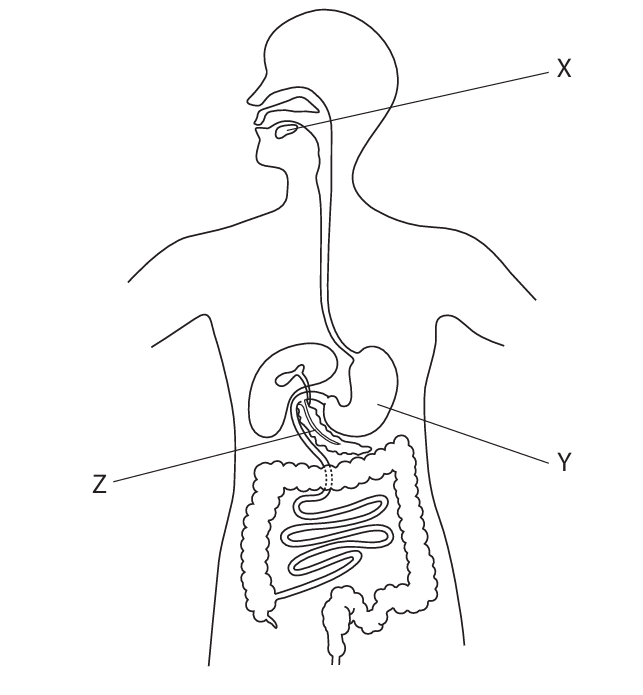
(a)(i) C (X and Z)
Explanation: Amylase is an enzyme that breaks down starch into simpler sugars. In the human alimentary canal, it is produced in two main locations: the salivary glands (represented by structure X) and the pancreas (represented by structure Z). Structure Y represents the stomach, which does not produce amylase but instead produces protease enzymes like pepsin for protein digestion.
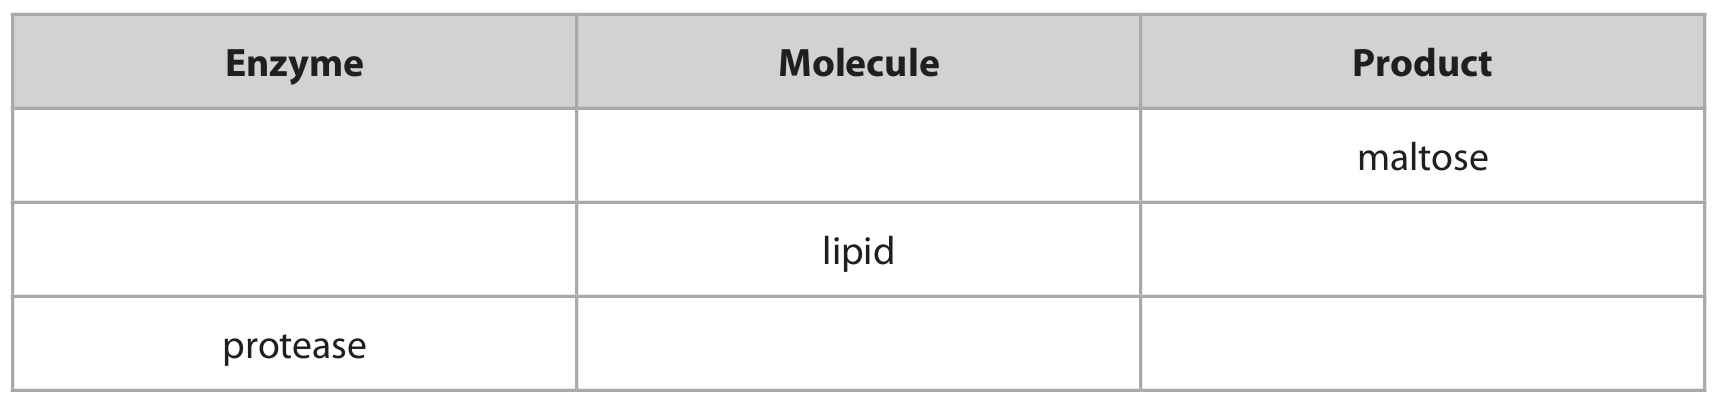
(a)(ii)
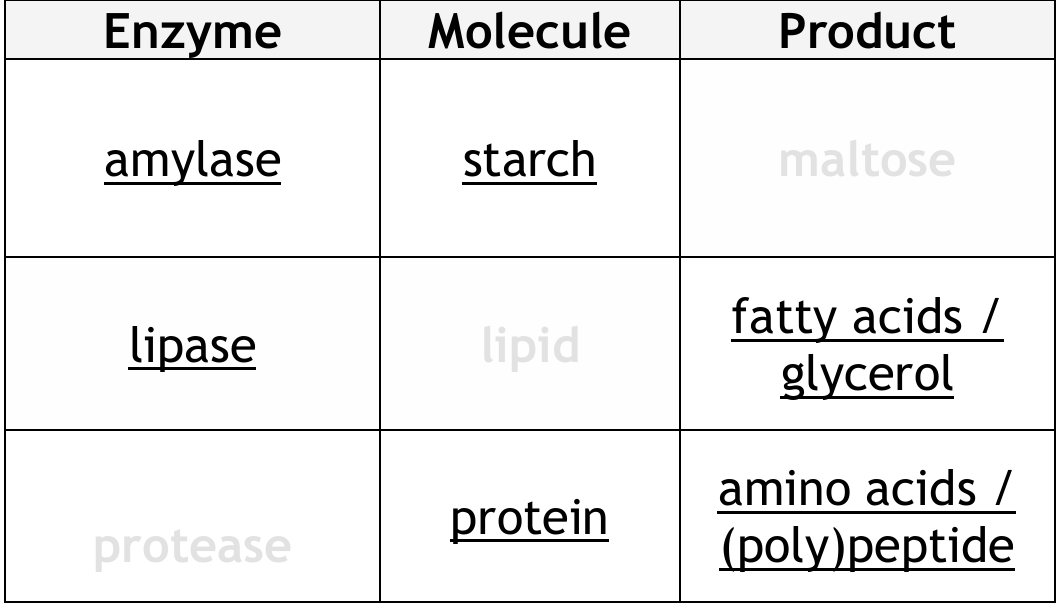
Explanation: The table shows the specific actions of digestive enzymes. Maltase breaks down the disaccharide maltose into two glucose molecules. Lipase acts on lipids (fats and oils), breaking them down into their building blocks: fatty acids and glycerol. Protease enzymes target proteins, digesting them into smaller peptides and ultimately into individual amino acids, which can then be absorbed into the bloodstream.
(b)(i) 184 g
Explanation: To solve this, we use a simple proportional relationship. If 100g of lentils contains 25g of protein, then the mass of lentils containing 1g of protein is 100 ÷ 25 = 4g. To find the mass for 46g of protein, we multiply: 46 × 4g = 184g. Therefore, 184 grams of lentils are needed to provide 46 grams of protein.
(b)(ii)
Explanation: Eating this same diet every day could lead to several long-term health issues. The person’s energy intake (2700 kJ) is higher than the RDA (2200 kJ), which over time could lead to weight gain and an increased risk of obesity, type 2 diabetes, and heart disease. While protein intake is adequate for growth and repair, vitamin C is significantly below the RDA, which could eventually cause scurvy, leading to symptoms like bleeding gums and poor wound healing. Calcium intake is also too low, increasing the risk of developing osteoporosis (weak and brittle bones) later in life. Fibre intake is less than half the RDA, which can lead to digestive problems like constipation and may increase the risk of bowel cancer. Although iron and vitamin A levels are sufficient, the overall imbalance in the diet highlights the importance of variety to meet all nutritional needs.
(b)(iii)
Explanation: The Recommended Daily Amount (RDA) for energy is a general guideline and may not be the exact amount required by this specific person for two main reasons. Firstly, an individual’s energy requirement is heavily influenced by their activity level. A person with a physically demanding job or who exercises regularly will need more energy than someone with a sedentary lifestyle. Secondly, personal factors such as age, sex, and basal metabolic rate (BMR) play a significant role. For instance, a younger person or a male typically has a higher BMR and thus requires more energy. Body size and composition (the ratio of muscle to fat) also affect how many calories are burned at rest.


▶️ Answer/Explanation
(a) (i)
1 light (intensity)
2 water volume
Explanation: The student controls several abiotic (non-living) factors to ensure a fair test. The lamp provides a controlled light intensity, which is crucial for photosynthesis. The student also controls the volume of water added each day, ensuring that water availability, another key factor for plant growth, is consistent and not a variable affecting the results.
(a) (ii)
Explanation: Using dry mass is important because the water content in living seedlings can vary significantly. If fresh (wet) mass were measured, some seedlings might be heavier simply because they absorbed more water, not because they have more actual plant biomass (the organic matter like cellulose, proteins, and starch). Drying the seedlings in an oven removes all the water, leaving only the dry biomass. This allows for a valid and fair comparison of the true growth (increase in organic material) between the seedlings grown with and without fertiliser.
(b) (i)
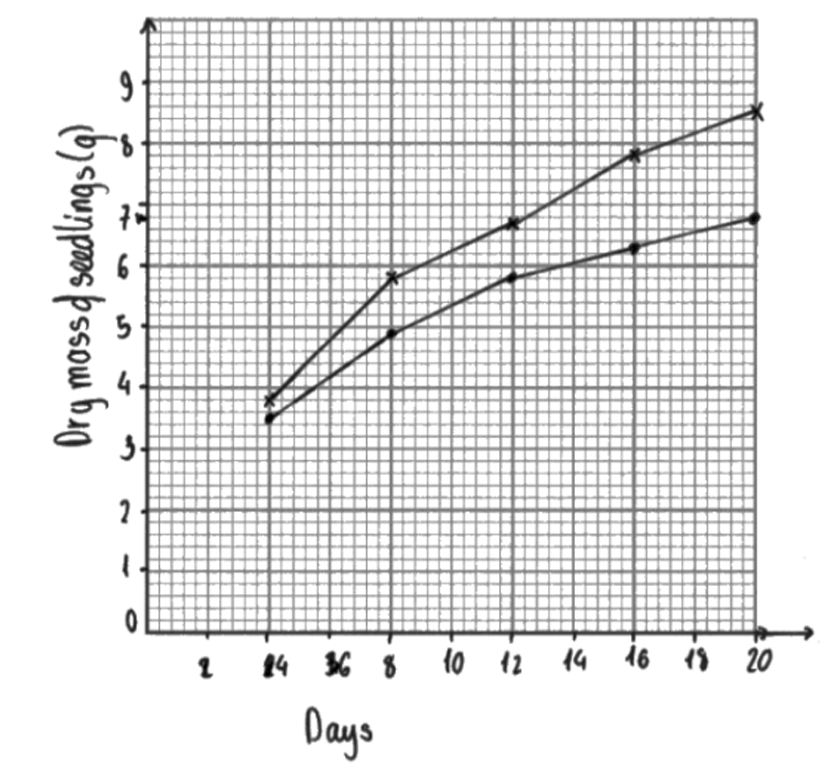
- Axes: The x-axis should be labelled “Day” and the y-axis “Dry mass (g)”.
- Scales: The scales should be linear and use at least half the grid provided.
- Points: Two sets of points should be plotted accurately using the data from the table.
- Lines: Straight lines should be drawn with a ruler to connect the points for each data set (with fertiliser and without fertiliser).
- Key: A key should be included to identify which line represents “With fertiliser” and which represents “Without fertiliser”.
Explanation: The graph would visually demonstrate that the dry mass increases over time for both sets of seedlings, but the increase is consistently greater for the seedlings that received fertiliser. The lines would show a positive correlation between time and dry mass, with the line for ‘with fertiliser’ having a steeper gradient, indicating a faster growth rate.
(b) (ii)
Explanation: The magnesium ions (\( \text{Mg}^{2+} \)) and nitrate ions (\( \text{NO}_3^{-} \)) in the fertiliser are essential mineral ions that significantly promote plant growth.
Magnesium ions are a key component of the chlorophyll molecule. Chlorophyll is the green pigment found in chloroplasts that absorbs light energy. By providing more magnesium, the plant can produce more chlorophyll. This leads to a higher rate of photosynthesis, the process where plants use light energy to make carbohydrates (like glucose) from carbon dioxide and water. These carbohydrates provide the energy and building materials for growth.
Nitrate ions are absorbed by the plant roots and are used to synthesise amino acids. Amino acids are the building blocks of proteins. Proteins are vital for growth as they are used to make new cytoplasm and enzymes. Enzymes control all the metabolic reactions in the plant, including the reactions of photosynthesis and respiration, further fuelling growth. Therefore, the presence of nitrates directly supports the production of new plant tissue.
In summary, magnesium boosts the energy-capturing process (photosynthesis), while nitrates provide the raw materials for building new structures (proteins), together resulting in the increased dry mass observed in the seedlings treated with fertiliser.
▶️ Answer/Explanation
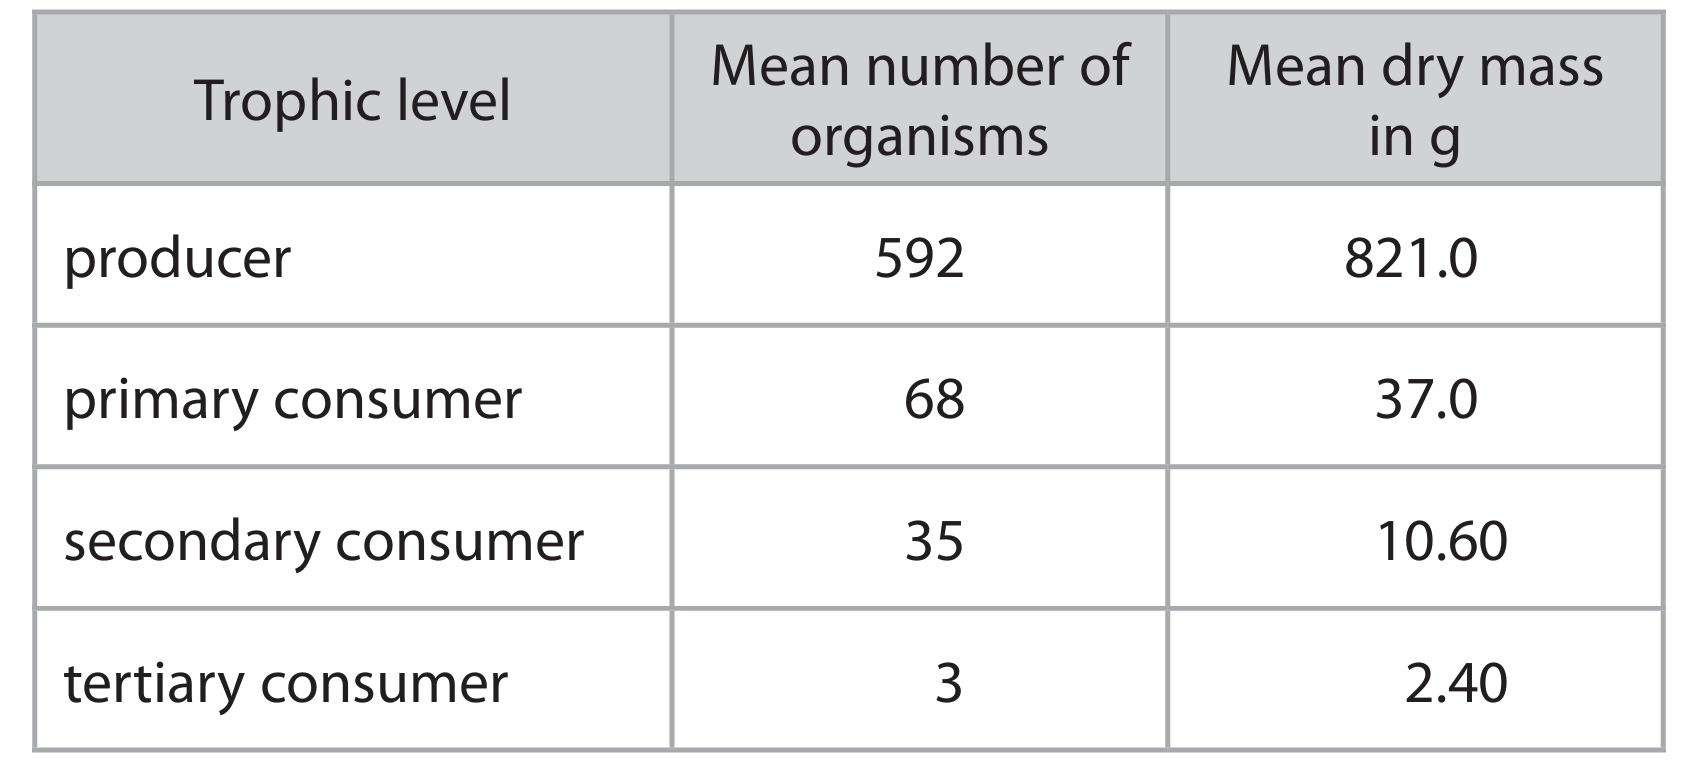
(a)(i)
The pyramid of numbers should have the correct order of trophic levels from bottom to top: producer, primary consumer, secondary consumer, tertiary consumer. The shape should be a pyramid, with the widest bar at the bottom (producers) and the narrowest at the top (tertiary consumers).
Explanation: A pyramid of numbers represents the number of organisms at each trophic level. In this grassland ecosystem, there are 592 producers, 68 primary consumers, 35 secondary consumers, and 3 tertiary consumers per square meter. When drawn, this creates a classic pyramid shape, showing a large base of producers supporting fewer consumers at each successive level.
(a)(ii)
To collect this data, you would:
- Use a quadrat (a square grid) placed randomly in the ecosystem
- Count all the plants (producers) within the quadrat
- Repeat this process multiple times in different random locations
- Calculate the mean number of producers per square meter by adding all the counts and dividing by the number of quadrats used
Explanation: Using a quadrat ensures you’re sampling a consistent area each time. Random placement helps avoid bias in where you sample. Repeating the process multiple times gives you more reliable data. By counting all plants within each quadrat and then calculating the average, you can determine the mean number of producers per square meter in the entire ecosystem.
(b)(i)
Calculation: \( \frac{2.40}{10.60} \times 100 = 22.6\% \)
Explanation: To find the percentage of biomass transferred from secondary to tertiary consumers, we divide the biomass of tertiary consumers (2.40 g) by the biomass of secondary consumers (10.60 g) and multiply by 100. This gives us 22.6%, meaning about 22.6% of the biomass from secondary consumers is transferred to tertiary consumers.
(b)(ii)
The energy transfers in this ecosystem show several important patterns:
- There are fewer organisms and less biomass at higher trophic levels
- Energy is lost at each transfer between trophic levels
- The largest energy loss occurs between producers and primary consumers (only 4.5% transferred)
- Energy is lost through various processes including:
- Respiration and heat production
- Undigested material (e.g., cellulose in plant cell walls)
- Organisms that aren’t eaten
- Excretion
- Death and decomposition
Explanation: Energy transfers in ecosystems are inefficient. Only a small percentage of energy moves from one trophic level to the next. The data shows this clearly – while there are 592 producers with 821.0 g of biomass, this supports only 68 primary consumers with 37.0 g of biomass, representing just 4.5% transfer. The transfer from secondary to tertiary consumers is higher at 22.6%, but the absolute amounts are much smaller. These energy losses occur because organisms use most of the energy they consume for their own life processes like movement, growth, and reproduction, with only a small portion being stored as biomass available to the next trophic level.
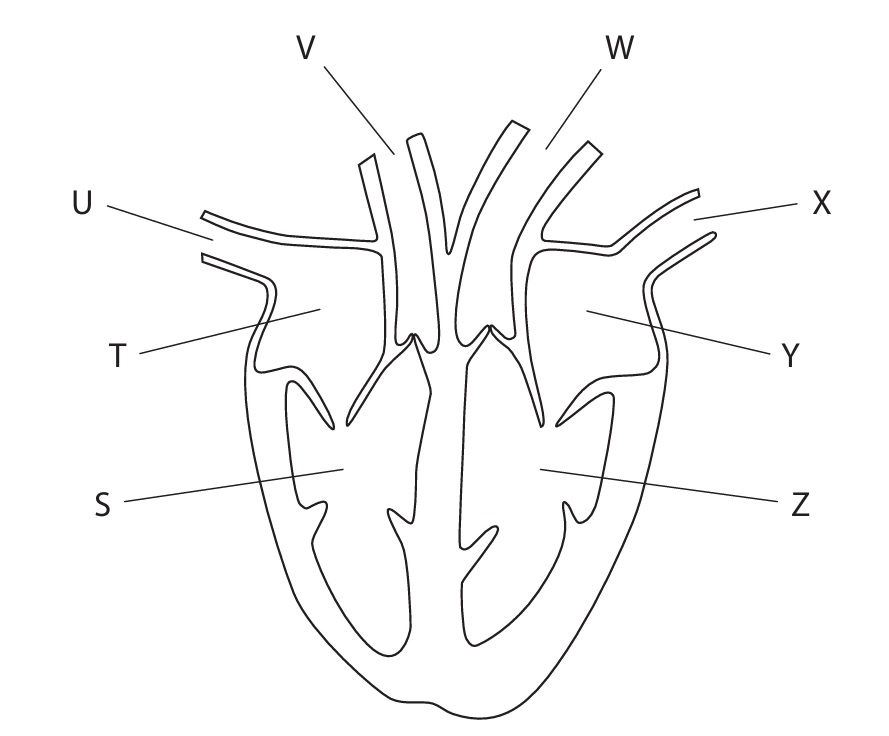
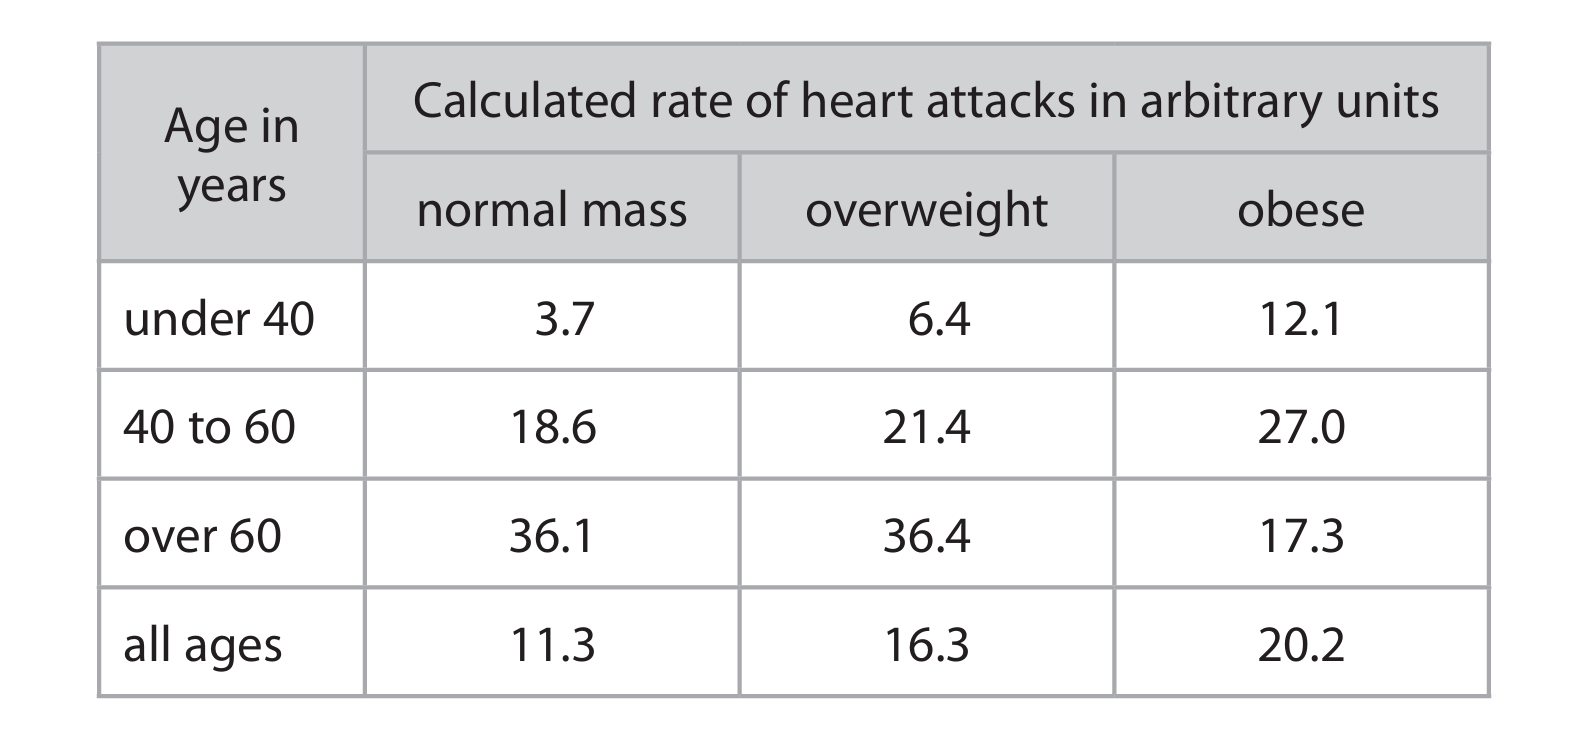
▶️ Answer/Explanation
(a)(i) A U
Explanation: Blood vessel U is the vena cava, which brings deoxygenated blood from the body back to the right atrium of the heart. This is a fundamental part of the circulatory system where deoxygenated blood returns to the heart to be pumped to the lungs for oxygenation.
(a)(ii) D Z
Explanation: Chamber Z is the left ventricle, which is responsible for pumping oxygenated blood out of the heart to the rest of the body through the aorta. The left ventricle has the thickest muscular wall of all the heart chambers because it needs to generate enough pressure to circulate blood throughout the entire body.
(a)(iii)
Explanation: Chamber S (right ventricle) has a thinner wall compared to chamber Z (left ventricle). This difference exists because the right ventricle only needs to pump blood a short distance to the lungs, which requires less pressure. In contrast, the left ventricle must generate much higher pressure to pump blood throughout the entire body. The thicker, more muscular wall of the left ventricle enables it to create this greater force. Additionally, the right ventricle pumps deoxygenated blood to the lungs, while the left ventricle pumps oxygenated blood to all body tissues.
(b)
Explanation: Three essential components of a balanced diet and their functions are:
- Carbohydrates: Provide the primary source of energy for the body. They are broken down into glucose, which is used for cellular respiration to produce ATP, the energy currency of cells.
- Proteins: Essential for growth and repair of body tissues. They are used to build and maintain muscles, organs, skin, and hair. Proteins also form enzymes that catalyze biochemical reactions and antibodies for immune defense.
- Fats/Lipids: Serve as a concentrated energy store and provide insulation to help maintain body temperature. They also protect vital organs and are necessary for the absorption of fat-soluble vitamins (A, D, E, K).
Other important components include minerals like calcium for strong bones and teeth, vitamins like vitamin C for healthy connective tissue and immune function, fiber for proper digestion and bowel function, and water as a solvent for chemical reactions and transport medium.
(c)
Explanation: The data reveals several important relationships between body mass, age, and heart attack risk. The study was large-scale (850 people) and long-term (20 years), which increases its reliability. Across all age groups combined, there’s a clear trend showing that as body mass increases from normal to overweight to obese, the rate of heart attacks also increases (11.3 → 16.3 → 20.2 arbitrary units).
However, when examining specific age groups, more nuanced patterns emerge. For people under 40, obesity is associated with a substantially higher heart attack rate (12.1) compared to normal mass (3.7) – more than three times the risk. In the 40-60 age group, the trend continues with obese individuals having the highest rates. Interestingly, for people over 60, the pattern reverses – obese individuals actually have the lowest heart attack rate (17.3) compared to normal mass (36.1) and overweight (36.4) individuals.
This surprising finding in the over-60 group suggests that other factors beyond body mass may become more important in determining heart attack risk in older age. The study has limitations though – it was conducted only in one Australian population, so the results might not apply universally. Other factors not accounted for in this data, such as smoking habits, exercise levels, genetic predisposition, stress, and specific dietary patterns, could also significantly influence heart attack risk and might explain some of the observed patterns.
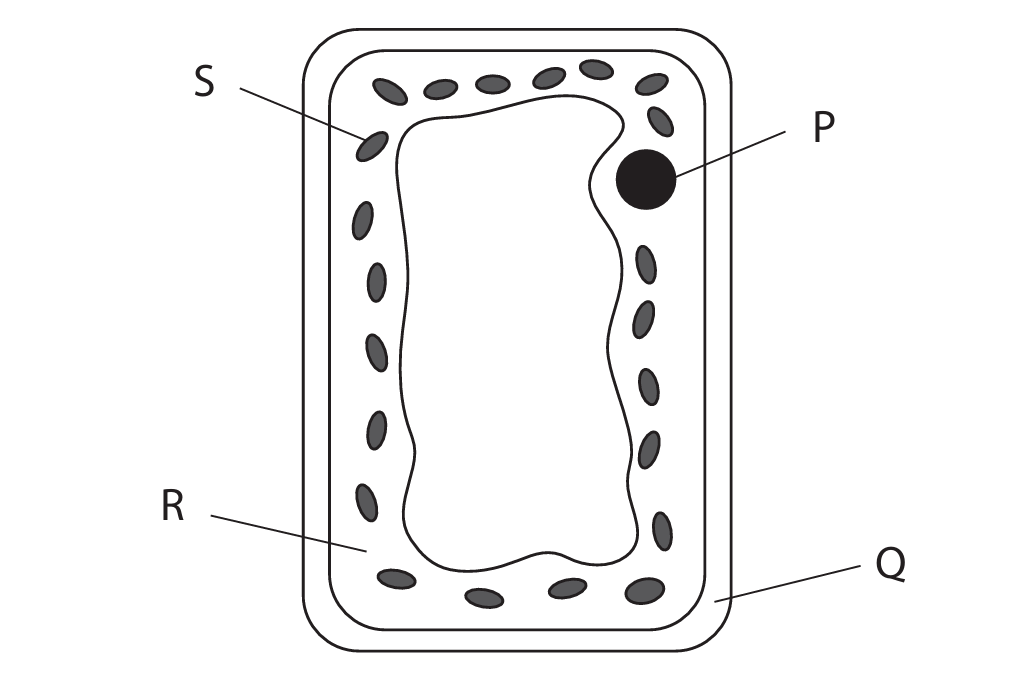
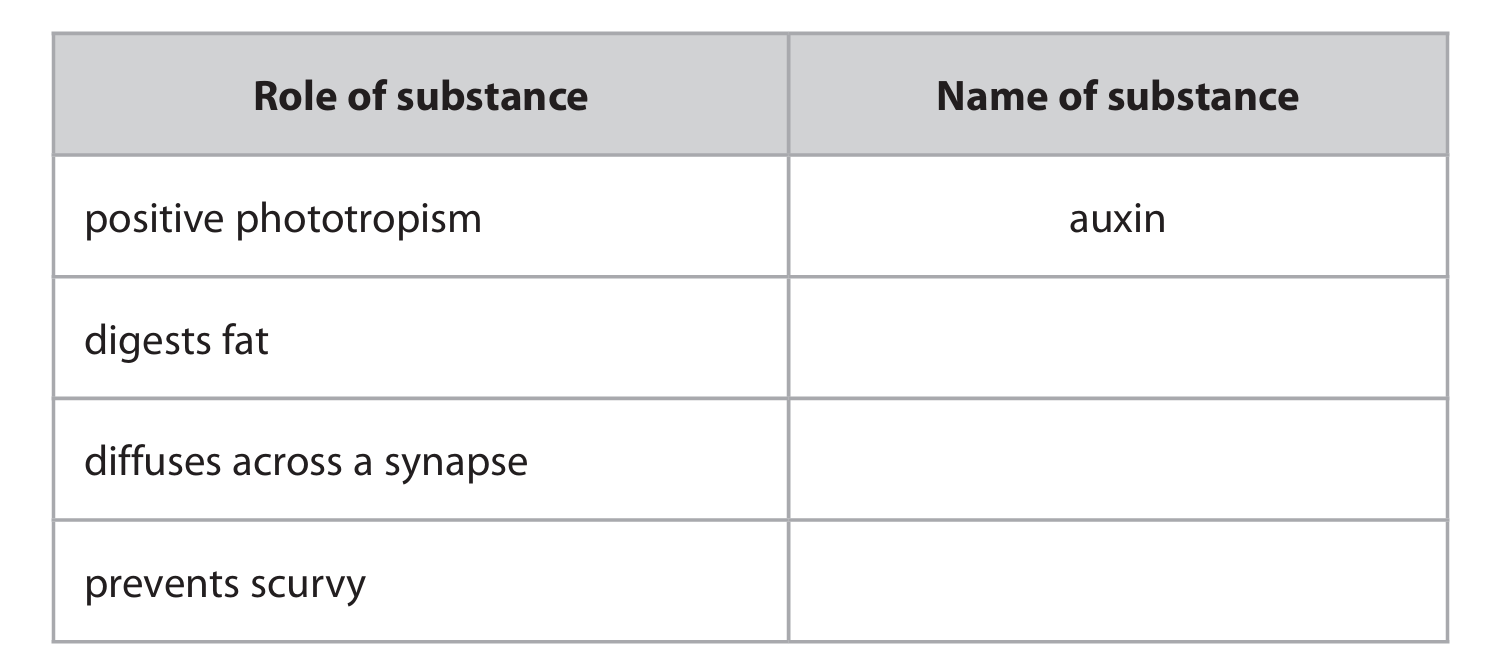
▶️ Answer/Explanation
1 (a)(i) D S
Explanation: In plant cells, chlorophyll is found in the chloroplasts, which are represented by structure S in the diagram. Chloroplasts are the organelles responsible for photosynthesis and contain the green pigment chlorophyll that captures light energy.
1 (a)(ii) C magnesium
Explanation: Chlorophyll molecules contain magnesium ions at their center. The magnesium atom is coordinated to four nitrogen atoms in the porphyrin ring structure of chlorophyll, which is essential for its light-absorbing properties during photosynthesis.
1 (a)(iii) Chlorophyll absorbs/traps light energy for photosynthesis to produce carbohydrates.
Detailed Explanation: Chlorophyll plays a crucial role in photosynthesis by absorbing light energy, primarily from the blue and red regions of the visible spectrum. This absorbed light energy is then converted into chemical energy through the process of photosynthesis. During photosynthesis, carbon dioxide and water are converted into glucose and oxygen using this captured energy. The glucose produced can then be used by the plant for energy or converted into starch for storage.
1 (b) C a plant stem growing towards light
Explanation: Positive phototropism refers to the growth movement of a plant part toward a light source. Plant stems exhibit positive phototropism as they grow toward light, which maximizes their exposure to sunlight for photosynthesis. This directional growth is controlled by the hormone auxin, which accumulates on the shaded side of the stem, causing those cells to elongate more rapidly.
1 (c)
Detailed Explanation:
Lipase is an enzyme that breaks down fats (lipids) into fatty acids and glycerol during digestion. It’s produced by the pancreas and works in the small intestine.
Neurotransmitter is a chemical messenger that diffuses across the synaptic cleft (the gap between neurons) to transmit nerve impulses from one neuron to another. Examples include acetylcholine and noradrenaline.
Vitamin C (ascorbic acid) is essential for preventing scurvy, a disease characterized by bleeding gums, joint pain, and fatigue. Vitamin C is necessary for collagen synthesis, which is important for maintaining healthy connective tissues.
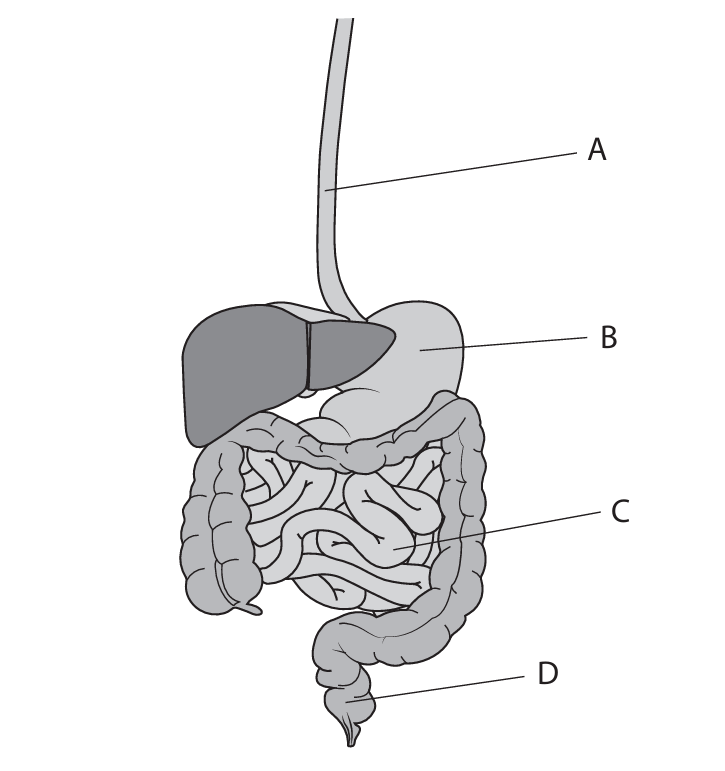
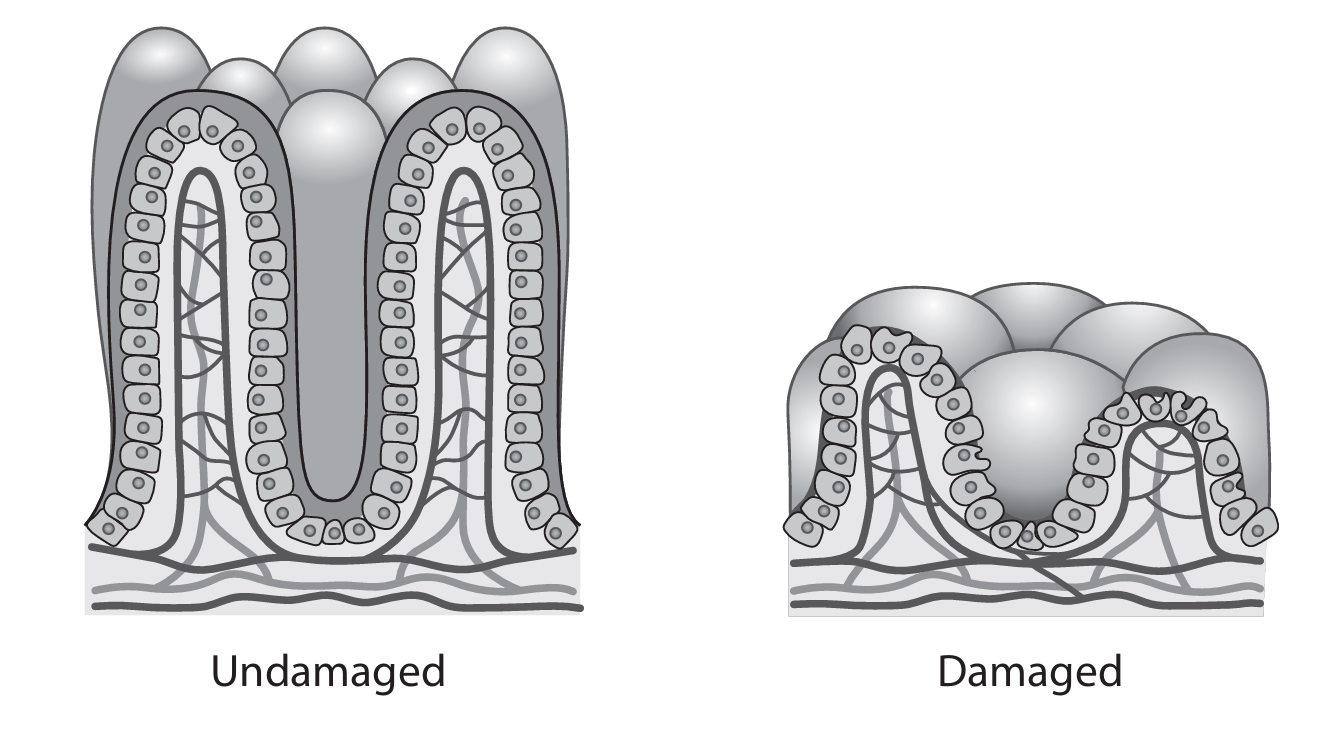
▶️ Answer/Explanation
(a)(i) B
Explanation: Hydrochloric acid is produced in the stomach. In the diagram, part B represents the stomach, which contains gastric glands that secrete hydrochloric acid. This acid creates an acidic environment that helps to kill pathogens and provides the optimal pH for the enzyme pepsin to break down proteins.
(a)(ii) D
Explanation: Faeces are stored in the rectum before egestion. In the diagram, part D represents the rectum, which acts as a temporary storage site for undigested food material (faeces) until it is expelled from the body through the anus.
(b) Bile plays two crucial roles in digestion: emulsification of fats and neutralization of stomach acid.
Explanation: The liver produces bile, which is stored in the gallbladder and released into the small intestine. Bile contains bile salts that emulsify lipids, meaning they break large fat globules into smaller droplets. This dramatically increases the surface area of the fats, allowing the enzyme lipase to break them down more efficiently. Additionally, bile is alkaline, which helps to neutralize the hydrochloric acid from the stomach. This creates a more suitable pH environment for the pancreatic and intestinal enzymes (like lipase) to function effectively in the small intestine.
(c)(i) Undamaged villi are highly adapted for efficient absorption of digested food molecules.
Explanation: The adaptations of the villi include:
1. Large Surface Area: The villi are finger-like projections, and each villus is covered with even smaller projections called microvilli. This combined structure creates a massive surface area for absorption.
2. Thin Wall: The wall of each villus is only one cell thick. This creates a very short diffusion path, allowing for rapid absorption of nutrients into the bloodstream.
3. Rich Blood Supply: Each villus contains a dense network of capillaries. This maintains a steep concentration gradient for digested products like glucose and amino acids, facilitating their rapid absorption into the blood.
4. Lacteal: Each villus also contains a lacteal, which is a lymphatic vessel. The lacteal specifically absorbs fatty acids and glycerol, which are the products of fat digestion.
(c)(ii) Children with untreated coeliac disease experience impaired nutrient absorption due to villi damage, leading to stunted growth and fatigue.
Explanation: In coeliac disease, the immune reaction to gluten flattens and damages the villi. This damage has several consequences:
1. Reduced Surface Area: The damaged villi have a much smaller surface area compared to healthy, finger-like villi. This severely limits the area available for absorbing digested nutrients.
2. Slower Growth: With impaired absorption, the body receives fewer amino acids, which are the building blocks for proteins and new tissues. A deficiency in these essential molecules directly hinders growth and development in children.
3. Increased Fatigue: The damaged villi also absorb less glucose, which is the primary fuel for cellular respiration. With less glucose available, cells cannot produce sufficient ATP (energy). This leads to lower energy levels, making the child feel tired more easily. Additionally, reduced absorption of minerals like iron can lead to anemia, which further contributes to fatigue and weakness.

▶️ Answer/Explanation
(a)(i) The plant is placed in the dark for 24 hours to destarch it.
Explanation: This step is crucial because plants continuously perform photosynthesis in light and store the produced glucose as starch. By placing the plant in complete darkness for 24 hours, photosynthesis stops. The plant then uses up its existing starch reserves for respiration over this period. This ensures that at the start of the actual experiment, there is no pre-existing starch in the leaves. Therefore, any starch detected later must have been produced specifically during the experimental conditions, allowing for a valid test of the variables (light and carbon dioxide).
(a)(ii) Leaf Y acts as a control to show that light is necessary for photosynthesis.
Explanation: Leaf Y has part of it covered with a black paper strip, blocking light, while the rest of the leaf is exposed. After the test, the covered part should test negative for starch (no photosynthesis), and the exposed part should test positive (photosynthesis occurred). This creates a direct comparison within the same leaf, demonstrating that the only difference (light availability) caused the difference in starch production. It effectively shows that light is essential for photosynthesis.
(a)(iii) The safe starch test involves boiling, ethanol treatment, and iodine application.
Explanation: The procedure must be done carefully due to the use of heat and flammable ethanol. First, the leaf is placed in boiling water for about 30 seconds using forceps. This kills the leaf and stops all chemical reactions, making the cell membranes more permeable. Next, the leaf is transferred to a test tube of boiling ethanol, which is best done using a water bath for safety (as ethanol is highly flammable). The ethanol dissolves the chlorophyll, decolorizing the leaf. The brittle leaf is then carefully rinsed in warm water to rehydrate it and make it pliable. Finally, iodine solution is spread over the leaf. Areas that contain starch will turn blue-black, while areas without starch will remain a yellowish-brown color. Safety glasses should be worn throughout.
(b) The results show light is required because only the illuminated parts of the leaves produce starch.
Explanation: After the experiment, when leaf Y is tested for starch, a clear pattern emerges. The section that was under the black paper strip (and therefore in darkness) will test negative for starch, showing a yellow/brown color with iodine. The sections of the same leaf that were exposed to light will test positive, turning blue-black with iodine. Since both parts of the leaf had access to carbon dioxide and were on the same plant, the only differing factor was light exposure. This direct comparison proves that light is a necessary condition for photosynthesis to occur and for starch to be produced.
(c) Plants store starch because it is insoluble and osmotically inactive.
Explanation: Glucose is soluble in water. If plants stored large quantities of glucose, it would significantly lower the water potential inside the storage cells (e.g., in roots or seeds). This would cause water to constantly enter the cells via osmosis, potentially leading to them bursting. Starch, on the other hand, is a large, insoluble polymer of glucose. It does not dissolve in water and therefore has no effect on the water potential of the cell. This allows plants to pack massive amounts of carbohydrate energy into a compact, stable, and osmotically neutral form for long-term storage without disrupting the cell’s water balance.

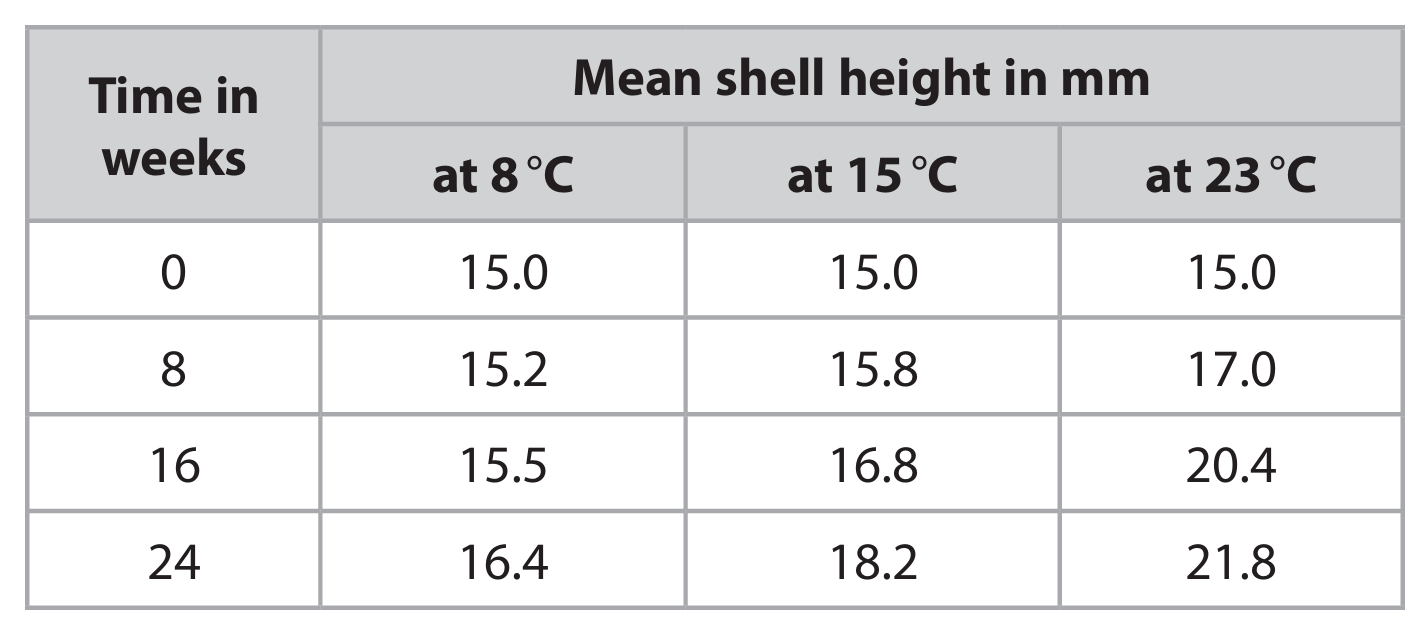


▶️ Answer/Explanation
(a)(i)
Graph plotting: A line graph should be drawn with Time (weeks) on the x-axis and Mean shell height (mm) on the y-axis. Three separate lines should be plotted for the three temperatures (8°C, 15°C, 23°C) using the data from the table. The points should be joined with straight lines using a ruler.
Explanation: The graph would show that the line for 23°C is the steepest, indicating the fastest growth rate. The line for 15°C would be less steep, and the line for 8°C would be the least steep, showing the slowest growth. This visually demonstrates that higher temperatures lead to increased snail growth over the 24-week period.
(a)(ii)
Explanation: The investigation shows that higher temperatures result in greater snail growth. This is because temperature affects enzyme activity within the snails. Enzymes are biological catalysts that control metabolic processes like digestion and respiration, which provide energy and materials for growth. At higher temperatures, enzymes and substrate molecules have more kinetic energy, leading to more frequent and successful collisions. This increases the rate of enzyme-substrate complex formation and accelerates metabolic reactions. Consequently, processes like respiration occur faster, providing more ATP (energy) for growth activities, resulting in the observed increase in shell height at 23°C compared to lower temperatures.
(a)(iii)
Dependent variable: Mean shell height / growth of shell.
Explanation: The dependent variable is what is being measured in the experiment. In this case, the scientist is measuring how the shell height changes in response to different temperatures, so the mean shell height is the dependent variable.
(a)(iv)
Method for reliability: The scientist used groups of snails / used many snails / calculated the mean / repeated the measurements.
Explanation: To ensure reliability, the scientist didn’t just use one snail per temperature. By using groups of snails and calculating the average (mean) shell height for each group at each time interval, the scientist reduces the effect of individual variation among the snails. This makes the results more representative and reliable, as any anomalous measurements from individual snails are less likely to skew the overall data trend.
(b)(i)
Calculation:
Mass of food assimilated = Mass of food eaten – Mass of faeces egested = 1.2 g – 0.30 g = 0.9 g
Assimilation efficiency = \(\frac{0.9}{1.2} \times 100 = 75\%\)
Answer: 75%
Explanation: The calculation shows that 75% of the food eaten by the snail was actually absorbed and used by its body, while 25% was egested as waste (faeces).
(b)(ii)
Explanation: Primary consumers (herbivores) eat plant material, which often contains a high proportion of indigestible substances like cellulose. Cellulose is a tough carbohydrate that forms plant cell walls, and many animals lack the specific enzymes needed to break it down completely. Therefore, a significant portion of the plant material eaten by primary consumers passes through their digestive system undigested and is egested as faeces. In contrast, secondary consumers (carnivores) eat animal tissue, which is generally more easily and completely digested. Animal cells do not have rigid cell walls made of cellulose, and the proteins and lipids in animal tissue are more readily broken down by digestive enzymes. This results in less waste and a higher proportion of the consumed food being assimilated, leading to a greater assimilation efficiency in secondary consumers compared to primary consumers.
(c)
Explanation: Mammals are endotherms (warm-blooded), meaning they use a significant amount of the energy they assimilate from food to maintain a constant internal body temperature through metabolic processes. This requires a lot of energy, especially when the external environment is cold. A large portion of the assimilated energy is used for heat production rather than being converted into new body mass (growth). In contrast, snails are ectotherms (cold-blooded). They do not use metabolic energy to regulate their body temperature; their body temperature fluctuates with the environment. Therefore, a much larger proportion of the energy they assimilate can be directed towards growth and producing new biomass, resulting in a much higher production efficiency (35%) compared to the mammal (2%). Additionally, mammals are generally more active than snails, and this activity also consumes energy that could otherwise be used for growth.
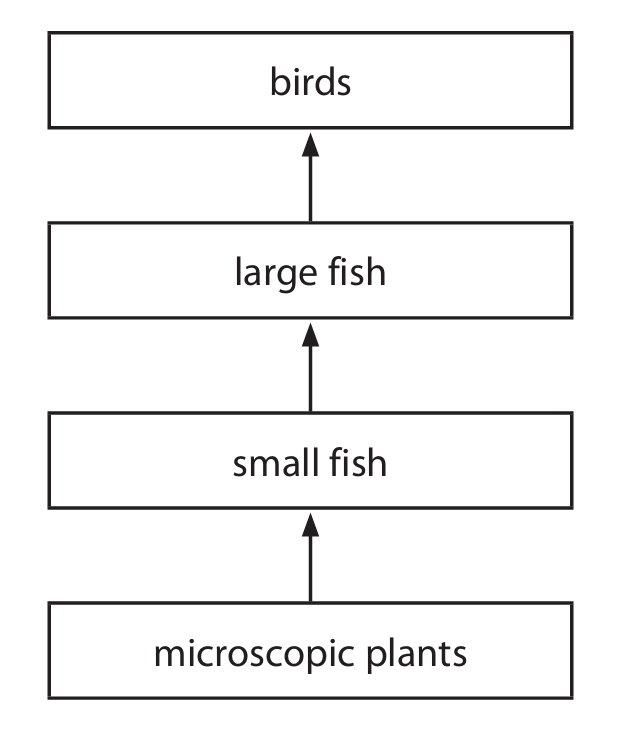
▶️ Answer/Explanation
(a) Small fish
Explanation: In a food chain, the primary consumer is the organism that eats the producer. The microscopic plants are the producers in this chain, as they make their own food. The small fish eat these plants, making them the primary consumers.
(b)(i) Photosynthesis
Explanation: The process that converts light energy into chemical energy is called photosynthesis. This occurs in the chloroplasts of plant cells, which contain chlorophyll, a green pigment that absorbs light energy. The plant uses this energy, along with carbon dioxide and water, to produce glucose (a form of chemical energy) and oxygen. The chemical equation for this process is: \[ 6CO_2 + 6H_2O \xrightarrow{\text{light energy}} C_6H_{12}O_6 + 6O_2 \] The glucose produced can then be stored as starch or used for the plant’s energy needs.
(b)(ii)
Explanation: Not all the energy stored in the microscopic plants is transferred to the small fish that eat them. There are several reasons for this. Firstly, a significant amount of energy is used by the plants themselves for their own life processes, such as respiration, which releases energy as heat. Secondly, not all parts of the plant may be eaten or digested by the fish; some material might be egested (passed out as waste). Additionally, some plants may die and decompose without being consumed, and the energy within them is transferred to decomposers instead of the small fish.
(c)
Explanation: Since birds lack teeth, they cannot mechanically break down food in their mouths. The gizzard, a muscular part of their digestive system, acts like a pair of teeth by grinding and crushing the fish. This mechanical breakdown significantly increases the surface area of the food. A larger surface area allows digestive enzymes to work more effectively, speeding up the chemical digestion of proteins and other nutrients in the fish, making them easier to absorb.
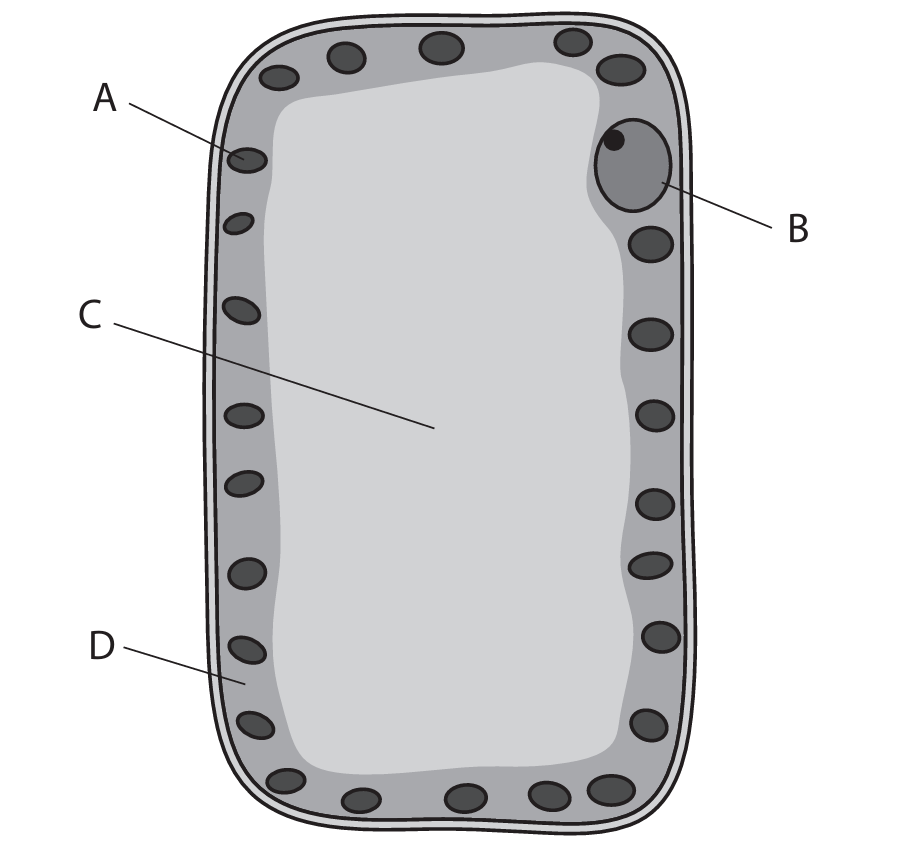
▶️ Answer/Explanation
(a)(i) B (cell wall)
A is incorrect because it is not the cell membrane.
C is incorrect because it is not mitochondria.
D is incorrect because it is not the nucleus.
(a)(ii) D (starch)
A is incorrect because it is not chlorophyll.
B is incorrect because it is not glucose.
C is incorrect because it is not glycogen.
(b)(i) An answer that makes reference to the following points:
- A: (chloroplasts absorb light) for photosynthesis / absorb light energy to make carbohydrate / eq
- B: (nucleus) controls protein synthesis / contains DNA / contains genes / controls cell / eq
- C: (vacuole) contains cell sap eq
- D: (cytoplasm) where chemical reactions occur
Additional guidance: Allow starch / glucose / sugar for A; allow maintains turgor / stores water / salts / pigments / toxins for C; allow where protein synthesis occurs / respiration occurs / medium for reactions for D.
(b)(ii) An answer that makes reference to two of the following points:
- contains chloroplasts to absorb light / for photosynthesis eq
- long / arranged in a vertical plane / large surface area / rectangular shape, to absorb most light / eq
- large vacuole to store water
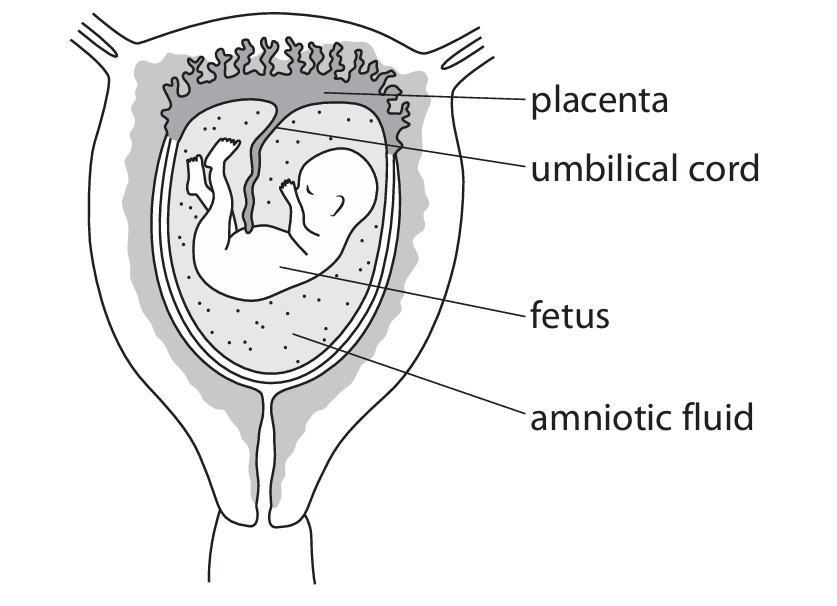
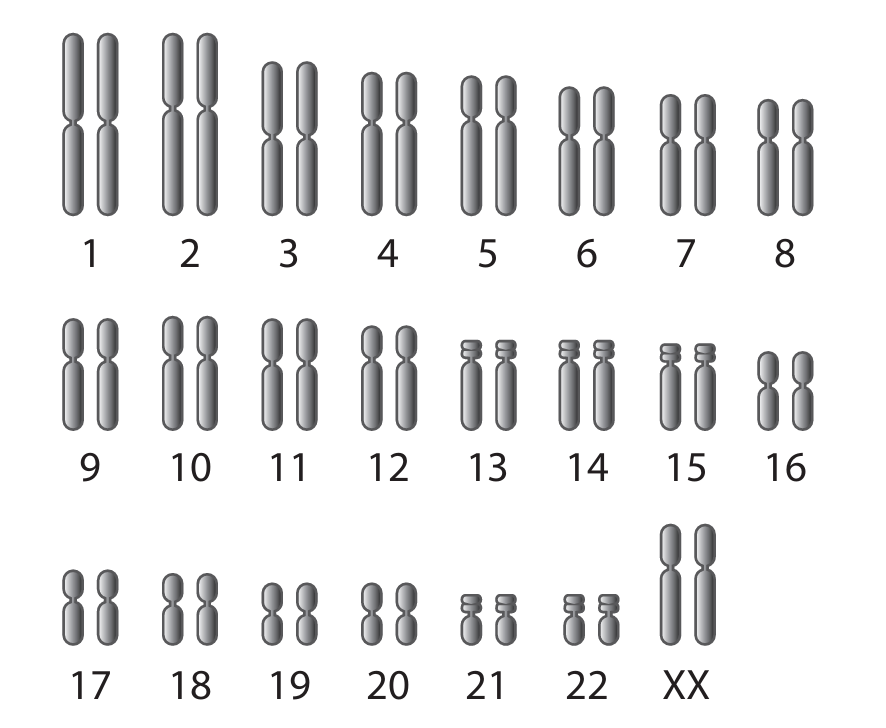
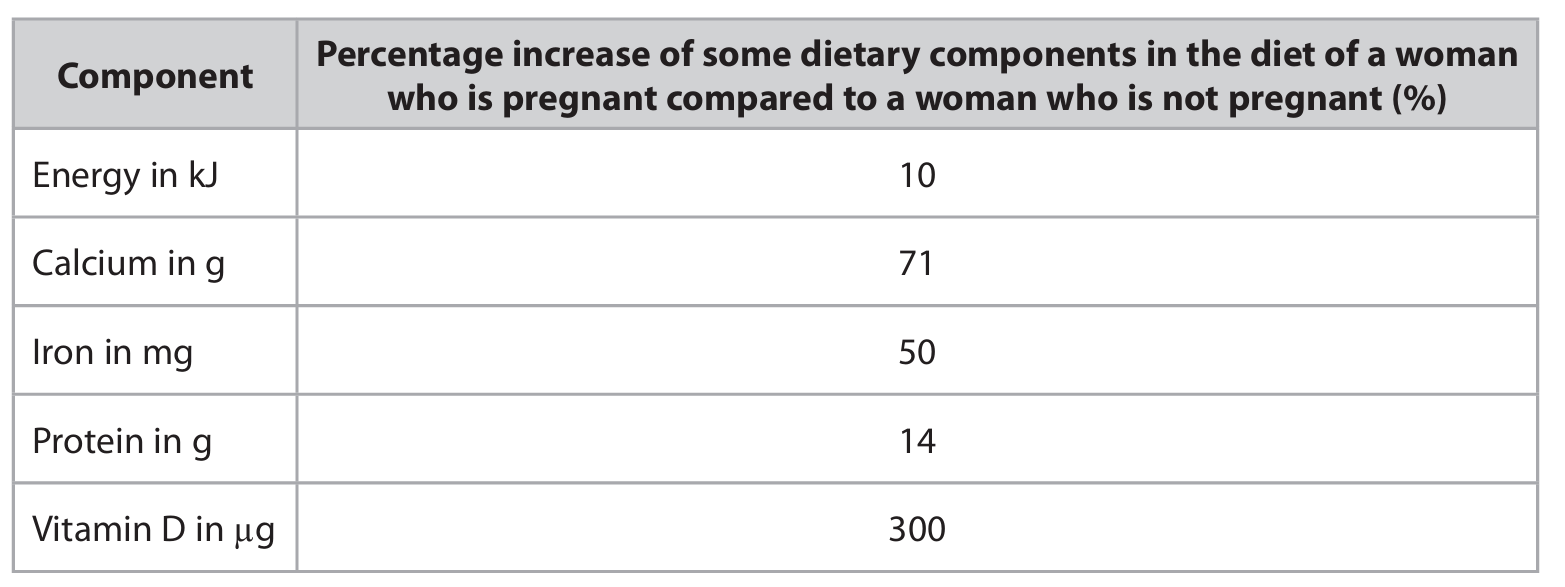
▶️ Answer/Explanation
(a)(i) An explanation that makes reference to three of the following points:
• oxygen
• glucose
• respiration
• energy / ATP
Example answer: The blood contains glucose and oxygen. These are used by the fetus’s cells in respiration to release energy in the form of ATP. This ATP provides the energy required for active transport processes to occur.
(a)(ii) An explanation that makes reference to two of the following points:
• antibodies (from mother)
• (bind to) antigens
• to kill bacteria / pathogen / virus eq
Example answer: Antibodies from the mother’s blood cross the placenta. These antibodies bind to antigens on pathogens, marking them for destruction or neutralizing them, which helps protect the fetus from infection.
(b) An answer that makes reference to two of the following points:
• fetus is female / a girl
• cells contain 46 chromosomes / 23 pairs / has a diploid number / has two sets of chromosomes / normal number of chromosomes / eq
• chromosomes have different lengths / sizes / shapes
Example answer: 1. The fetus is female because the sex chromosomes are XX. 2. The cell has the normal diploid number of 46 chromosomes (23 pairs).
(c)(i) An answer that makes reference to four of the following points:
• calcium for bone / teeth growth / bone / teeth development / prevent rickets
• protein to grow / for enzymes / antibodies / eq
• iron for haemoglobin / red blood cells / prevent anaemia
• vitamin D for bone growth / bone development / calcium absorption / strong bones
• more energy as baby is heavy / mother becomes heavy / more energy for fetal development / to carry baby / eq
Example answer: Extra calcium and vitamin D are required for the development of the fetus’s bones and teeth. Additional iron is needed to make haemoglobin for the increased blood volume and to prevent anaemia. More protein is required for the growth of fetal tissues and the production of enzymes and antibodies. Increased energy is needed as the mother’s body works harder and carries extra weight.
(c)(ii)
• \(9.0 \text{ mg} = 50\%\) more
• \(100\% = 9.0 \times 2 = 18 \text{ mg}\)
• Total needed \(= 18 + 9 = 27 \text{ mg}\)
Award full marks for correct numerical answer without working.
Final Answer: \(27 \text{ mg}\)

▶️ Answer/Explanation
(a) An explanation that makes reference to the following points:
- Amylase digests/catalyzes the breakdown of starch into maltose / glucose.
- These are reducing sugars, so the Benedict’s test will turn from blue to a red / green / yellow / orange precipitate.
(b) Rewritten method should include reference to at least four of the following control variables (1 mark each, max 4):
- Use the same volume and concentration of amylase solution.
- Use the same mass / size / volume / piece of bread.
- Use the same volume of water poured onto the bread.
- Allow the same amount of time for digestion before collecting the solution for testing.
- Use the same volume / concentration of Benedict’s reagent.
- Heat the Benedict’s test tubes for the same length of time and at the same temperature (e.g., in a water bath at \(80^\circ C\) for 2 minutes).
- Test a specific, stated range of temperatures (e.g., \(20^\circ C, 30^\circ C, 40^\circ C, 50^\circ C, 60^\circ C\)).
- Repeat each temperature and calculate a mean result.
(c) An answer that makes reference to four of the following points:
- Initially, as temperature increases, the rate of digestion increases.
- This is because particles (enzyme and substrate) have more kinetic energy, move faster, and collide more frequently.
- This continues until the optimum temperature is reached, where the rate is highest.
- Above the optimum temperature, the rate decreases rapidly.
- At high temperatures, the enzyme (amylase) denatures – the active site changes shape and the substrate (starch) can no longer bind.
- Therefore, the prediction is incorrect because the rate does not keep increasing indefinitely; it peaks and then falls (implied in the points above).

▶️ Answer/Explanation
(a) An explanation that makes reference to four of the following points:
- nitrates (for growth)
- for amino acids
- for protein
- magnesium for chlorophyll / chloroplasts
- so more photosynthesis
- more glucose
- phosphates used for ATP / DNA / eq
- potassium for control of water movement / eq
(b) An answer that makes reference to four of the following points:
- fertiliser leaches into river / washed into river / eq
- fertiliser would cause algal / plant growth / algal bloom / eutrophication
- dead algae are decomposed / broken down by bacteria / decomposers
- (bacterial) respiration would reduce oxygen
- means were calculated / readings repeated so experiment is reliable / valid
- measurements taken at same time of year / in April (so are valid)
- direction of river is past farm
- reduced oxygen could be due to other factors / sources of fertiliser from other fields
(c) • manure / faeces / dung / compost / seaweed / bone / blood / animal wastes / eq
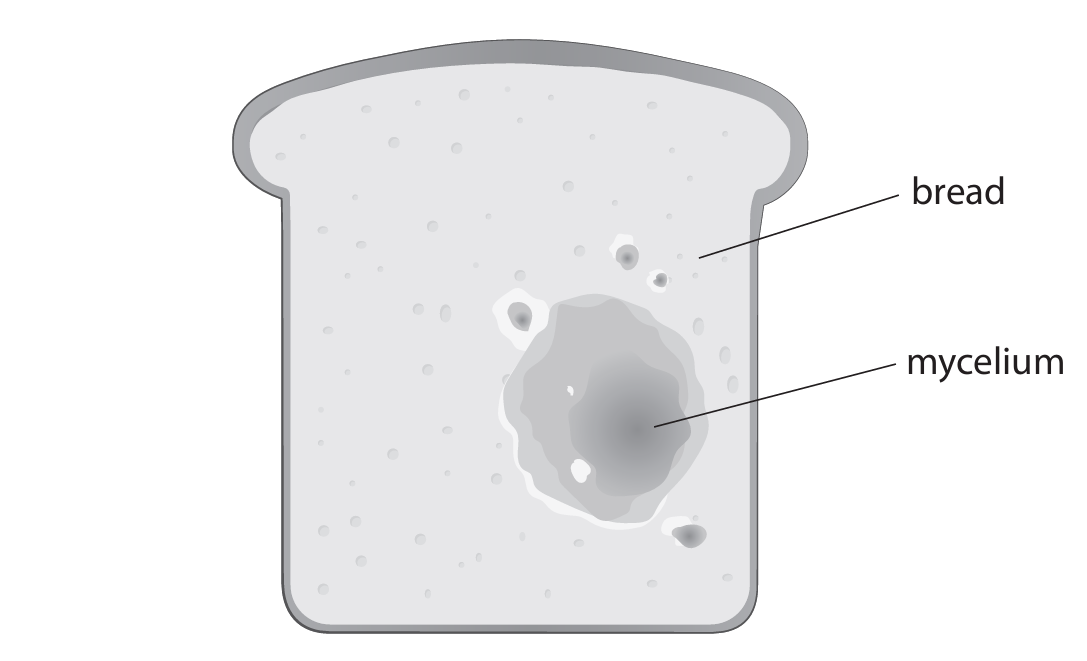
▶️ Answer/Explanation
(a) Add iodine solution to the bread sample. If starch is present, the color will change to blue-black.
Explanation: To test for starch, you would first obtain a small sample of the bread. Then, you would add a few drops of iodine solution directly onto the bread sample. Iodine solution is typically a brownish-yellow color. If starch is present in the bread, a chemical reaction occurs between the iodine and the starch molecules, resulting in a distinct color change to blue-black or sometimes a very dark blue-purple. This is a standard biochemical test for starch.
(b)(i) B fungus
Explanation: The diagram shows a mycelium, which is a characteristic feature of fungi. A mycelium is a network of fine, thread-like structures called hyphae that fungi use to absorb nutrients from their food source, in this case, the bread. Bacteria are single-celled and do not form mycelia. Protoctists are a diverse group, but none form a mycelium like this. Viruses are not considered living organisms and cannot grow on bread in this way.
(b)(ii) A amylase
Explanation: Starch is a large, complex carbohydrate polymer. To digest it, the fungus secretes the enzyme amylase. Amylase works by breaking down the chemical bonds in starch, converting it into smaller sugar molecules like maltose, which the fungus can then absorb and use for energy. Ligase is an enzyme involved in joining DNA fragments, not digesting food. Lipase breaks down lipids (fats), and protease breaks down proteins, neither of which is the correct enzyme for starch digestion.
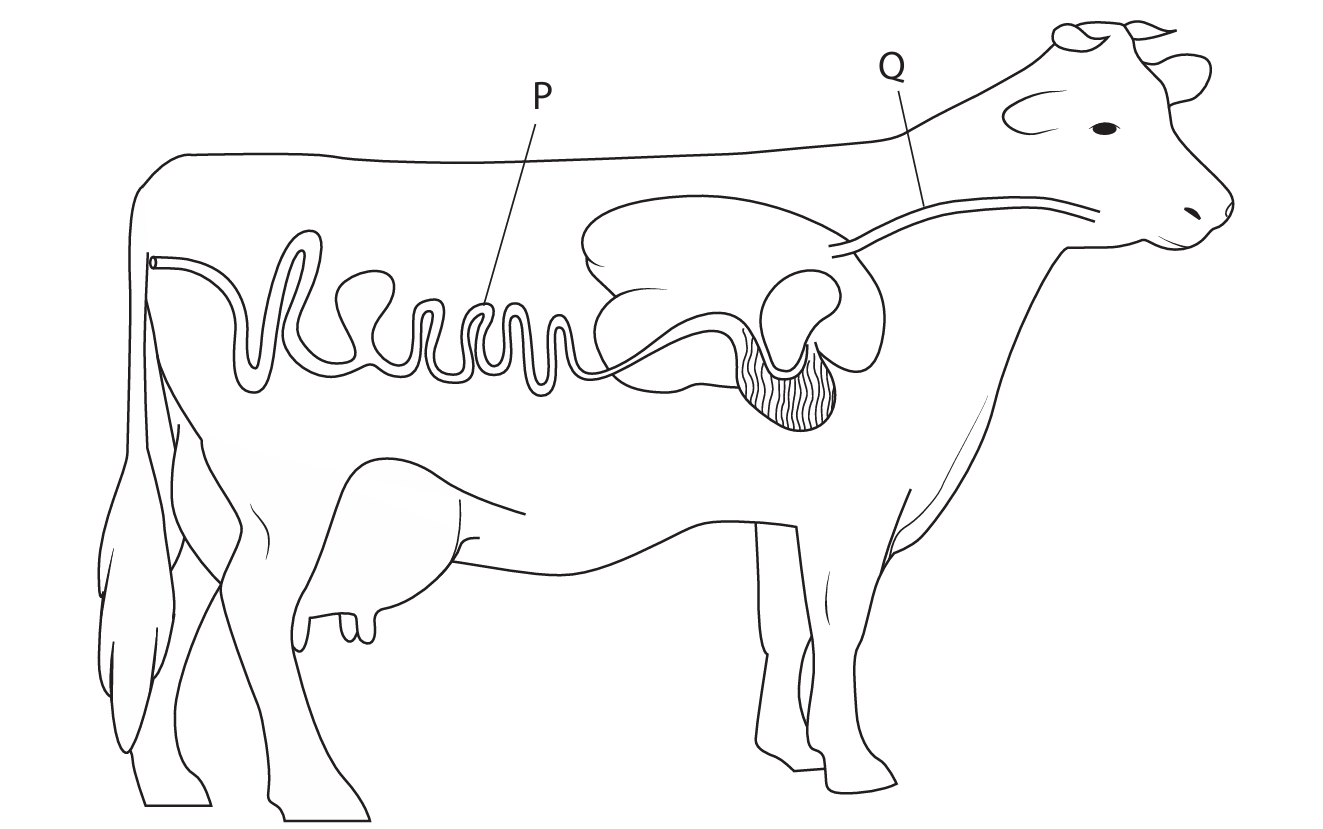
▶️ Answer/Explanation
(a)
P: Ileum / Small Intestine
Q: Rumen
Explanation: In the digestive system of a cow, which is a ruminant, part P is the ileum, which is the final section of the small intestine where further digestion and absorption of nutrients occur. Part Q is the rumen, the first and largest chamber of the stomach, where microbial fermentation of plant material takes place.
(b)
Explanation: The microorganisms in the cow’s stomach, particularly in the rumen, are essential because they produce enzymes like cellulase that break down cellulose, a major component of plant cell walls. Cows, like other mammals, cannot produce cellulase on their own. By digesting cellulose, these microbes release glucose and other simpler sugars that the cow can then absorb and use for energy through respiration. This symbiotic relationship allows the cow to efficiently utilize grass and other fibrous plant materials as its primary food source.
(c)
Explanation: The scientist’s claim has both supporting and opposing points. On one hand, using GH to increase milk yield per cow could mean that farmers need to keep fewer cows to produce the same amount of milk. Since cows are a significant source of methane (a potent greenhouse gas) released during digestion, having fewer cows could lead to less methane being released into the atmosphere. This could potentially reduce the greenhouse effect and slow down global warming.
However, there are limitations to this claim. Farmers might choose to keep the same number of cows to produce even more milk, negating any potential environmental benefit. Furthermore, cows are also kept for beef production, not just milk, so the overall number of cows might not decrease significantly. Finally, climate change is driven by many factors, including other greenhouse gases from sources like fossil fuels, so the impact of reducing methane from cows alone might be limited without addressing other major contributors.
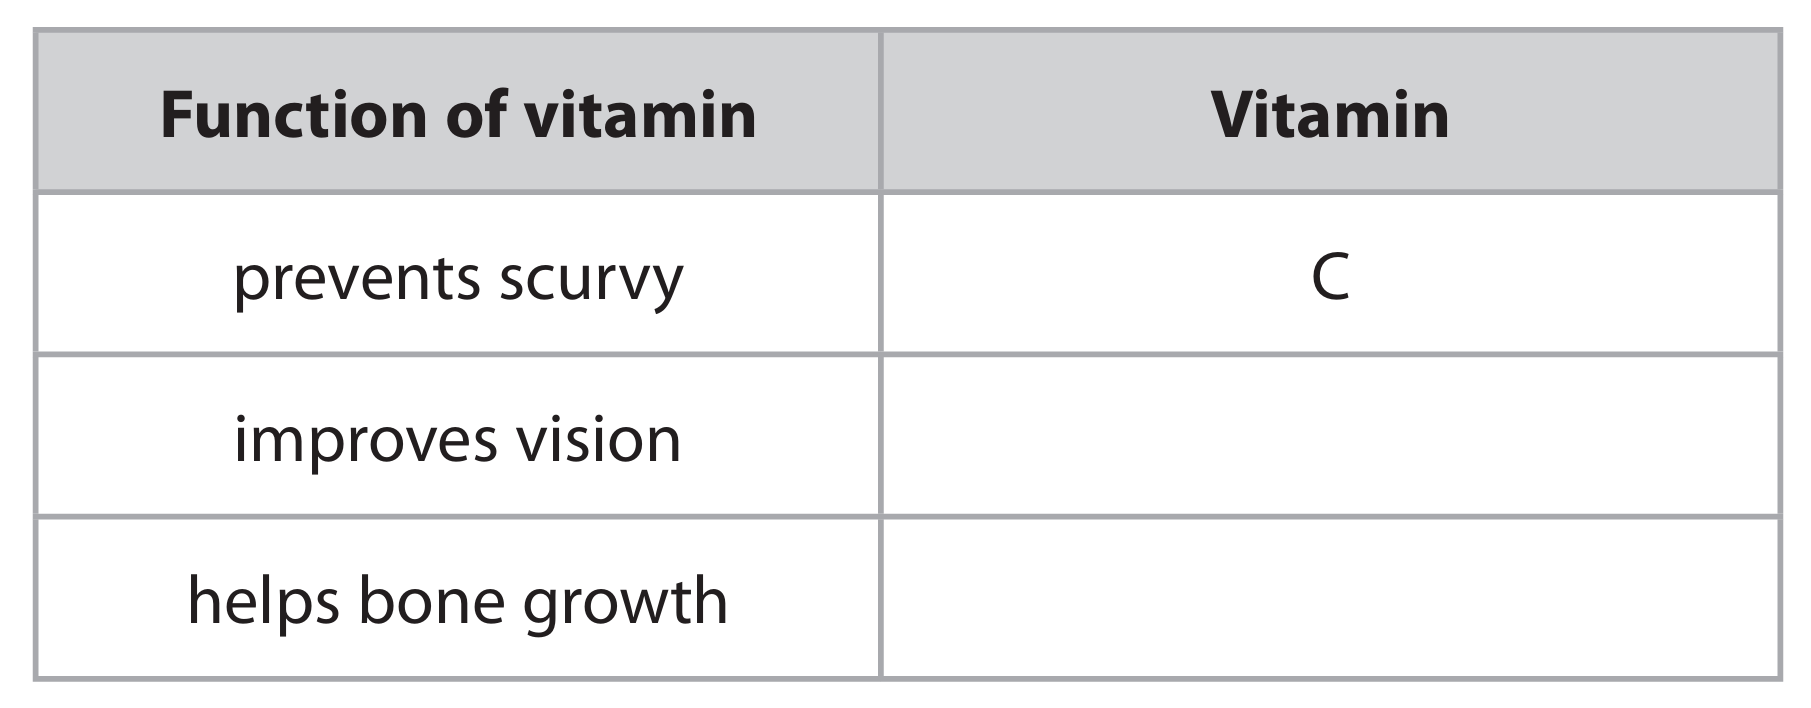
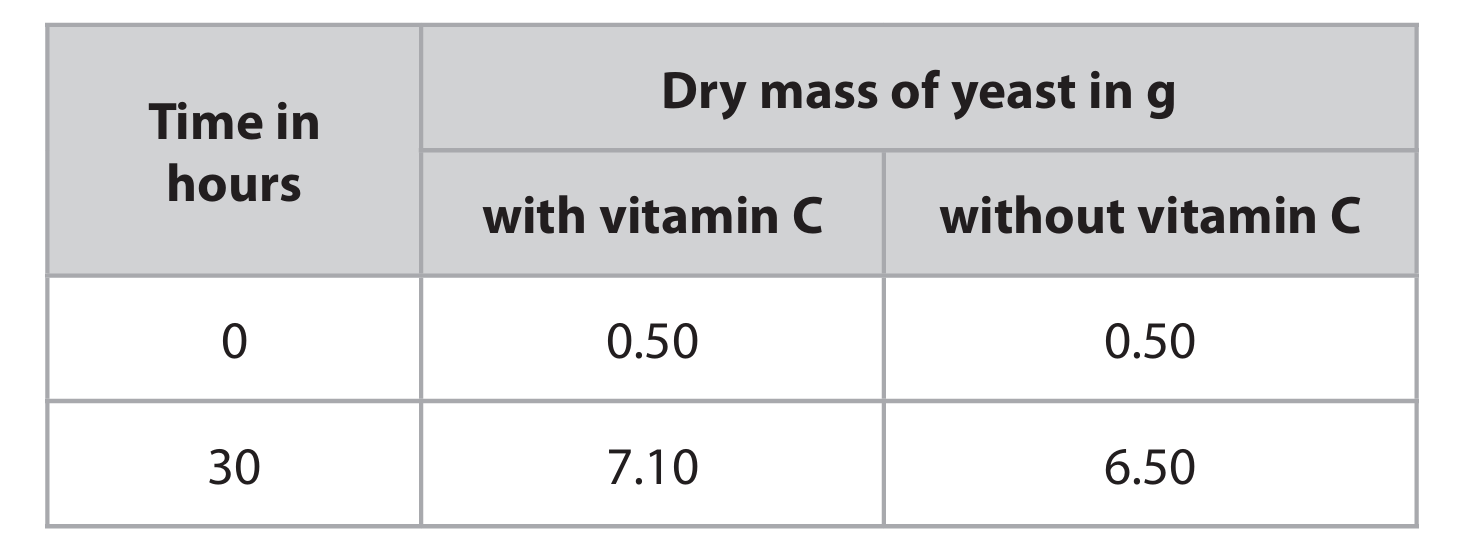
▶️ Answer/Explanation
(a)

Explanation: Vitamin A is essential for good vision, particularly in dim light, and helps maintain the health of the cornea. Vitamin D is crucial for bone growth and development as it helps the body absorb calcium and phosphorus from the diet, which are vital minerals for building strong bones.
(b)(i) Mean rate = 0.20 g per hour
Explanation: To calculate the mean rate of growth, we first determine the total mass increase and then divide by the time period. For the flask without vitamin C, the initial mass was 0.50 g and the final mass after 30 hours was 6.50 g. The total mass increase is 6.50 g – 0.50 g = 6.00 g. The mean rate of growth is then calculated by dividing the mass increase by the time: 6.00 g ÷ 30 hours = 0.20 g per hour.
(b)(ii) To find the dry mass, the contents of each flask should be poured through filter paper in a funnel to separate the yeast from the liquid. The yeast collected on the filter paper should then be placed in an oven to heat and dry it completely. Once fully dried, the residue (the dry yeast) should be weighed using a balance.
Explanation: This process removes all water content from the yeast, giving an accurate measurement of the actual biomass growth, excluding the weight of water. Heating in an oven ensures complete drying, and weighing the residue provides the dry mass.
(b)(iii) The dependent variable is the dry mass of yeast.
Explanation: The dry mass of yeast is what is being measured as the outcome of the experiment. It depends on the presence or absence of vitamin C, which is the independent variable being tested.
(b)(iv) Two other variables the student should control are:
- Temperature: This should be controlled because temperature affects enzyme activity. Yeast cells contain enzymes that catalyze respiration, and these enzymes have an optimum temperature. If temperature varies, it could change the rate of respiration and growth, confounding the results.
- pH: This should be controlled because pH can denature enzymes or alter their activity. Yeast enzymes work best within a specific pH range. An uncontrolled pH could lead to different growth rates not due to vitamin C but due to changes in enzyme efficiency.
Explanation: Controlling these variables ensures that any observed difference in yeast growth can be confidently attributed to the presence or absence of vitamin C, rather than other environmental factors. Temperature and pH are critical because they directly influence the metabolic processes within the yeast cells.

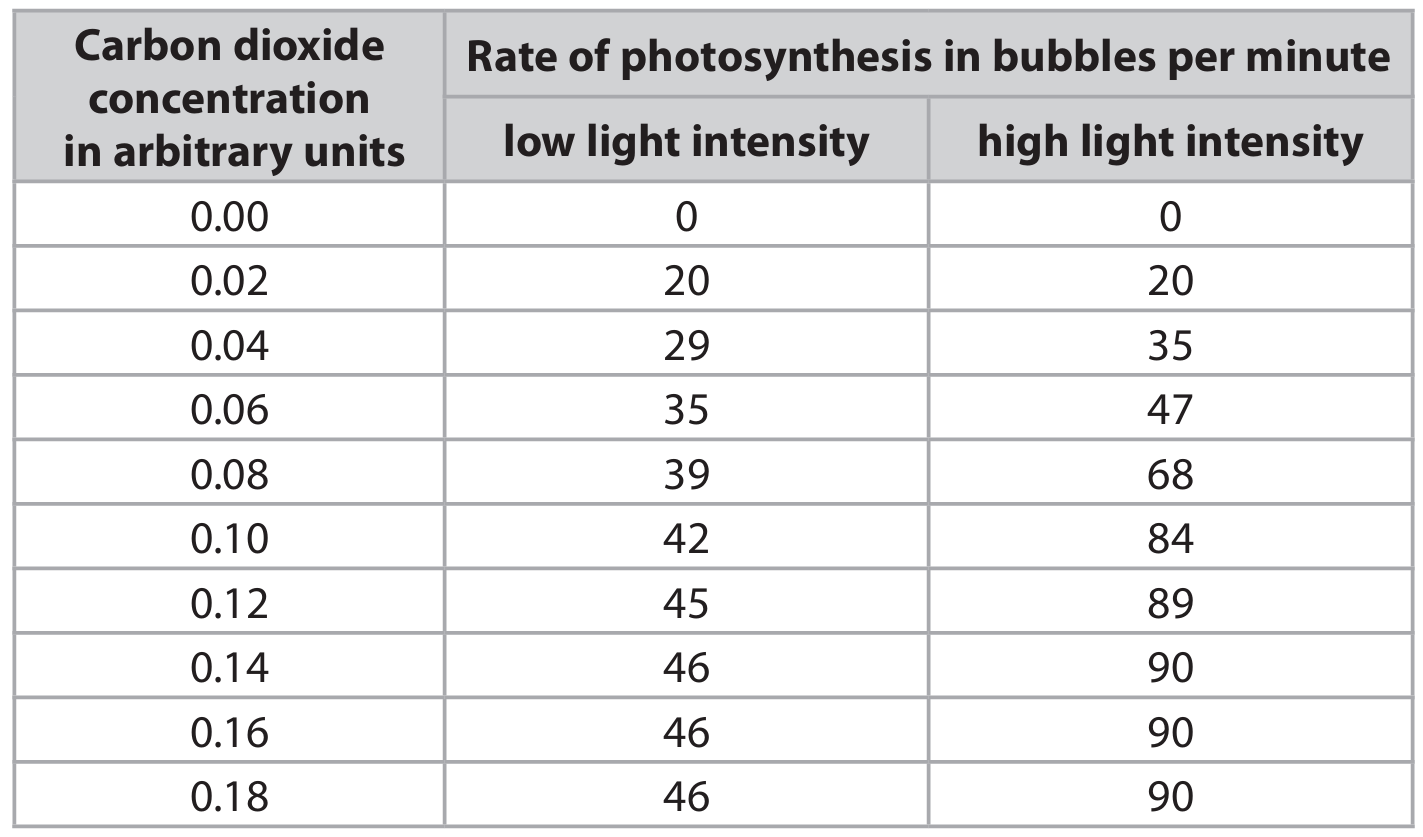
▶️ Answer/Explanation
(a)
Answer: The student should:
- Remove the leaf from the plant and boil it in water to soften it and break down the cell membranes.
- Transfer the leaf to a test tube containing ethanol and place it in a hot water bath to remove chlorophyll (decolorize the leaf).
- Remove the leaf and rinse it in water to rehydrate it and allow for better diffusion of the test solution.
- Place the leaf on a white tile and add iodine solution.
- Observe the color change: the part covered with black paper (no light) will remain yellow/brown (starch absent), while the exposed part (with light) will turn blue-black (starch present).
Explanation: This starch test procedure demonstrates that photosynthesis requires light. The covered part of the leaf, deprived of light, cannot photosynthesize and therefore does not produce starch. The exposed part, receiving light, can photosynthesize and produce starch, which is detected by the iodine test turning blue-black.
(b)(i)
Answer: The results show that:
- As carbon dioxide concentration increases, the rate of photosynthesis increases up to a certain point (around 0.12-0.14 units), after which it levels off (plateaus).
- At higher light intensities, the rate of photosynthesis is greater for the same carbon dioxide concentration compared to lower light intensities.
- At very low carbon dioxide concentrations (e.g., 0.00), no photosynthesis occurs regardless of light intensity.
- The initial increase (from 0.00 to 0.02) is similar for both light intensities, suggesting CO₂ is the main limiting factor here.
- The plateau indicates that another factor (like light intensity or temperature) becomes limiting once CO₂ is no longer scarce.
Explanation: Carbon dioxide is a key reactant in photosynthesis. Increasing its availability initially boosts the reaction rate. However, once all the available enzymes (e.g., Rubisco) are working at maximum capacity, or another factor like light becomes insufficient to drive the reactions faster, the rate cannot increase further, leading to the plateau. The higher rate under high light intensity shows that light provides the necessary energy to power the photosynthetic process more effectively when CO₂ is available.
(b)(ii)
Answer: The student could change the light intensity by:
- Using a lamp with a different wattage/brightness.
- Changing the distance between the light source and the plant (closer for higher intensity, farther for lower intensity).
- Using a dimmer switch to adjust the brightness of the lamp.
- Placing filters between the light source and the plant.
Explanation: Altering the amount of light energy reaching the plant allows the student to investigate how light intensity acts as a limiting factor for photosynthesis, independent of or in conjunction with carbon dioxide concentration.
(b)(iii)
Answer: The dependent variable is the rate of photosynthesis.
Explanation: This is the variable that is measured as a result of changing the independent variables (carbon dioxide concentration and light intensity). It is directly quantified by counting the number of bubbles (assumed to be oxygen) produced per minute.
(b)(iv)
Answer: The student could control biotic variables by using the same species of plant, plants of the same age/size/health, or the same individual plant for all trials.
Explanation: Biotic variables are living factors that could affect the outcome. Using genetically similar plants or the same plant ensures that differences in photosynthetic rate are due to the experimental conditions (light, CO₂) and not inherent differences between the plants themselves.
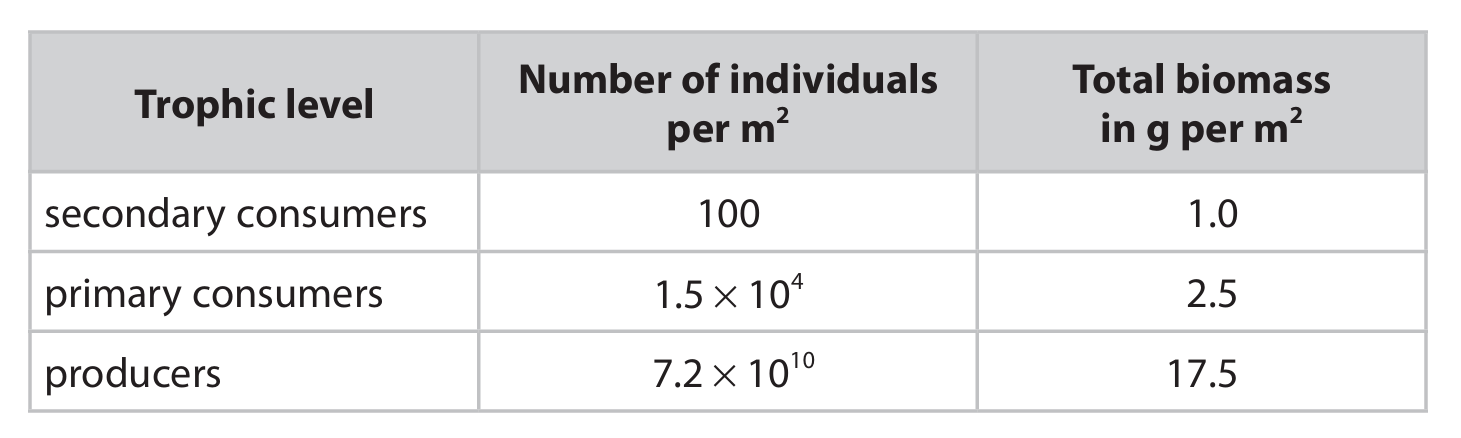

▶️ Answer/Explanation
(a) C – the organisms of all species in a habitat.
Explanation: A community in ecology refers specifically to all the populations of different species that live and interact together in a particular area or habitat. Option A describes an ecosystem, option B describes a habitat, and option D describes a population.
(b)(i) Mean mass = \(1.67 \times 10^{-4}\) g
Explanation: To find the mean mass of a single primary consumer, we divide the total biomass by the total number of individuals. The total biomass for primary consumers is 2.5 g/m², and the number of individuals is \(1.5 \times 10^4\), which is 15,000. The calculation is therefore \(2.5 \div 15,000 = 0.0001667\) g. Converting this to standard form gives \(1.667 \times 10^{-4}\) g. This very small mass makes sense as many primary consumers in a pond, like small aquatic insects or zooplankton, are tiny.
(b)(ii)
Explanation: A pyramid of biomass represents the total dry mass of living organisms at each trophic level. For this pond community, the pyramid should have three horizontal bars, each representing a trophic level. The widest bar at the bottom represents the producers (17.5 g/m²), a narrower bar above represents the primary consumers (2.5 g/m²), and the narrowest bar at the top represents the secondary consumers (1.0 g/m²). This typical pyramid shape shows that biomass decreases at higher trophic levels because energy is lost as it moves up the food chain.
(c)(i)
Explanation: Egestion is the process where undigested food material is expelled from the body as faeces. This undigested material still contains chemical energy that was present in the consumed food. Since this energy is not absorbed and assimilated by the consumer, it is lost from the food chain and is not available to be transferred to the next trophic level. For example, if a primary consumer eats a plant but cannot digest all the cellulose, the energy in that undigested cellulose is egested and lost.
(c)(ii)
1. Respiration. A significant portion of the energy that is assimilated by an organism is used for respiration to fuel life processes like movement, maintaining body temperature, and pumping ions. This energy is converted to heat and lost to the environment, making it unavailable for the next consumer.
2. Excretion. Energy is also lost through the waste products of metabolism, such as urine. These excretory products contain chemical energy that the organism has not utilized.
Other valid reasons include: Uneaten parts (organisms not fully consumed die and decompose), or Death (organisms that die without being eaten).
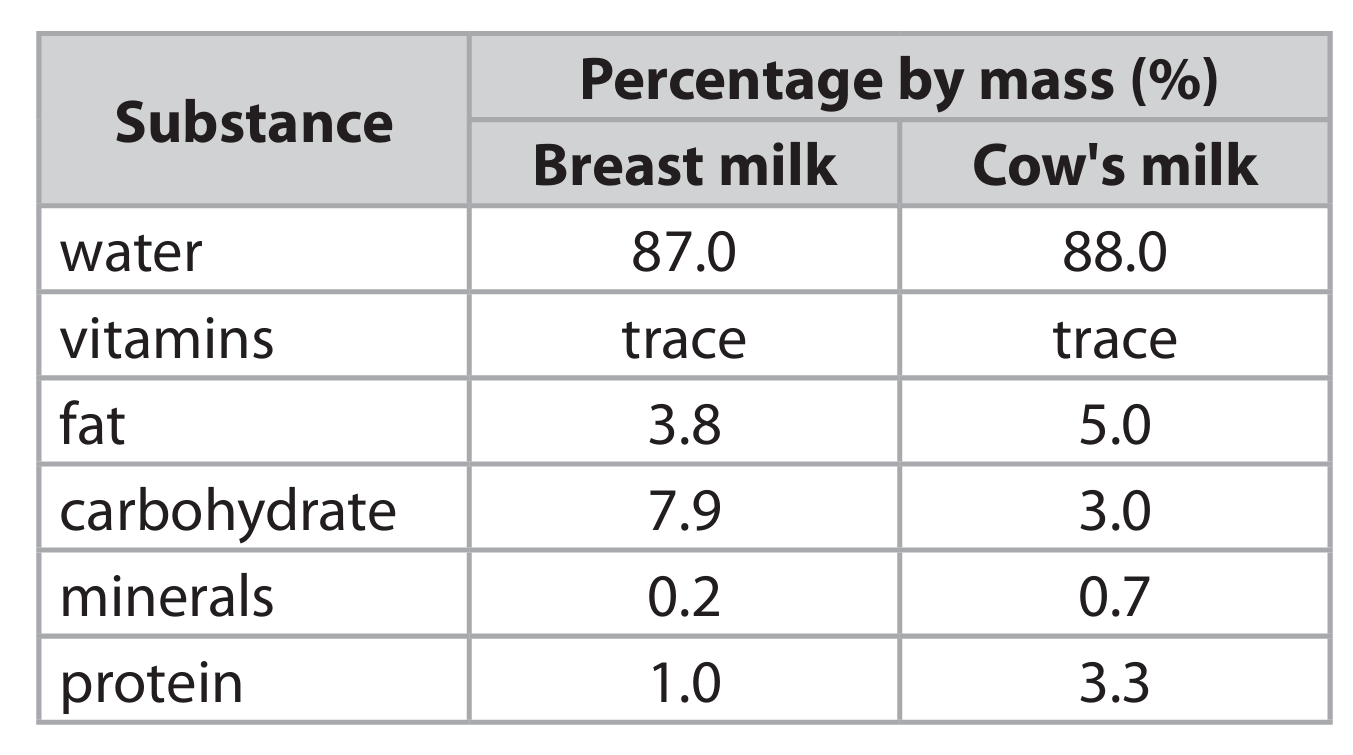
▶️ Answer/Explanation
(a)
Discussion Points:
- Cow’s milk contains a higher percentage of fat (5.0%) compared to breast milk (3.8%). This could potentially contribute to a higher calorie intake and, if not managed, might increase the risk of obesity in babies.
- The protein content in cow’s milk (3.3%) is significantly higher than in breast milk (1.0%). A high protein load can be difficult for a young baby’s immature kidneys to process and may also increase the risk of future obesity.
- Minerals are more abundant in cow’s milk (0.7%) than in breast milk (0.2%). While minerals are essential, an excessive amount, particularly certain ones, might not be ideal for a baby’s developing system.
- Cow’s milk has a much lower carbohydrate content (3.0%) compared to breast milk (7.9%). Carbohydrates, primarily lactose, are a vital source of quick energy for a rapidly growing baby. The lower level in cow’s milk might not provide sufficient energy.
- The vitamin and water content are relatively similar between the two, which is positive.
- Beyond the table data, breast milk contains crucial antibodies from the mother that help protect the baby from infections. Cow’s milk lacks these human-specific antibodies.
- Furthermore, cow’s milk given to babies might sometimes contain traces of antibiotics used in cattle, which is not a concern with breast milk.
In summary, while cow’s milk shares some similarities, its significantly different macronutrient profile (higher fat/protein, lower carbs) and the absence of protective antibodies make it generally unsuitable as a direct alternative for young babies without proper modification, which is why infant formula (designed to mimic breast milk more closely) is recommended if breastfeeding isn’t possible.
(b)
Two ways to provide additional vitamin D:
- Dietary Supplements: Vitamin D drops or liquid supplements specifically designed for infants can be given directly to the child as advised by a healthcare professional.
- Fortified Foods: As the child starts weaning, incorporating foods fortified with vitamin D, such as certain infant cereals, fortified dairy products (like yogurt), or fortified spreads, can help increase their intake. Safe, short periods of sunlight exposure (e.g., 10-15 minutes a few times a week) also helps the body synthesize vitamin D, but this must be done with extreme care to avoid sunburn.
(c)
Testing for Protein using the Biuret Test:
- Place a small sample of the cow’s milk (about 2 cm³) into a clean test tube.
- Add an equal volume of sodium hydroxide solution (NaOH) to the test tube. Gently shake or swirl the tube to mix the contents thoroughly.
- Next, add a few drops of very dilute copper(II) sulfate solution (CuSO₄) to the mixture. Do not add excess. Gently shake the tube again to ensure it’s well mixed.
- Observation: If protein is present in the cow’s milk, the solution will change color from light blue to a purple or lilac/violet color. The intensity of the color can sometimes indicate the relative amount of protein present.
- A negative result, where no protein is present, would result in the solution remaining its original blue color (though the Biuret reagent itself is blue, the key change is to purple/lilac).
Note: Safety precautions, such as wearing goggles and handling chemicals carefully, should always be followed.