▶️ Answer/Explanation
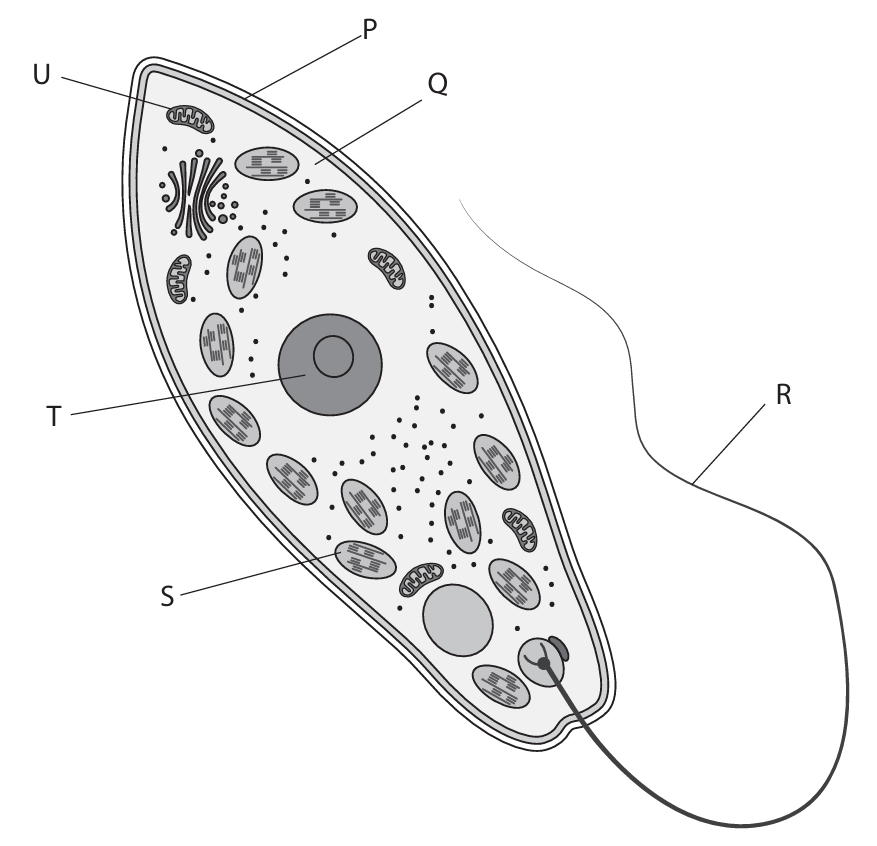
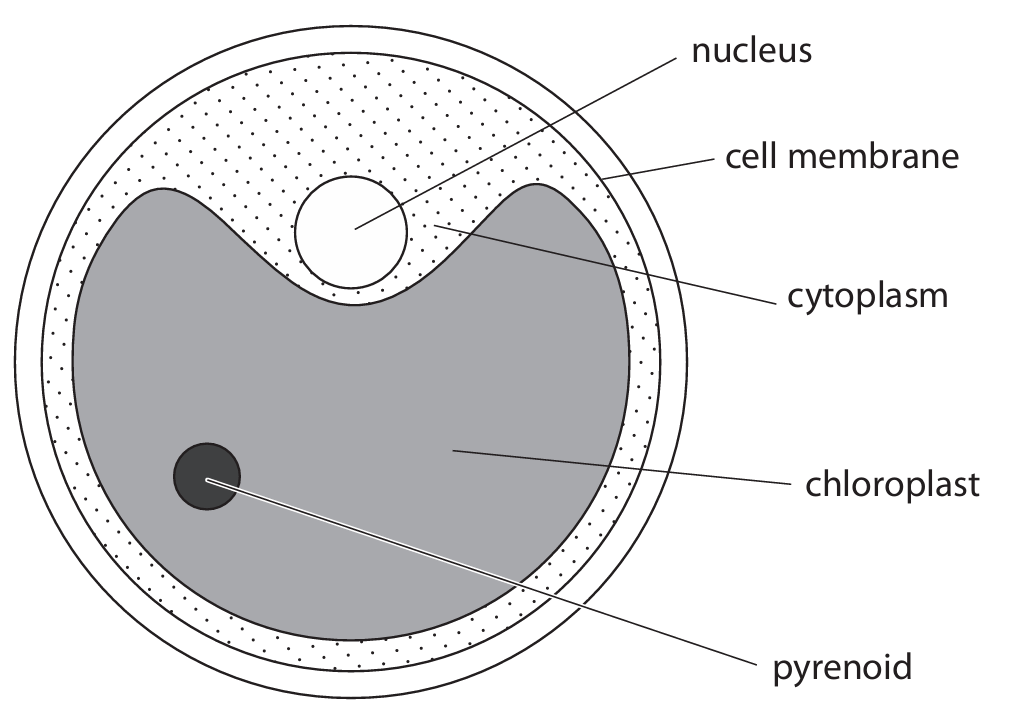
(a)(i) C (protocysts)
A is not the answer as Euglena is not in bacteria
B is not the answer as Euglena is not in fungi
D is not the answer as Euglena is not in viruses
(a)(ii) D (U)
A is not the answer as P is the membrane
B is not the answer as R is the flagellum
D is not the answer as T is the nucleus
(a)(iii) D (T)
A is not the answer as P is the membrane
B is not the answer as Q is the cytoplasm
C is not the answer as R is the flagellum
(a)(iv) A (P)
B is not the answer as Q is the cytoplasm
C is not the answer as R is the flagellum
D is not the answer as U is the mitochondrion
(b) C (S)
A is not the answer as P is the cell membrane
B is not the answer as Q is the cytoplasm
D is not the answer as T is the nucleus
(c) • structure / part of a cell with particular function / purpose / role (s) /eq
(d) An explanation that makes reference to three of the following:
• mitochondria / U (1)
• (mitochondrion) respiration / releases energy / provides ATP / eq (1)
• flagellum / R / tail / eq (1)

Most-appropriate topic codes (Edexcel IGCSE Biology):
- 2(e): Nutrition – Flowering plants — parts (a), (b), (c)
- 2(d): Movement of substances into and out of cells — part (d)
- 2(f): Respiration — parts (b), (d)
- 3(h): Transport – Flowering plants — parts (c), (d)
- Appendix 5: Suggested practical investigations — part (b)
▶️ Answer/Explanation
(a) Energy conversion during photosynthesis:
from light/solar energy to chemical energy
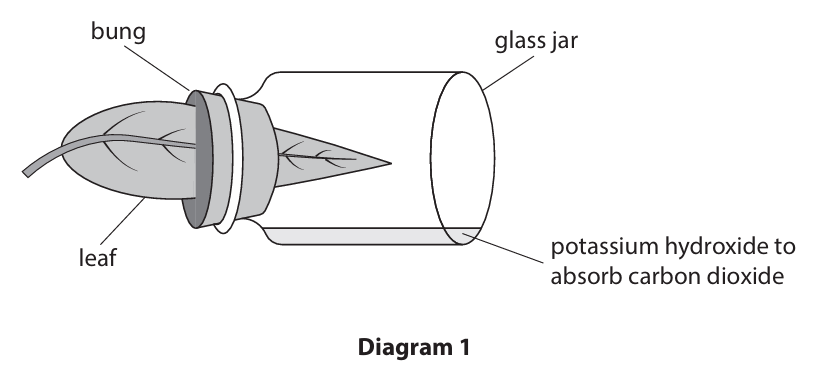
(b)(i) To remove all starch from the plant’s leaves:
• Keep the plant in darkness for 12/24/48 hours
• This allows all starch to be used up in respiration
(b)(ii) Diagram 2 results:
• Left side (outside flask): black/blue/starch present
• Right side (inside flask): yellow/orange/brown/no starch
The part exposed to carbon dioxide (outside flask) tests positive for starch, while the part without carbon dioxide (inside flask) tests negative.
(c) Functions of two named mineral ions:
Nitrate ions: needed for amino acids/proteins/enzymes/DNA
Magnesium ions: needed for chlorophyll/chloroplasts/photosynthesis
Other acceptable pairs:
• Iron: for chlorophyll/chloroplasts/photosynthesis/respiration
• Phosphate: for DNA/ATP/cell membranes
• Calcium: for cell walls/cell membranes
• Potassium: for water balance/enzymes/photosynthesis/respiration
(d) Why plants in waterlogged soil cannot absorb mineral ions:
• Mineral ions are absorbed by active transport
• Waterlogged soil has no/less oxygen
• Therefore, there is no/less respiration
• Resulting in no/less energy/ATP for active transport
▶️ Answer/Explanation
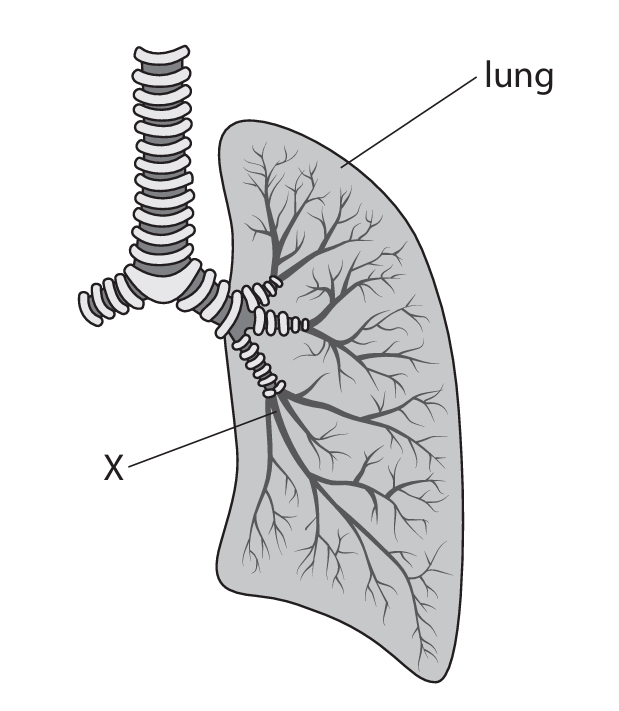
(a)(i) B (bronchiole)
A is incorrect as it is not an alveolus
C is incorrect as it is not a bronchus
D is incorrect as it is not a trachea
(a)(ii) An answer that makes reference to the following:
• it has more than one tissue / is a group of tissues / is a collection of tissues / made of multiple tissues (1)
(a)(iii) An explanation that makes reference to the following:
• diaphragm moves down / flattens (1)
• (chest / thorax) volume increases (1)
• (chest / thorax) pressure decreases / air flows from high pressure to low pressure / down a pressure gradient (1)
(b)(i) • \(35 \times 70 \times 30 = 73,500\) cm³ (2)
One mark for ×35 or ×70 or ×30 or 2450 or 1050 or 2100
Accept 74,000 or 73,000 for two marks
Correct answer gains both marks
(b)(ii) An explanation that makes reference to three of the following:
1. oxygen use lower in smokers / lower rate of oxygen use (1)
2. tar (in cigarettes) (1)
3. causes emphysema / mucus builds up / mucus not removed / cilia damaged (1)
4. less surface area (of alveoli) (1)
5. less diffusion of oxygen (into blood) (1)
6. carbon monoxide binds to haemoglobin (reducing oxygen) (1)
7. causes narrowing of arteries / blocks blood vessels (reducing flow of oxygenated blood) (1)
▶️ Answer/Explanation
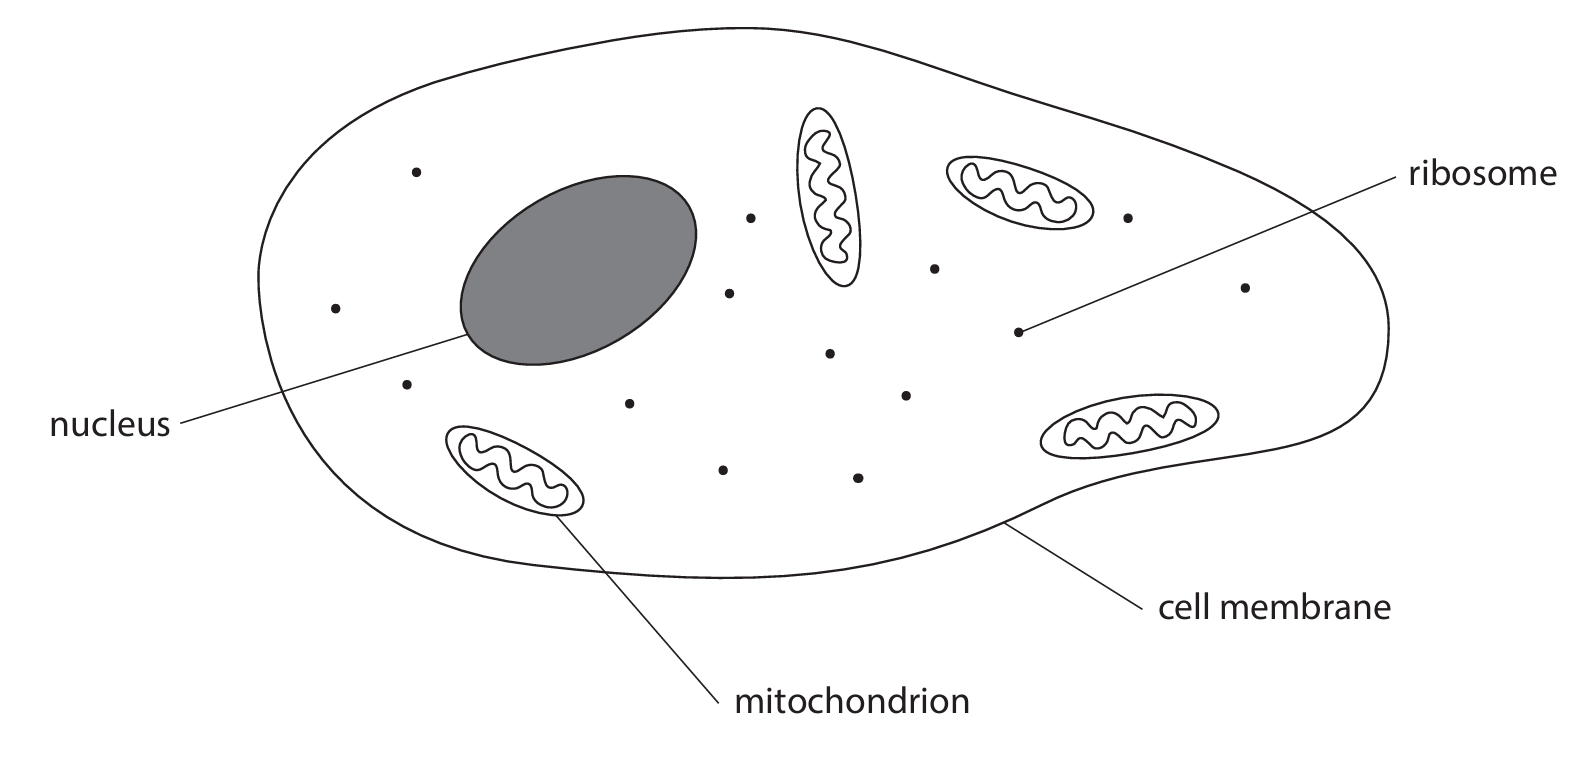
(a)(i) D (ribosome)
A is incorrect as cell membrane does not synthesise protein
B is incorrect as mitochondria does not synthesise protein
C is incorrect as the nucleus does not synthesise protein
(a)(ii) C (mitochondrion, nucleus and ribosome)
A is incorrect as ribosomes are also present in both
B is incorrect as nuclei are also present in both
D is incorrect as mitochondrion is also present in both
(b)(i) 40:1
Example calculation:
• Number of mitochondria per 10 μm3 for sperm = 12
• Volume of sperm cell = (75 ÷ 12) × 10 = 62.5 μm3
• Ratio = 2500:62.5 = 40:1
(b)(ii) An explanation that makes reference to four of the following:
• villus has highest number of mitochondria per cell / sperm has lowest number of mitochondria per cell
• sperm has highest number of mitochondria per 10 μm3 / skin has lowest number per 10 μm3
• mitochondria perform aerobic respiration / make ATP / release energy
• villus cells do active transport (so need lot of energy)
• sperm cells move / swim (so need lot of energy)
• skin cells have few active processes / use little energy
▶️ Answer/Explanation
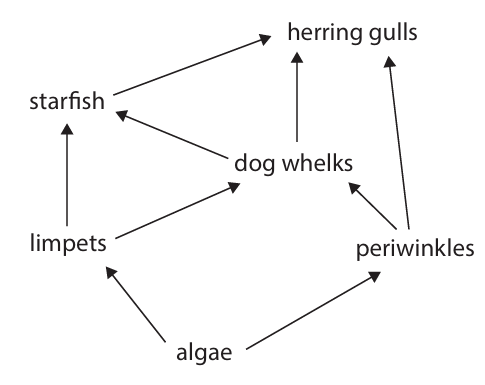
(a)(i) C (secondary consumer and tertiary consumer)
A is incorrect as it is not a primary consumer
B is incorrect as it is not a primary consumer
D is incorrect as it is also a tertiary consumer
(a)(ii) • all of (the organisms of) one / a species in an area (at one time)
(a)(iii) An explanation that makes reference to three of the following:
• (energy lost) from movement
• (energy lost) from respiration / heat loss
• (energy lost) as not some not eaten / are inedible
• (energy lost) as some not digested / indigestible / faeces / egestion
• (energy loss) due to death and decay / (energy lost) to other food chains
(b)(i) A description that makes reference to three of the following:
• quadrat / square in gridded area
• place randomly / choose random coordinates
• repeats
• count limpets (in quadrat / square)
• scale up for whole area multiply by area
(b)(ii) • time of day / location / area / position on shore / species of limpet / same day in August
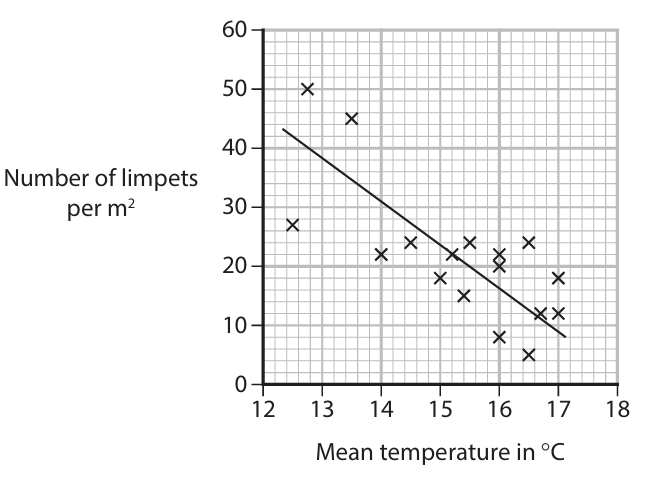
(b)(iii) An answer that makes reference to five of the following:
1. fossil fuel use releases carbon dioxide
2. carbon dioxide is a greenhouse gas / may cause global warming
3. increased temperature reduces limpet number
4. less food / energy for starfish / dogwhelks / gulls
5. dogwhelks / gulls / starfish / secondary consumers would decrease
6. algae would increase / less algae eaten / more food for periwinkles
7. there are anomalies / outliers / not all close to line of best fit
8. other factors may affect limpet population / other greenhouse gases may have effect
9. not done for long enough time so less reliable OR done for long time / 17 years so reliable
10. data only for one month / only August / only one location / only one shore / only looks at one species
▶️ Answer/Explanation
(a)(i) • producer / first trophic level (1)
(a)(ii) • tertiary consumer / third consumer / fourth trophic level (1)
(b)(i)
Calculation method (not marking points):
Full marks for correct answer with no working.
Example: Measured length = 75 mm = 75 × 1000 = 75000 µm
Magnification = image size / actual size = 75000 µm / 10 µm = × 7500 (2)
(Allow answers in the range 7400 to 7600 depending on measurement. Ignore units in final answer.)
(b)(ii)
Calculation method (not marking points):
Full marks for correct answer with no working.
Example using formula: \( V = \frac{4}{3} \pi r^3 \)
\( r^3 = 5^3 = 125 \)
\( V = \frac{4}{3} \times 3.14 \times 125 = \frac{4 \times 392.5}{3} = \frac{1570}{3} = 523.33 \)
Volume = 523 µm3 (2) (Allow 522–524). If they round 4/3 to 1.33, answer will be = 522.
(b)(iii) A description that includes two of the following points:
• absorbs / traps (sun)light / light energy (1)
• site of photosynthesis (1)
• produces glucose / carbohydrate / sugar / starch (1)
(Note: Ignore “uses”. “Converts light energy into chemical energy” scores the first and third marking points.) (2)
(b)(iv) A description that includes the following points:
• provides an energy store / energy reservoir / stores carbohydrate (1)
• (can be broken down to release energy in) respiration (1) (2)
(c) A description that includes four of the following points:
• use quadrats (1)
• random sampling (1)
• use coordinates / grid to select sample positions (1)
• count number of individuals / plants in each quadrat (1)
• repeat and (calculate) mean / average (1)
• multiply (mean count) by size of (total) area to estimate population size (1)
(Note: “Use quadrats” scores the first and fifth marking points.) (4)

▶️ Answer/Explanation
(a)(i) diaphragm
(a)(ii) C (increases, decreases)
A is incorrect because the volume increases.
B is incorrect because the volume increases.
D is incorrect because the pressure decreases.
(a)(iii) Two from:
• jar cannot expand / is rigid (ribcage can move)
• no intercostal muscles / no ribs
• no pleural membrane / no pleural fluid / balloons do not touch sides of jar
(b)(i) D (trachea → bronchus → bronchiole → alveolus)
A is incorrect because bronchiole is not first.
B is incorrect because bronchus is not first.
C is incorrect because bronchiole is not second.
(b)(ii) \( 4.8 \times 10^8 \times 4.0 \times 10^{-3} = 1.92 \times 10^6 \) mm2 (or \( 1.9 \times 10^6 \) mm2)
(b)(iii) Two adaptations, each with explanation:
1. One cell thick / thin walls → short diffusion pathway / rapid diffusion.
2. Surrounded by capillaries / good blood supply → maintains concentration gradient.
3. Moist surface → gases dissolve for easier diffusion.
(b)(iv) Description including three of:
• Use limewater or hydrogen carbonate indicator.
• Measure time for limewater to go cloudy / indicator to change.
• Compare results with and without exercise / before and after.
• Control variables (same volume, temperature, person).
• Repeat and calculate mean.
▶️ Answer/Explanation
(a) \( C_6H_{12}O_6 + 6O_2 \rightarrow 6CO_2 + 6H_2O \)
(b)(i) An explanation that makes reference to two of the following:
• The bubble would not move / \( CO_2 \) also moves / shifts the bubble (1)
• Carbon dioxide is produced/released (1)
• Only oxygen consumption is measured (1)
(b)(ii) • Use a water bath (1)
(c)(i) \( 22 + 25 + 24 = 71 \)
\( 71 \div 3 = 23.7 \) (or 24) mm (2)
(c)(ii) An explanation that makes reference to three of the following:
• Increases (kinetic) energy of molecules / molecules move faster (1)
• Collide more frequently / form more enzyme-substrate complexes (1)
• Respiration (rate) increases (1)
• More oxygen consumed / oxygen used faster (1)
• Reference to/nearer to optimum temperature for enzymes (1)

▶️ Answer/Explanation
(a)(i) B (chitin)
Explanation: The cell walls of fungal cells, including yeast, are primarily composed of chitin, a strong and flexible polysaccharide. Cellulose is found in plant cell walls, while glycogen and starch are storage polysaccharides and are not structural components of cell walls.
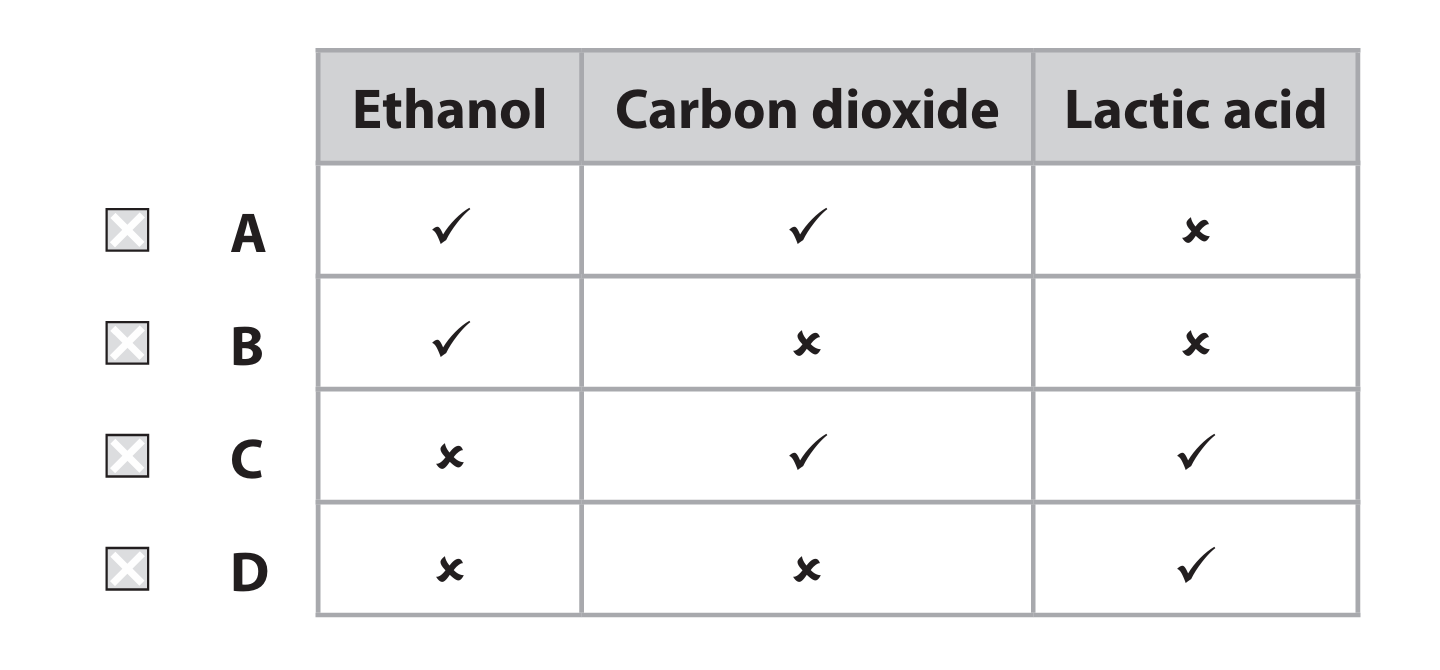
(a)(ii) A
Explanation: Yeast undergoes alcoholic fermentation during anaerobic respiration. The products of this process are ethanol and carbon dioxide. Lactic acid is not produced; it is a product of anaerobic respiration (lactic acid fermentation) in certain bacteria and animal muscle cells.
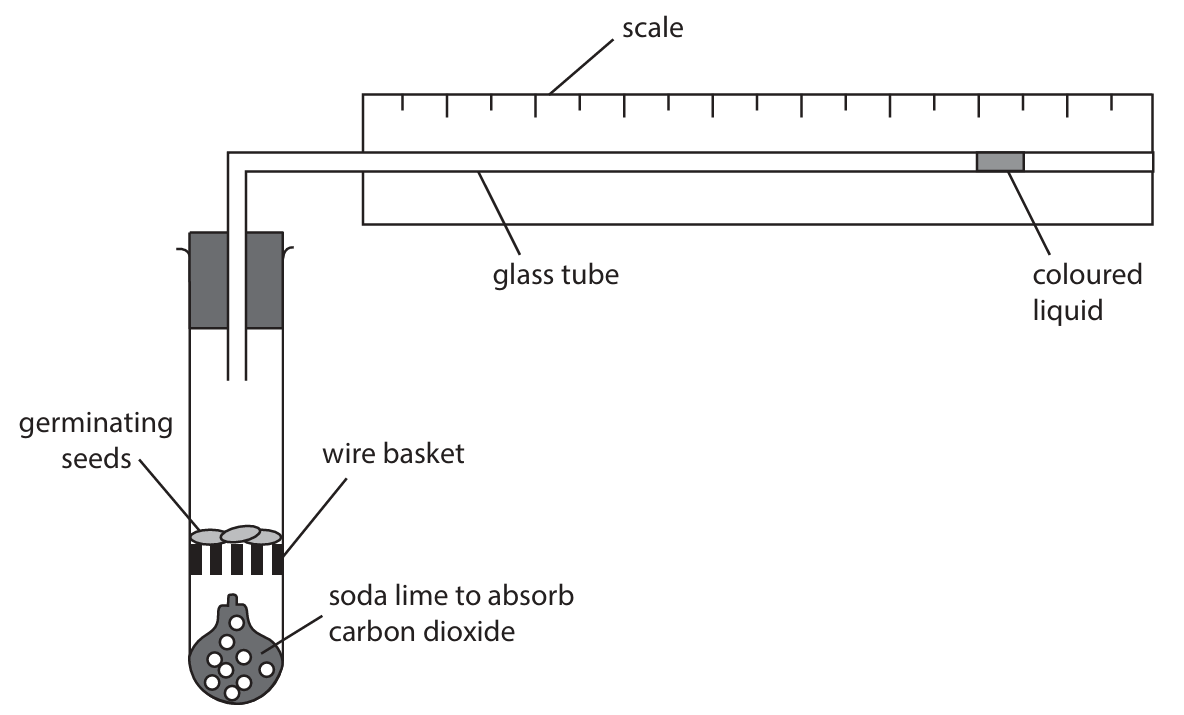
(b)(i) To stop oxygen getting in / to prevent aerobic respiration.
Explanation: The layer of paraffin oil acts as a barrier, sealing the yeast and glucose mixture from the air. This prevents oxygen from dissolving into the solution, ensuring that the yeast is forced to respire anaerobically (ferment) rather than aerobically, which would produce different products and potentially a different rate of gas production.
(b)(ii) Use a water bath. Monitor the temperature with a thermometer.
Explanation: To maintain a constant temperature, the test tube containing the yeast mixture should be placed in a water bath set to the desired temperature (e.g., 25°C or 37°C). The large volume of water helps to buffer against rapid temperature changes. The student should then use a thermometer to regularly check the temperature of the water bath (or the mixture itself) and make minor adjustments if necessary to keep it constant throughout the experiment.
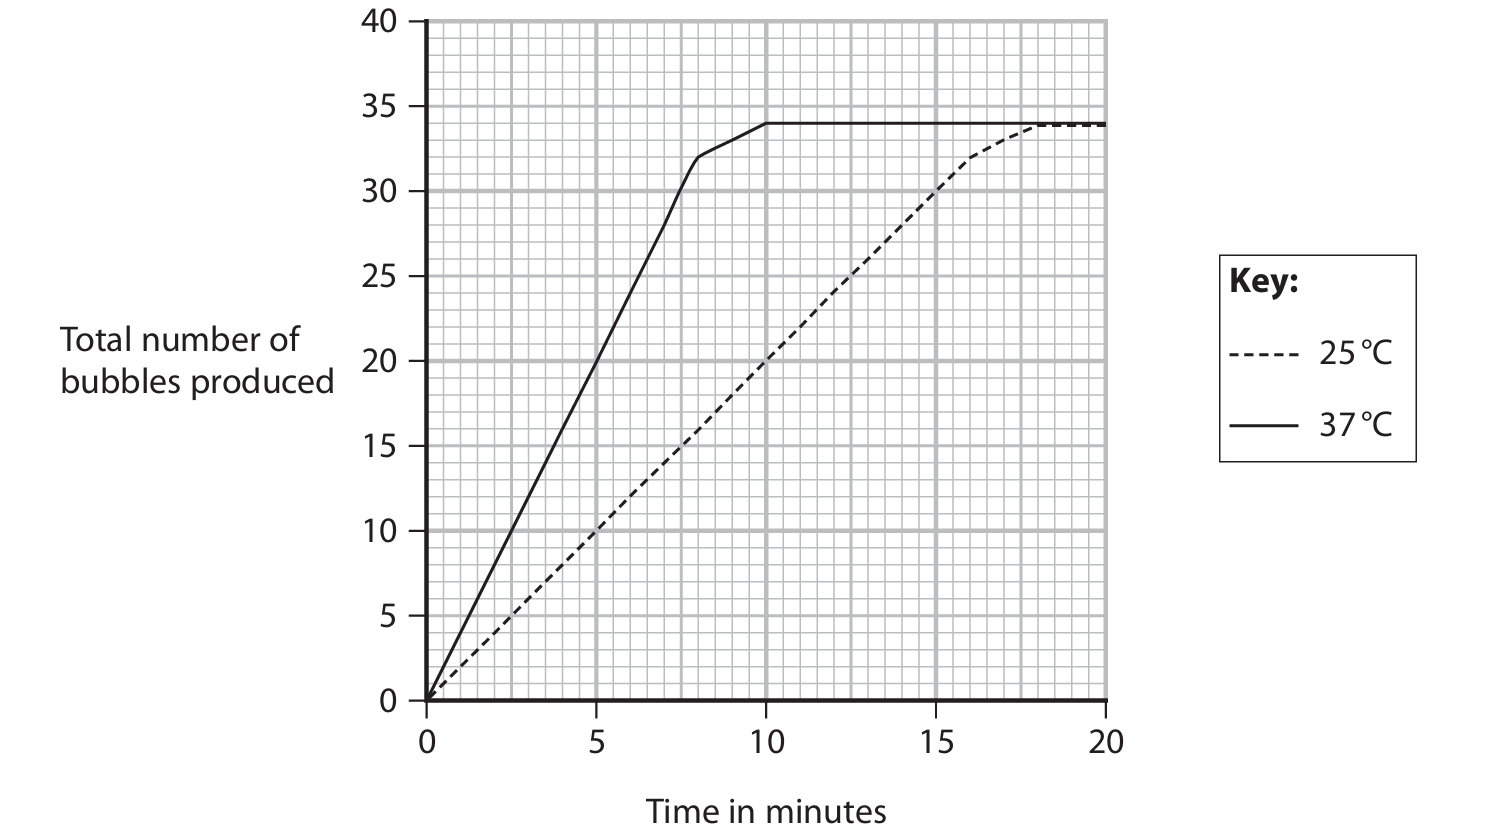
(b)(iii) 4 bubbles per minute
Explanation: The calculation for rate is: Rate = Total number of bubbles / Time. According to the graph, at 37°C, the total number of bubbles produced by 8 minutes is 32. Therefore, the rate is 32 bubbles / 8 minutes = 4 bubbles per minute.
(b)(iv) The total number increases up to around 16–18 minutes and then levels off. This is because initially glucose is not limiting, but later it runs out or the yeast is poisoned by ethanol.
Explanation: The graph line for 25°C shows a steady increase in the cumulative number of bubbles up to a certain point (around 16–18 minutes), after which the line becomes horizontal. The initial increase indicates that anaerobic respiration is occurring at a constant rate, as there is plenty of glucose substrate available. The leveling off occurs because the glucose supply eventually becomes depleted. Additionally, the ethanol produced as a waste product can reach a concentration that becomes toxic to the yeast cells, inhibiting further respiration and stopping bubble production.
(b)(v) The rate is faster at 37°C. This is because 37°C is closer to the optimum temperature for enzymes involved in respiration.
Explanation: The graph shows a steeper gradient (more bubbles produced in the same time) for the 37°C line compared to the 25°C line between 0 and 10 minutes. Enzyme‑controlled reactions, like those in respiration, have an optimum temperature. 37°C is closer to this optimum than 25°C. The increased thermal energy at 37°C causes enzymes and substrate molecules to move faster and collide more frequently and with more energy. This increases the rate of successful collisions and the formation of enzyme‑substrate complexes, thus speeding up the reaction. The faster rate also means the glucose substrate is used up more quickly at 37°C, which is why the curve begins to level off earlier.
(b)(vi) Collect and measure the volume of gas produced instead of counting bubbles. Use a gas syringe or a measuring cylinder in a water trough.
Explanation: Counting bubbles is an inaccurate method because bubbles can vary significantly in size. A small bubble and a large bubble would each count as one, giving a misleading measure of the actual quantity of gas produced. A more accurate method would be to replace the delivery tube in the diagram with one that leads into an inverted measuring cylinder (or burette) filled with water, or to use a gas syringe. This apparatus would collect the gas and allow the student to measure its volume directly, which is a more reliable and quantitative measure of the rate of respiration.

▶️ Answer/Explanation
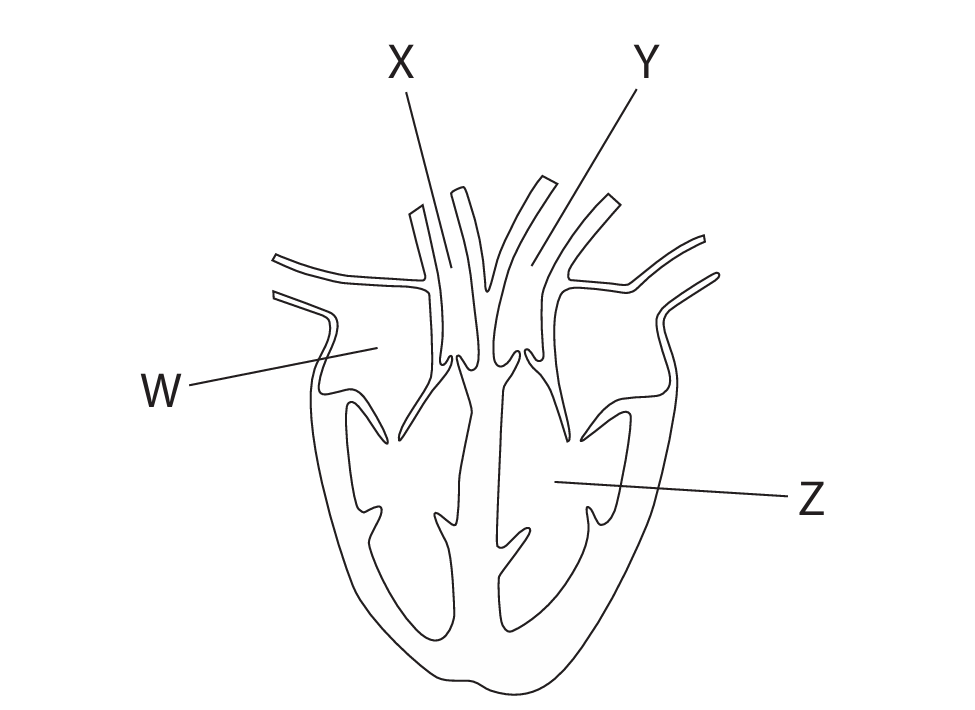
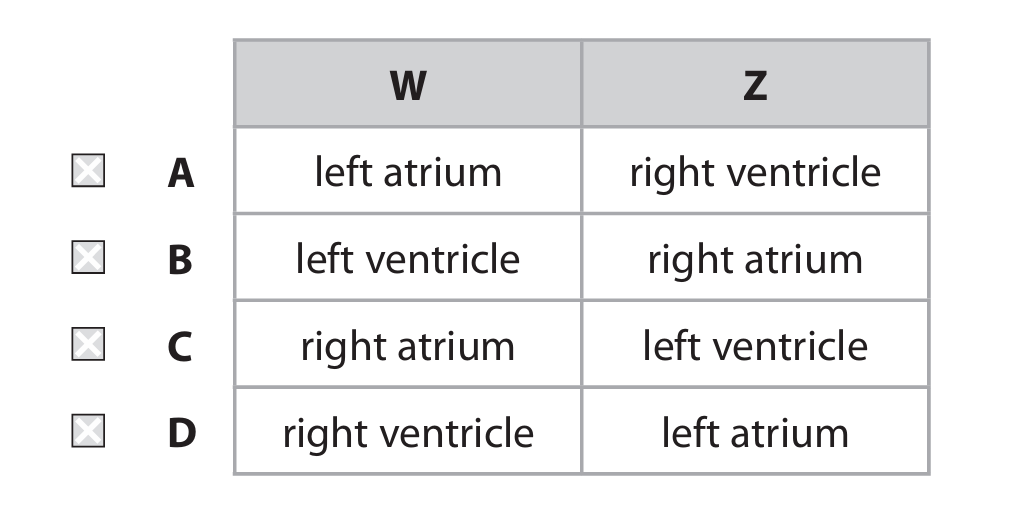
(a)(i) C
Explanation: Chamber W is the right atrium (receives deoxygenated blood from the body via the vena cava) and chamber Z is the left ventricle (pumps oxygenated blood to the body via the aorta). Option A is incorrect because W is not the left atrium. Option B is incorrect because W is not a ventricle. Option D is incorrect because W is not a ventricle.
(a)(ii)
Explanation: Two differences between the blood in vessel X (pulmonary artery) and vessel Y (aorta) are:
- The blood in X (pulmonary artery) is deoxygenated / has a lower oxygen concentration, whereas the blood in Y (aorta) is oxygenated / has a higher oxygen concentration.
- The blood in X (pulmonary artery) has a higher carbon dioxide concentration, whereas the blood in Y (aorta) has a lower carbon dioxide concentration.
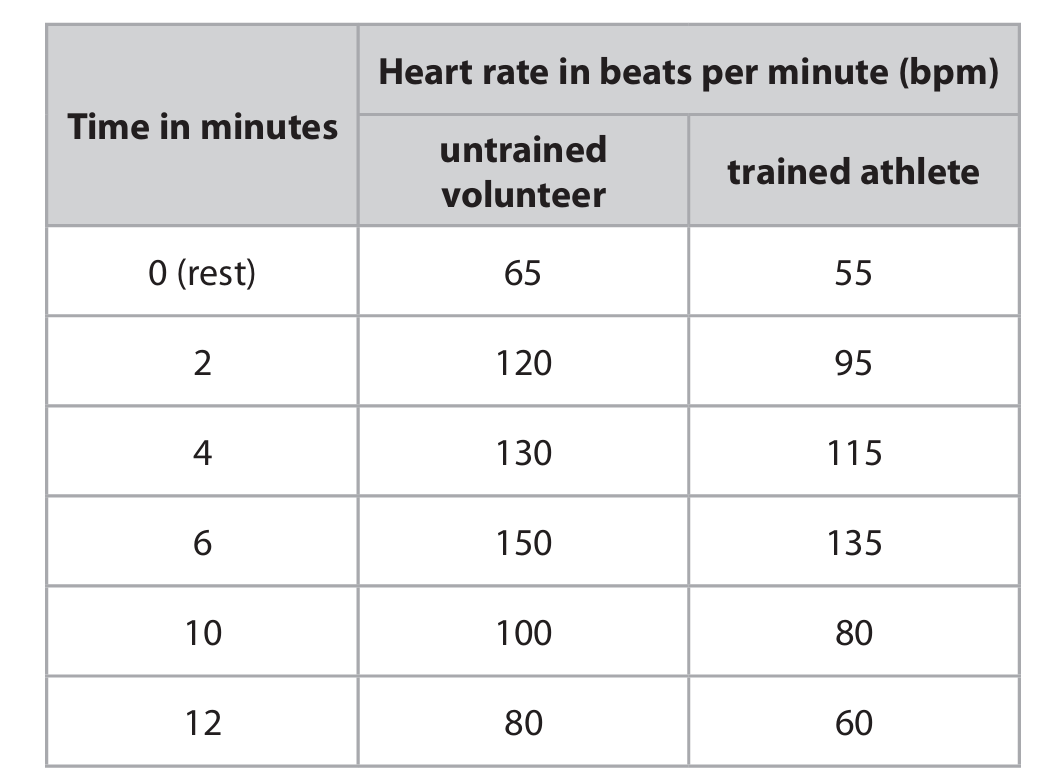
(b)(i) 89 cm³ (to 2 significant figures)
Explanation: The formula given is cardiac output = stroke volume × heart rate. We need to find the stroke volume for the trained athlete at rest. From the table, the trained athlete’s heart rate at rest (0 minutes) is 55 bpm. The cardiac output is given as 4900 cm³ per minute.
Rearranging the formula: stroke volume = cardiac output ÷ heart rate.
So, stroke volume = 4900 cm³/min ÷ 55 beats/min ≈ 89.0909 cm³/beat.
Rounded to two significant figures, the stroke volume is 89 cm³.
(b)(ii)
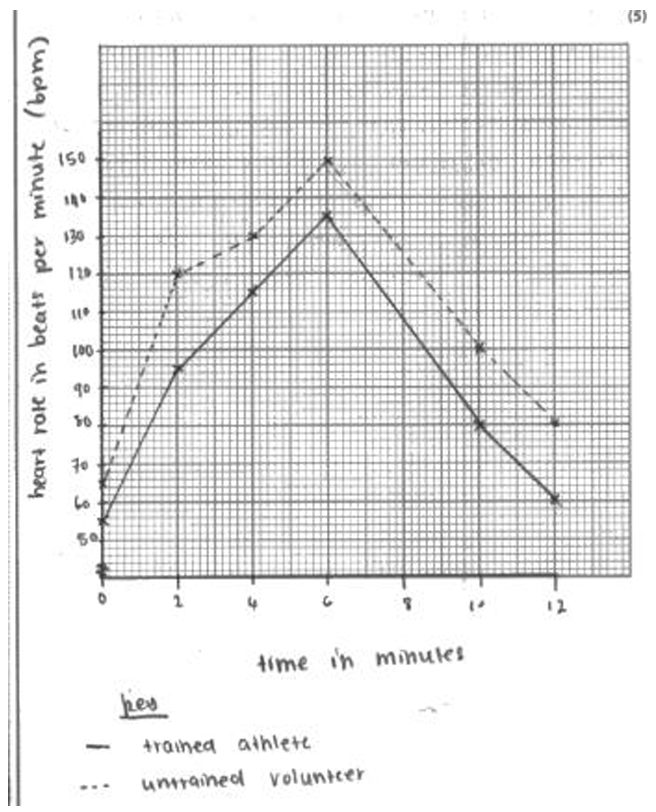
Explanation: A line graph should be drawn with Time (minutes) on the x-axis and Heart Rate (bpm) on the y-axis. Two lines should be plotted: one for the untrained volunteer and one for the trained athlete, using the data points from the table. The points should be joined with straight lines using a ruler. A key must be included to distinguish between the two lines. The scales should be linear and use at least half the grid. Both axes should be fully labelled (“Time (minutes)” and “Heart rate (bpm)”).
(b)(iii)
Explanation: The trained athlete can run faster due to several physiological advantages evident from the data:
1. Lower Resting and Recovery Heart Rate: The athlete has a lower heart rate at rest (55 bpm vs 65 bpm) and after exercise (e.g., 60 bpm at 12 mins vs 80 bpm). This indicates a larger and stronger heart muscle (hypertrophy) which results in a greater stroke volume (as calculated in part (i)). A larger stroke volume means more blood (and therefore more oxygen and glucose) is pumped to the muscles with each beat.
2. Efficient Oxygen Delivery: During exercise, the athlete’s heart rate increases less dramatically (peaks at 135 bpm vs 150 bpm) to achieve the same cardiac output. This efficient system allows for faster and more sustained delivery of oxygen and nutrients to respiring muscles, facilitating more aerobic respiration and ATP production.
3. Reduced Oxygen Debt and Lactic Acid Build-up: The quicker return to resting heart rate after exercise suggests the athlete incurs less oxygen debt and produces less lactic acid through anaerobic respiration. This reduces fatigue and allows for faster, longer-lasting muscle contractions.
In summary, the athlete’s cardiovascular system is more efficient at delivering oxygen and removing waste products, allowing for greater energy production and faster running speeds.

▶️ Answer/Explanation
(a)
1 Plasma
2 Platelets
Explanation: Blood is composed of several components. Red and white blood cells are the cellular components. The other two major components are plasma, which is the liquid matrix that carries the cells, nutrients, hormones, and waste products, and platelets, which are cell fragments crucial for blood clotting.
(b)
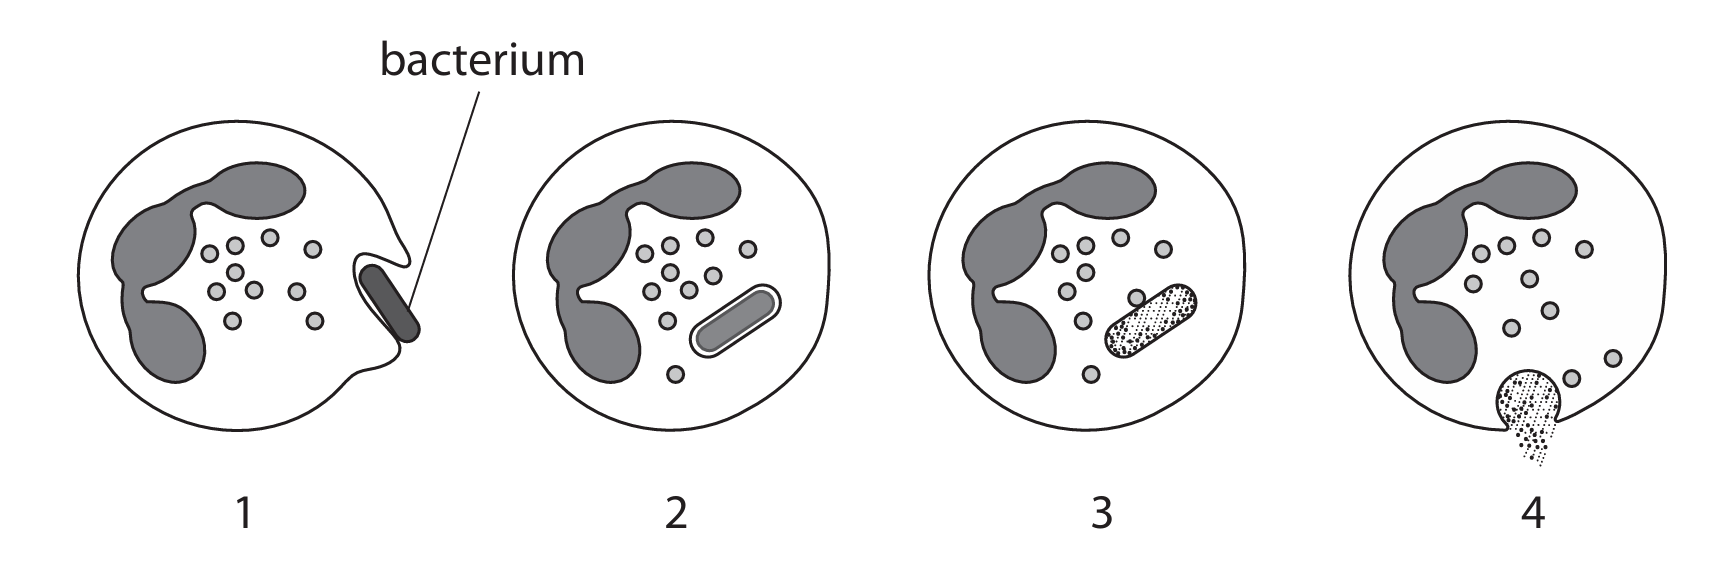
Stage 1: The white blood cell (a phagocyte) identifies the bacterium as a foreign pathogen and begins to move towards it.
Stage 2: The white blood cell engulfs the bacterium by extending its cell membrane around it, a process called phagocytosis. The bacterium becomes enclosed within a vesicle inside the cell called a phagosome.
Stage 3: A lysosome, containing digestive enzymes, fuses with the phagosome. The enzymes break down and digest the bacterium.
Stage 4: The waste products from the digested bacterium are expelled from the white blood cell through a process of exocytosis.
Explanation: This describes the process of phagocytosis, which is a key defense mechanism of the innate immune system. Specific types of white blood cells, like neutrophils and macrophages, use this method to ingest and destroy harmful microorganisms.
(c)(i)
magnification = 7000 (Accept answers in the range 6800–7300)
Explanation: To calculate magnification, you use the formula:
Magnification = Image Size / Actual Size
First, measure the diameter of the red blood cell in the picture. Let’s assume it measures approximately 5.7 cm (57 mm). Convert this to micrometres (μm) to match the units of the actual size: 57 mm × 1000 = 57,000 μm.
The actual size is given as 8.1 μm.
Therefore, Magnification = 57,000 μm / 8.1 μm ≈ 7037. This can be rounded to 7000 when considering significant figures and acceptable range.
(c)(ii)
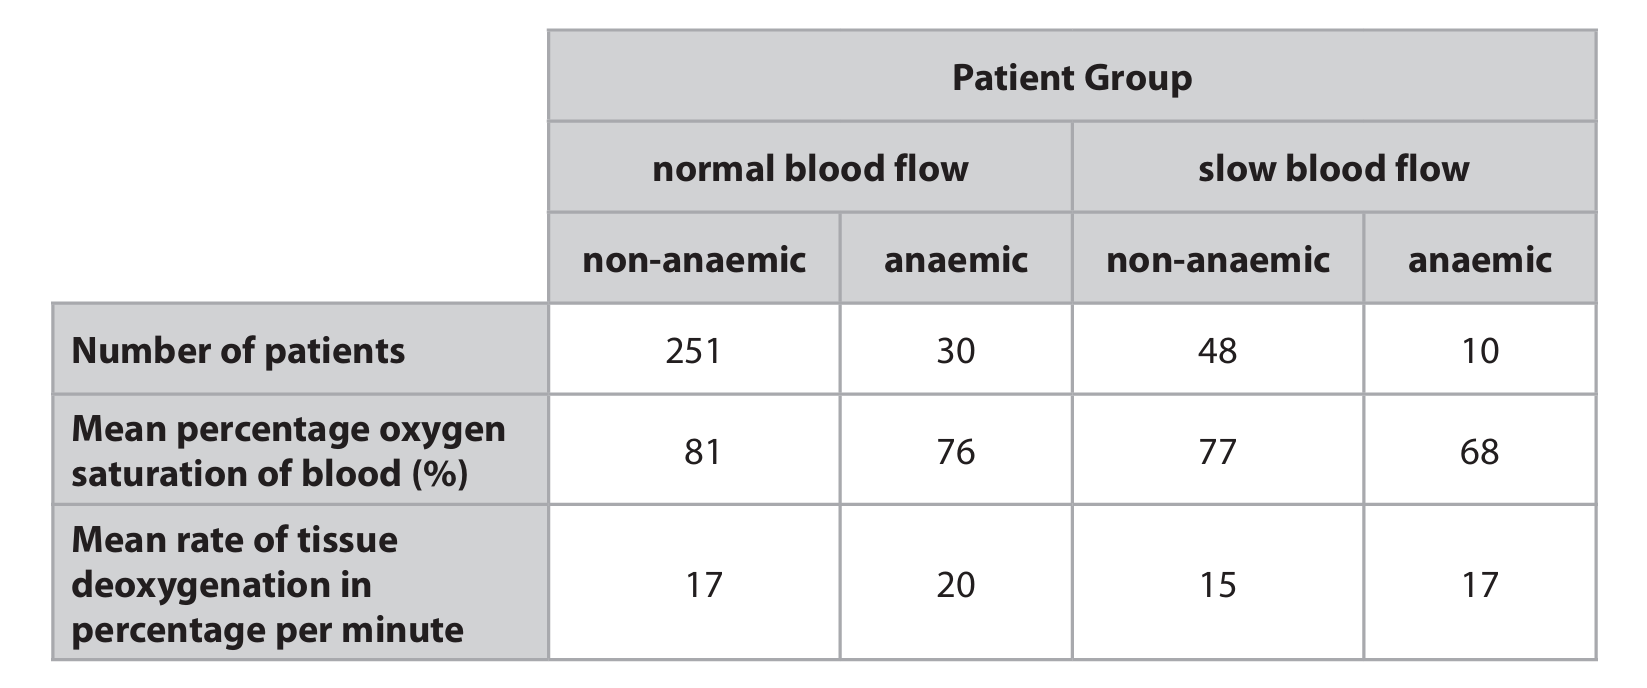
Discussion:
- Anaemia and Oxygen Saturation: For both blood flow groups, the mean percentage oxygen saturation is lower in anaemic patients (76% vs. 81% for normal flow; 68% vs. 77% for slow flow). This is because anaemia means fewer red blood cells and less haemoglobin, reducing the blood’s overall capacity to carry oxygen.
- Blood Flow and Oxygen Saturation: For both patient types (anaemic and non-anaemic), oxygen saturation is lower in the slow blood flow groups. Slower flow may allow more time for oxygen to be unloaded to tissues, leaving less oxygen bound in the blood vessels being measured.
- Rate of Tissue Deoxygenation: Under normal blood flow, the rate of deoxygenation is higher in anaemic patients (20%/min vs. 17%/min). This suggests that tissues are extracting oxygen from the blood more rapidly, possibly to compensate for the lower oxygen-carrying capacity. The difference is less pronounced in the slow blood flow group (17%/min vs. 15%/min), likely because the slower flow already allows for more complete oxygen extraction regardless of red blood cell count.
- Combined Effect: The lowest oxygen saturation (68%) is seen in anaemic patients with slow blood flow, showing these factors have a combined negative effect. Interestingly, their deoxygenation rate (17%/min) is the same as non-anaemic patients with normal flow, suggesting a complex compensatory relationship.
- Data Reliability: It’s important to note the much smaller sample sizes for the anaemic groups, especially the anaemic slow flow group (n=10), which might make these results less reliable than those from the larger non-anaemic normal flow group (n=251). Other factors like patient diet, activity levels, or overall health could also influence these results.

▶️ Answer/Explanation
(a) To keep the temperature constant / maintain a constant temperature / control the temperature.
Explanation: The water bath is used to ensure the yeast suspension remains at a stable, optimal temperature for the duration of the experiment. This is crucial because the rate of enzyme-controlled reactions, like those in anaerobic respiration, is highly sensitive to temperature changes. A constant temperature ensures that any changes in the rate of gas production are due to the changing glucose concentration and not fluctuating temperature.
(b) Lime water OR Hydrogen carbonate indicator.
Explanation with Lime water: Lime water (a solution of calcium hydroxide) can be used. The gas produced by yeast during anaerobic respiration is carbon dioxide (CO₂). When carbon dioxide is bubbled through lime water, it reacts to form insoluble calcium carbonate, which turns the clear lime water cloudy or milky. This visible change confirms the presence of CO₂.
Explanation with Hydrogen carbonate indicator: Hydrogen carbonate indicator (a pH indicator) can also be used. Carbon dioxide dissolves in water to form carbonic acid, which lowers the pH. The hydrogen carbonate indicator solution changes colour based on pH: it is red at neutral pH, yellow/orange in acidic conditions (high CO₂), and purple in alkaline conditions (low CO₂). The production of CO₂ would therefore cause the indicator to turn from red to yellow/orange.
(c) A stopwatch / stopclock / timer OR A syringe / measuring cylinder / burette.
Explanation: To accurately measure the rate of respiration, one needs to measure the time taken to produce a certain volume of gas or the volume of gas produced in a certain time. A stopwatch is needed to measure the time accurately. Alternatively, if the apparatus is modified to collect the gas (e.g., in an inverted measuring cylinder or syringe), that measuring apparatus (syringe, measuring cylinder, burette) would be needed to measure the volume of gas produced.
(d)(i) An explanation including four named conditions and how they are controlled is required. For example:
- Temperature: Temperature is controlled using a water jacket surrounding the fermenter. Cold water is circulated through the jacket to remove excess heat generated by the respiring microorganisms and maintain the optimum temperature for their growth and penicillin production.
- pH: pH is monitored using pH probes and maintained at the optimum level by the automatic addition of acids or alkalis through inlet pipes to ensure enzyme activity is not inhibited.
- Oxygen (aeration): Oxygen concentration is controlled for aerobic respiration using an aerator or sparger, which pumps sterile air into the fermenter. This provides the oxygen needed for the microorganisms to respire and grow efficiently.
- Nutrients: Nutrients are provided in a nutrient medium and are often added continuously or in batches (fed-batch culture) to ensure microorganisms never run out of food for growth and product synthesis.
- Agitation (Mixing): The contents are mixed using motor-driven impellers (paddles/stirrers). This ensures even distribution of nutrients, oxygen, and heat throughout the vessel, preventing the formation of gradients and ensuring all microorganisms have equal access to resources.
- Aseptic Conditions (Preventing Contamination): Conditions are kept sterile to prevent competition from unwanted microbes. Air entering the fermenter is filtered to remove contaminants, and the vessel is sterilized with steam before use.
(Any four valid points, each consisting of a named condition and its control method, would score the marks.)
(d)(ii) Bacteria have evolved resistance to antibiotics through natural selection.
- Within a bacterial population, there is genetic variation due to random mutations.
- Some of these mutations may happen to confer resistance to a particular antibiotic. For example, a mutation might change the shape of the protein that the antibiotic usually targets, so the antibiotic can no longer bind effectively.
- When the antibiotic is used, it acts as an environmental selection pressure. Non-resistant bacteria are killed by the antibiotic.
- The resistant bacteria survive because the antibiotic is ineffective against them.
- These surviving resistant bacteria then reproduce (multiply by binary fission).
- They pass the allele(s) for resistance on to their offspring.
- Over time and with repeated use of the antibiotic, the proportion of resistant bacteria in the population increases, making the antibiotic less effective at controlling infections caused by that bacterial species.
This process is a classic example of natural selection and is a major challenge in modern medicine.

▶️ Answer/Explanation
(a)(i) B (bronchiole)
(a)(ii) A (diaphragm contracts and moves downwards)
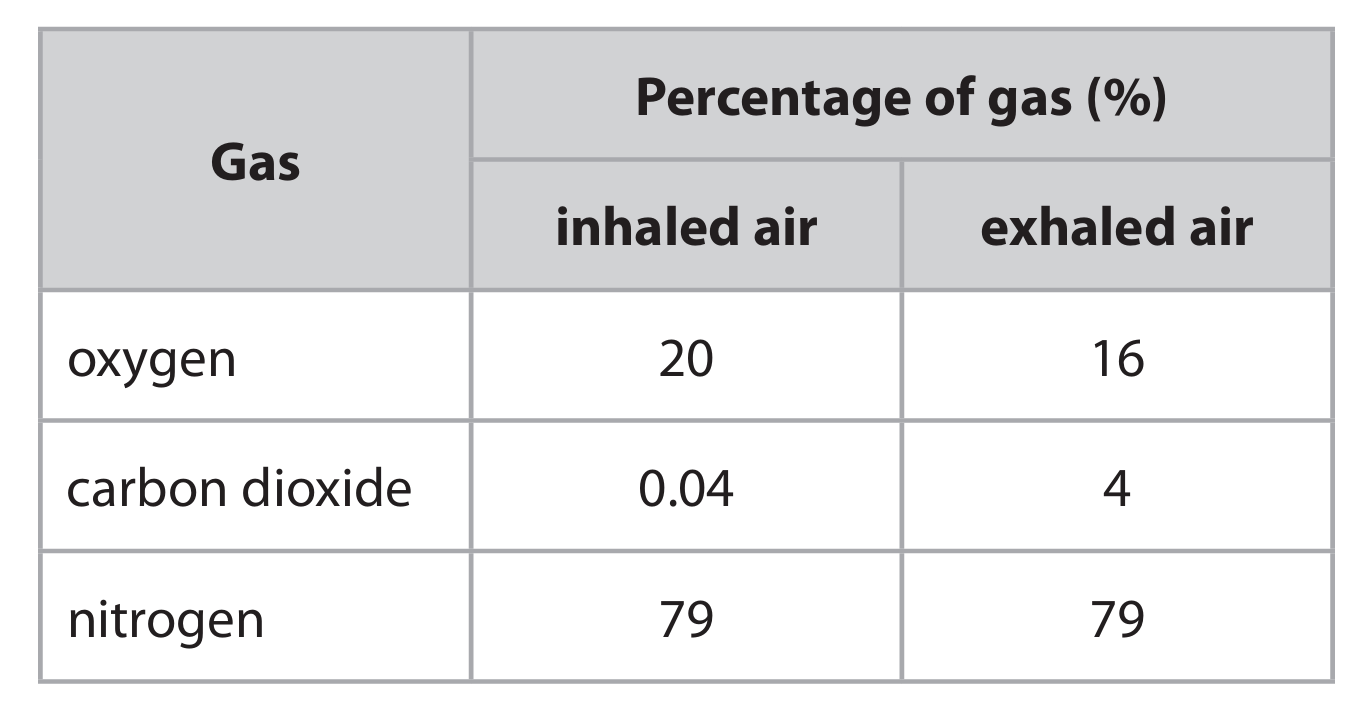
(b)(i) Explanation that includes:
• Oxygen decreases from 20% to 16% because it is used in respiration / diffuses into blood
• Carbon dioxide increases from 0.04% to 4% because it is produced in respiration / diffuses out of blood
• Nitrogen remains unchanged at 79% because it is not used in respiration
(b)(ii) Suggestion that includes:
• Exhaled air is a mixture of alveolar air and air from the dead space (trachea, bronchi, bronchioles)
• Dead space air has not undergone gas exchange and dilutes the alveolar air during exhalation
• Therefore exhaled air has higher oxygen and lower carbon dioxide than pure alveolar air

▶️ Answer/Explanation
(a)(i) B (fungi)
Explanation: Yeast is a single-celled organism that belongs to the kingdom Fungi. Unlike bacteria (prokaryotes), yeast are eukaryotic cells. They are not plants as they do not perform photosynthesis and lack chloroplasts, and they are not protoctists, which is a kingdom typically containing diverse, often unicellular, eukaryotes that don’t fit into the other kingdoms.
(a)(ii) B (chitin)
Explanation: The cell wall of a yeast cell is primarily made of a complex carbohydrate called chitin, which is also found in the exoskeletons of insects and the cell walls of other fungi. This is different from plant cell walls, which are made of cellulose (A). Sucrose (C) is a sugar and starch (D) is a storage polysaccharide; neither are structural components of cell walls.
(b)(i) The teacher would need additional apparatus to control and measure temperature. This includes a water bath (or a beaker of water heated by a Bunsen burner) to contain the test tube and allow for precise temperature variation. A thermometer is essential to accurately measure the temperature of the yeast and glucose solution. A stopwatch or timer is also needed to measure the rate of the reaction, for example, by timing how long it takes for a colour change to occur or measuring the rate of gas production if that was being monitored.
(b)(ii) The layer of liquid paraffin acts as a seal on the surface of the glucose solution. Its purpose is to prevent oxygen from the air dissolving into the solution. This creates anaerobic conditions, ensuring that any respiration detected is anaerobic respiration (fermentation) rather than aerobic respiration. This is crucial for investigating this specific type of respiratory pathway.
(b)(iii) A suitable chemical indicator would be limewater (calcium hydroxide solution). Alternatively, hydrogencarbonate indicator could be used.
Explanation: Limewater is used to test for the product carbon dioxide (CO₂) of respiration. CO₂ turns limewater cloudy. Hydrogencarbonate indicator changes colour (from red to yellow) in the presence of increased carbon dioxide levels.
(b)(iv) Diazine green is an indicator that is blue when oxygen is present and pink when it is absent (reduced). The initial blue colour indicates there is oxygen dissolved in the solution, and the yeast is likely respiring aerobically. As the yeast cells respire, they use up the oxygen in the solution for aerobic respiration. The change in colour from blue to pink indicates that the oxygen concentration is decreasing. Once the oxygen is depleted and the solution turns pink, it shows that the yeast has switched to anaerobic respiration (fermentation) to continue producing energy.
(c) The rate of respiration in yeast changes with temperature due to the effect on enzymes, which control the metabolic reactions of respiration.
As temperature increases from a low value, the kinetic energy of the enzyme and substrate molecules increases. This causes them to move faster and collide more frequently. More collisions lead to the formation of more enzyme-substrate complexes, which increases the rate of respiration.
This increase continues up to an optimum temperature, where the respiration rate is at its maximum because enzymes are working most efficiently.
Beyond this optimum temperature, the high energy causes the hydrogen and ionic bonds that hold the enzyme’s shape to break. This alters the specific 3D shape of the enzyme’s active site. The substrate can no longer fit into the denatured active site, meaning fewer enzyme-substrate complexes can form. This causes the rate of respiration to decrease rapidly and eventually stop.

▶️ Answer/Explanation
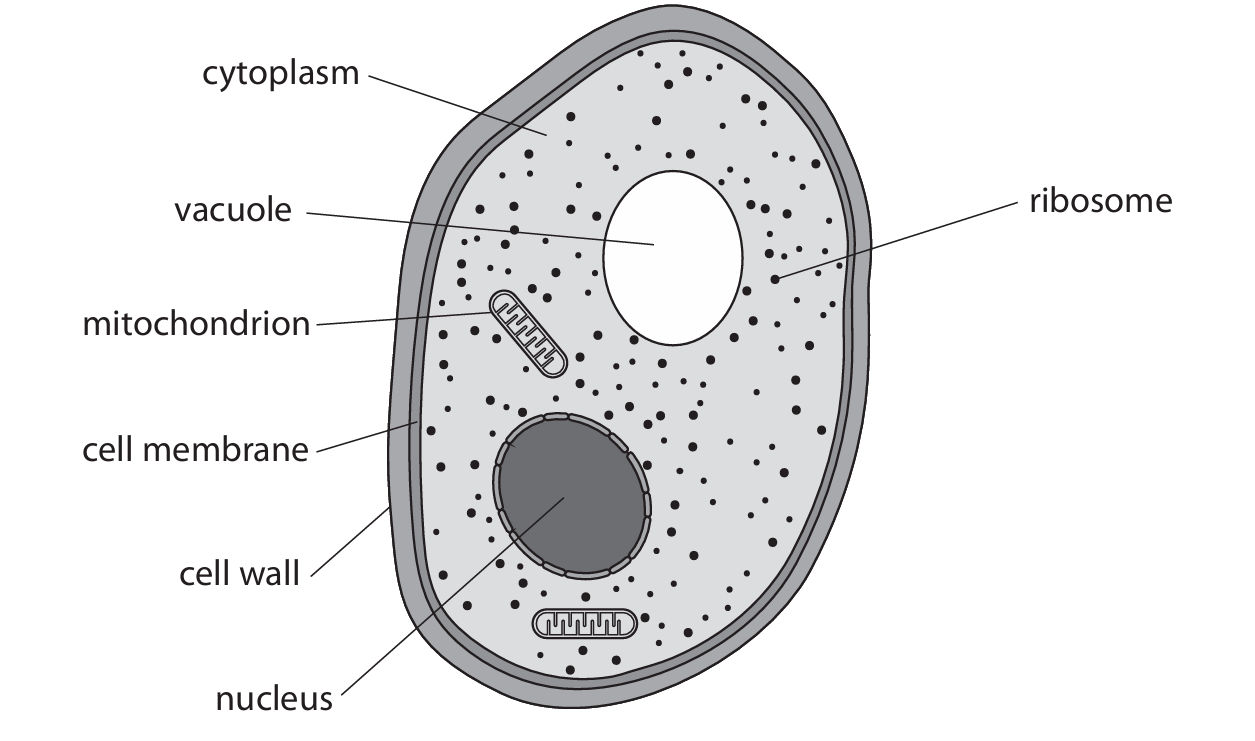
(a)(i) A mitochondrion
Explanation: Aerobic respiration is the process that releases energy from glucose in the presence of oxygen. In eukaryotic cells, like yeast cells, this process occurs specifically in the mitochondria. The mitochondria are often called the “powerhouses” of the cell because they generate most of the cell’s supply of ATP, the energy currency. The nucleus (B) contains genetic material, the ribosome (C) is the site of protein synthesis, and the vacuole (D) is used for storage; none of these are the primary site for aerobic respiration.
(a)(ii) B chitin
Explanation: The cell wall of fungi, which includes yeast, is primarily made of a complex carbohydrate called chitin. Chitin is a strong and flexible polysaccharide that also forms the exoskeletons of insects. Cellulose (A) is the material that makes up plant cell walls. Glycogen (C) is a polysaccharide used for energy storage in animals and fungi, and starch (D) is used for energy storage in plants.
(a)(iii) A cell membrane
Explanation: Prokaryotic cells, such as bacteria, lack membrane-bound organelles. Therefore, they do not have a true nucleus (C), mitochondria (B), or vacuoles (D) like eukaryotic cells do. However, all cells, both prokaryotic and eukaryotic, are surrounded by a cell membrane (also called the plasma membrane). This phospholipid bilayer controls the movement of substances in and out of the cell and is a fundamental structure for life.
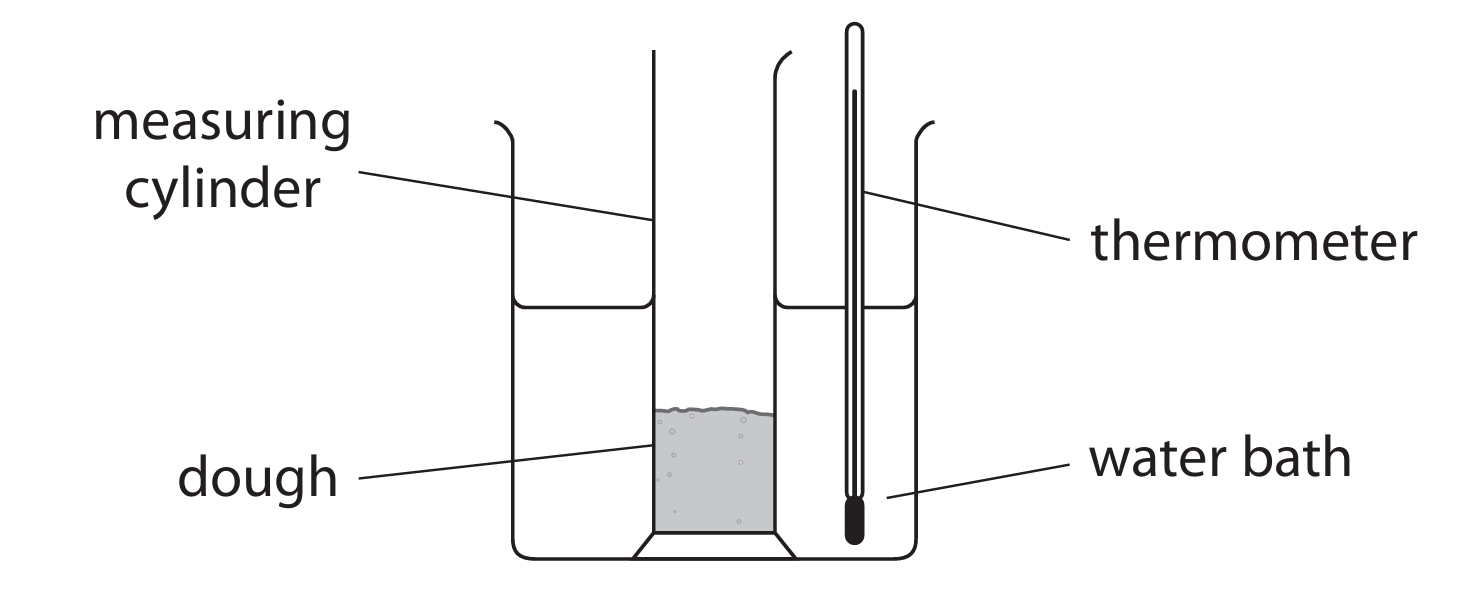
(b)(i) 80%
Explanation: The percentage increase is calculated using the formula:
\[ \text{Percentage Increase} = \left( \frac{\text{Final Value} – \text{Initial Value}}{\text{Initial Value}} \right) \times 100\]
Plugging in the values from the experiment at 35°C:
\[ \left( \frac{45 – 25}{25} \right) \times 100 = \left( \frac{20}{25} \right) \times 100 = 0.8 \times 100 = 80\%\]
So, the dough increased in height by 80% after two hours at 35°C.
(b)(ii) Yeast respires anaerobically (a process called fermentation) using the sugar in the dough as a substrate. This respiration produces carbon dioxide (\(CO_2\)) gas. The gas bubbles become trapped within the stretchy, elastic network of gluten proteins in the dough. As more and more gas is produced, these bubbles expand, causing the entire dough mixture to inflate and rise in height.
(b)(iii) Temperature affects the rate of enzyme-controlled reactions, such as respiration in yeast. At 25°C, the temperature is further from the optimum temperature for the yeast’s enzymes. The yeast cells and their enzymes have less kinetic energy, leading to fewer successful collisions between enzymes and substrates. This results in a slower rate of respiration, less carbon dioxide gas being produced, and consequently, a smaller rise in the dough (40% increase) compared to the rise at 35°C (80% increase).
(b)(iv) At 65°C, the temperature is likely too high and has denatured the enzymes in the yeast. Denaturation is a process where the enzyme’s active site changes shape permanently, and it can no longer bind to its substrate. With the enzymes denatured, respiration stops entirely or occurs at a very minimal rate. Very little carbon dioxide is produced, so the dough rises very little (only 8%). In contrast, at 35°C, the temperature is likely close to the optimum for the yeast’s enzymes, allowing for a high rate of respiration and gas production, leading to the greatest rise.
▶️ Answer/Explanation
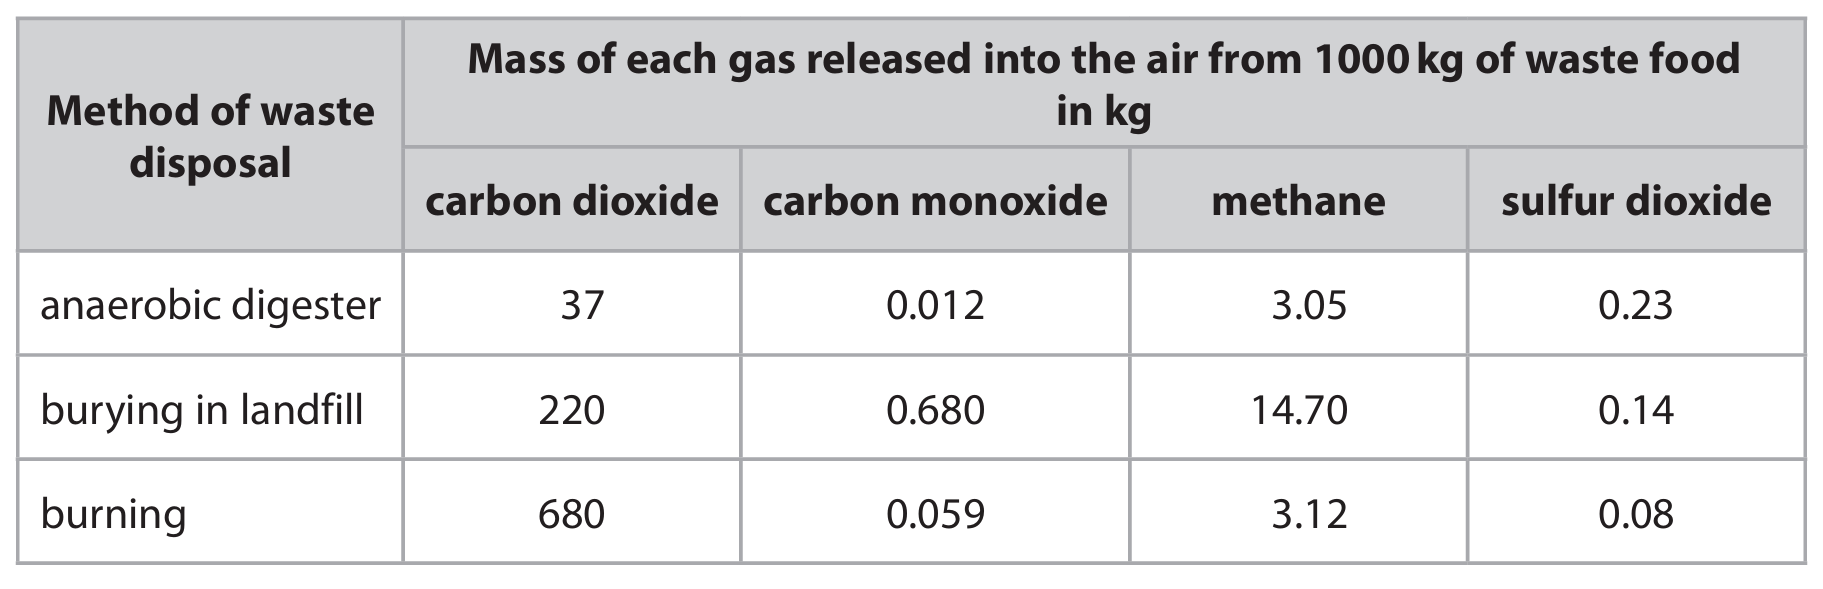
(a) 4.6 kg
Explanation:
The table shows that 37 kg of carbon dioxide is released from 1000 kg of waste food using an anaerobic digester. We need to find out how much is released from 125 kg.
First, find the amount of CO₂ released per kg of waste:
\[ \frac{37\, \text{kg}}{1000\, \text{kg}} = 0.037\, \text{kg of CO}_2 \text{ per kg of waste} \]
Now, multiply this by the mass of waste we are interested in (125 kg):
\[ 0.037\, \text{kg/kg} \times 125\, \text{kg} = 4.625\, \text{kg} \]
Finally, round this answer to two significant figures:
\[ 4.625\, \text{kg} \approx 4.6\, \text{kg} \]
So, the mass of carbon dioxide released is 4.6 kg.
(b)
Evaluation:
Arguments in favor (Agreement):
- The data shows that anaerobic digesters release significantly less carbon dioxide (37 kg) per 1000 kg of waste compared to burning (680 kg) and burying in landfill (220 kg). Carbon dioxide is a major greenhouse gas contributing to global warming.
- Anaerobic digesters also release less methane (3.05 kg) than landfills (14.70 kg). Methane is a much more potent greenhouse gas than CO₂ in the short term, so reducing its release is crucial for mitigating climate change.
- The amount of carbon monoxide (0.012 kg) released by digesters is much lower than from landfills (0.680 kg) and slightly lower than from burning (0.059 kg). Carbon monoxide is a toxic gas that can bind to haemoglobin in blood, reducing oxygen transport.
- By producing less of these gases, anaerobic digesters contribute less to the greenhouse effect, global warming, and associated problems like ice cap melting, habitat loss, extreme weather, and flooding.
- Furthermore, the process of anaerobic digestion produces biogas (a mixture of methane and carbon dioxide), which can be captured and used as a renewable energy source, adding to its environmental benefits.
Arguments against (Disagreement/Limitations):
- However, the table shows that anaerobic digesters release more sulfur dioxide (0.23 kg) than the other two methods (Landfill: 0.14 kg, Burning: 0.08 kg).
- Sulfur dioxide is a primary cause of acid rain. Acid rain can lead to deforestation, acidification of lakes and rivers (killing fish and other aquatic life), and damage to buildings and statues.
- Therefore, while anaerobic digesters are better in terms of greenhouse gas emissions, their higher sulfur dioxide output is a significant environmental drawback that must be considered and potentially mitigated.
Conclusion:
Based on the data provided, anaerobic digesters appear to be the most environmentally friendly method specifically regarding greenhouse gas emissions (CO₂, CH₄, CO), which are a major global concern. The claim is strongly supported by this data. However, the higher release of sulfur dioxide, which causes regional environmental problems like acid rain, means they are not unequivocally the best in every aspect. A full evaluation would require weighing the global impact of climate change against the more localized impact of acid rain. Technologies to capture or reduce sulfur dioxide emissions from digesters could make them even more environmentally friendly.


▶️ Answer/Explanation
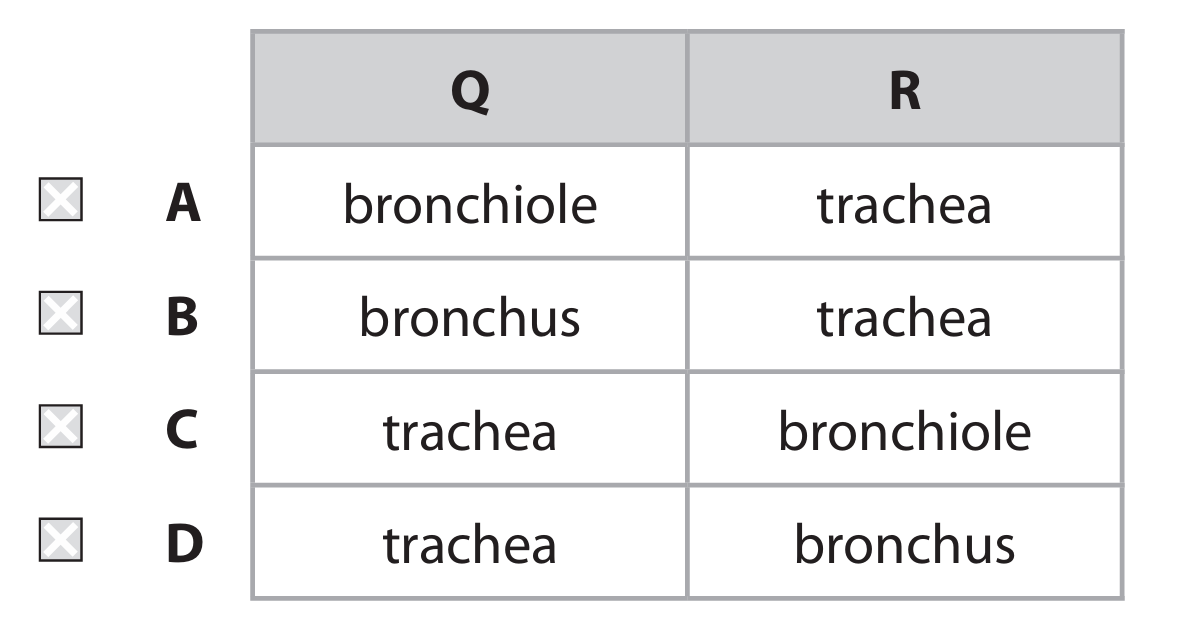
(a) (i) D
Explanation: Structure Q is the trachea (windpipe), which is the main airway leading from the larynx to the bronchi. Structure R is a bronchus (plural: bronchi). The trachea splits into two main bronchi, one leading to each lung. Option A is incorrect because Q is not a bronchiole (which are smaller branches) and R is not the trachea. Option B is incorrect because while R is the trachea, Q is a bronchus, not a bronchiole. Option C is incorrect because while Q is the trachea, R is a bronchus, not a bronchiole.
(a) (ii)
Explanation: Structure S is the diaphragm. During exhalation, the diaphragm relaxes. As it relaxes, it moves upwards, returning to its domed shape. This upward movement decreases the volume of the thoracic cavity (the chest). According to the principles of gas pressure, when the volume of a container decreases, the pressure inside it increases. This increased pressure in the lungs forces air out down the pressure gradient, from the high pressure in the lungs to the lower pressure of the outside atmosphere.
(b)
Explanation: The graph shows that a person with lung disease has a significantly lower vital capacity (the maximum volume of air they can exhale) and a slower rate of exhalation compared to a healthy person. This is often due to conditions like asthma or COPD which cause the airways to become narrowed or obstructed. The narrowed airways make it physically harder to move air out of the lungs quickly and completely. This means that during exercise, the person cannot expel carbon dioxide or take in fresh oxygen efficiently. The build-up of CO₂ and lack of O₂ leads to a low oxygen level in the blood (hypoxia) and a high carbon dioxide level. The body perceives this distress, triggering feelings of breathlessness (dyspnea) to make the person slow down and breathe more. Because their respiratory system cannot meet the increased oxygen demand of their muscles during exercise, they become fatigued very quickly and are unable to sustain physical activity.


▶️ Answer/Explanation
(a) Increasing acidity can be used as a measure of yoghurt production because yoghurt is produced through the process of anaerobic respiration by bacteria (such as Lactobacillus). During this process, the bacteria ferment lactose (milk sugar) and produce lactic acid as a waste product. The more lactic acid produced, the more acidic the mixture becomes, indicating greater yoghurt production.
(b) One abiotic variable that the scientists should control is temperature. Maintaining a constant temperature ensures that any differences in acidity between the two cultures are due to the oxygen levels being tested rather than temperature fluctuations that could affect bacterial activity.
(c) (i) The line graph should show:
- Time (minutes) on the x-axis with a linear scale from 0 to 210
- Acidity (%) on the y-axis with a linear scale from 0.20 to at least 0.70
- Two clearly labeled lines: one for reduced oxygen level and one for normal oxygen level
- All data points correctly plotted
- Straight lines connecting the points

(c) (ii) The changes in percentage acidity are different because the reduced oxygen environment promotes more anaerobic respiration by the bacteria. In the reduced oxygen culture, bacteria primarily perform anaerobic respiration, which produces lactic acid more efficiently and rapidly. In the normal oxygen culture, bacteria may perform more aerobic respiration, which produces less lactic acid and results in a slower increase in acidity. This explains why the reduced oxygen culture shows a faster increase in acidity throughout most of the experiment, though both cultures eventually reach the same maximum acidity at 210 minutes.

▶️ Answer/Explanation
(a)(i) B (bronchus)
Explanation: Structure R is identified as the bronchus. The bronchi are the main passageways into the lungs, branching off from the trachea. Bronchioles (option A) are smaller branches further down the respiratory tree and lack cartilage, while the oesophagus (option C) is part of the digestive system leading to the stomach, and the trachea (option D) is the single windpipe before it splits into the bronchi.
(a)(ii)
Explanation: Structure S is the diaphragm. When a person breathes in (inspiration), the diaphragm contracts and flattens, moving downwards. This action increases the volume of the thoracic cavity. According to Boyle’s law, an increase in volume leads to a decrease in pressure inside the lungs compared to the atmospheric pressure outside. This creates a pressure gradient, causing air to flow from the high-pressure area (outside) to the low-pressure area (inside the lungs), enabling inhalation.
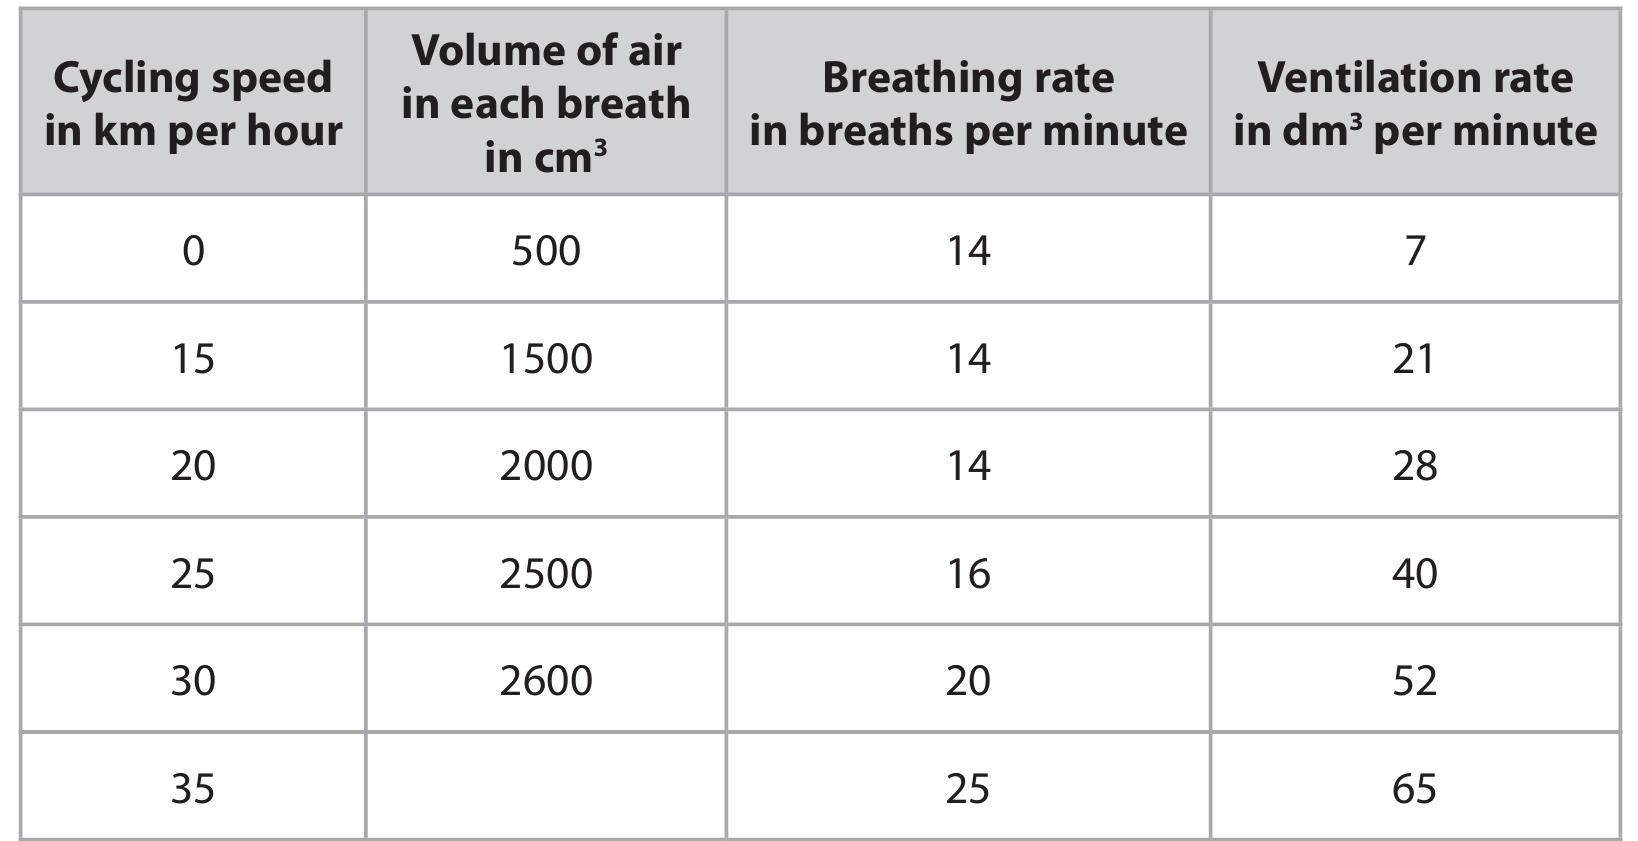
(b)(i) (Cycling) speed
Explanation: The independent variable is the factor that the scientist deliberately changes or manipulates during the investigation. In this experiment, the scientist systematically increases the cycling speed (from 0 km/h to 35 km/h) to observe its effect on the ventilation rate. Therefore, the cycling speed is the independent variable.
(b)(ii) 2600 cm3
Explanation: The ventilation rate is the total volume of air breathed out per minute. It is calculated by multiplying the volume of air per breath (tidal volume) by the breathing rate. The formula is: Ventilation rate = Tidal volume × Breathing rate.
We are given:
- Ventilation rate = 65 dm3/min
- Breathing rate = 25 breaths/min
- 1 dm3 = 1000 cm3
First, convert the ventilation rate to cm3/min: 65 dm3/min × 1000 = 65,000 cm3/min.
Then, rearrange the formula to find the tidal volume: Tidal volume = Ventilation rate ÷ Breathing rate.
So, Tidal volume = 65,000 cm3/min ÷ 25 breaths/min = 2,600 cm3.
Therefore, the volume of air in each breath at 35 km/h is 2600 cm3.
(b)(iii)
Explanation: The data shows a clear trend: as the cycling speed increases, the ventilation rate also increases. For example, at rest (0 km/h), the ventilation rate is 7 dm3/min, and it rises steadily to 65 dm3/min at 35 km/h. This happens because the muscles need more oxygen and must remove more carbon dioxide during increased exercise. Initially (from 0 to 20 km/h), the increase in ventilation rate is achieved mainly by increasing the volume of air in each breath (tidal volume), as the breathing rate remains constant at 14 breaths/min. At higher speeds (from 25 km/h onwards), both the tidal volume and the breathing rate increase to meet the heightened oxygen demand and energy production required for more intense muscle activity.
(b)(iv) Repeat the investigation and calculate a mean (average) / Use more people (cyclists).
Explanation: To improve reliability, the scientist should repeat the entire investigation several times with the same person or, even better, use a larger group of people with similar characteristics (e.g., age, fitness level). By collecting multiple sets of data and calculating the mean (average) ventilation rate at each cycling speed, the scientist can reduce the effect of random errors and anomalies, making the results more consistent and dependable.
▶️ Answer/Explanation
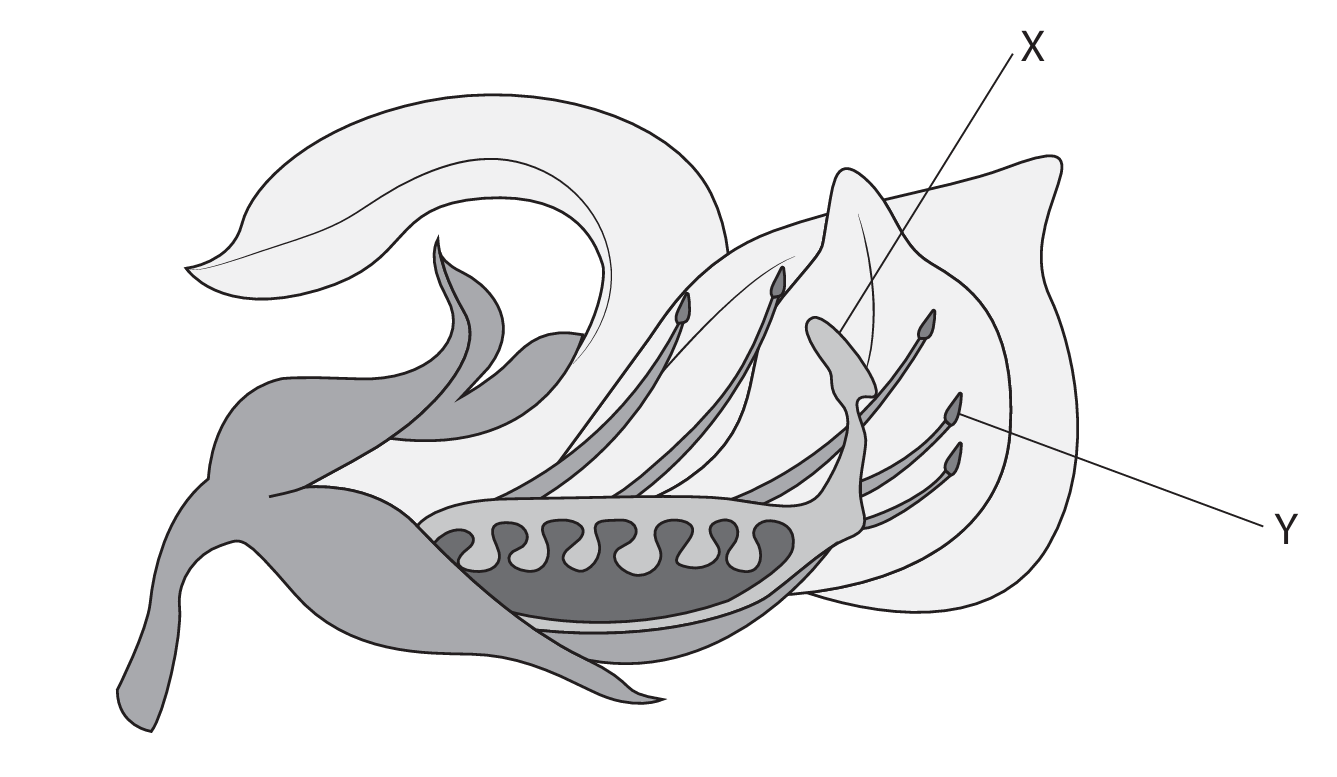
(a)(i)
X: stigma
Y: anther
Explanation: In a typical pea flower, structure X is the stigma, which is the receptive tip of the carpel (female part) where pollen lands during pollination. Structure Y is the anther, which is the part of the stamen (male part) that produces and releases pollen grains.
(a)(ii)
Explanation: The flower is adapted for insect pollination. Two structures that indicate this are the large, brightly coloured petals and the positioning of the anthers and stigma within the flower. The large petals serve to attract insect pollinators like bees by being visually conspicuous. The anthers (structure Y) are positioned inside the flower, and the stigma (structure X) is also located within the flower and is not feathery. This internal positioning means that when an insect enters the flower to reach nectar, it will brush against both the anthers, picking up pollen, and the stigma, depositing pollen from previous flowers, thereby facilitating cross-pollination.
(b)(i)
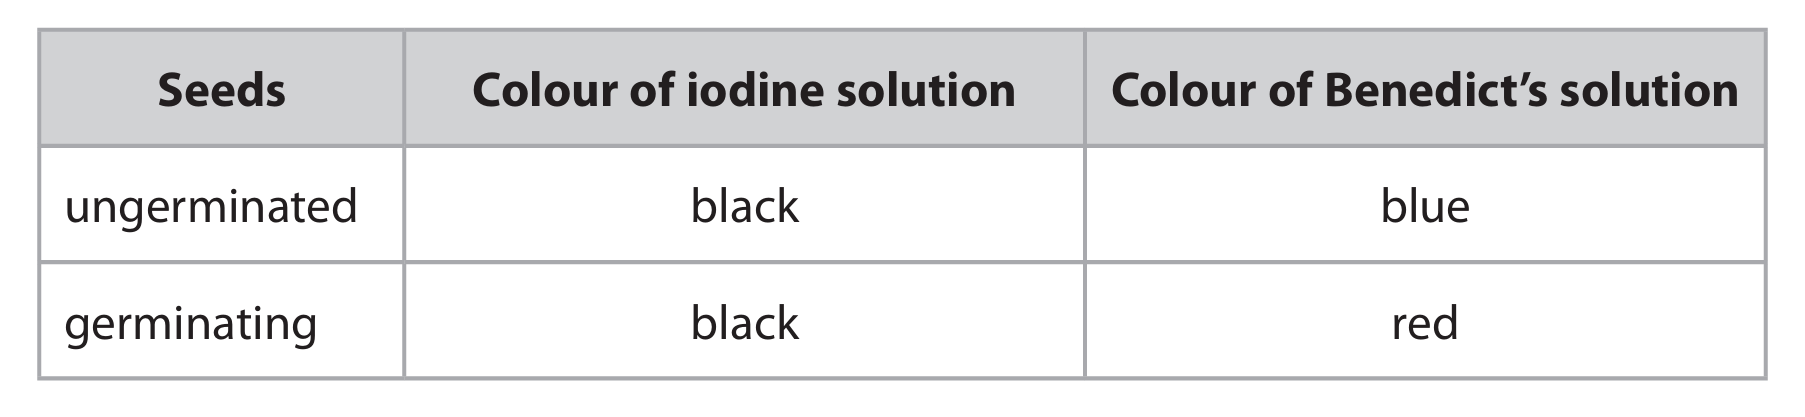
Ungerminated seeds: starch
Germinating seeds: starch and glucose/sugar/maltose
Explanation: The scientist identified starch in both seed types because the iodine test turned black, which is a positive result for starch. In the ungerminated seeds, Benedict’s test remained blue, indicating no reducing sugars were present. However, in the germinating seeds, Benedict’s test turned red, which is a positive result for reducing sugars like glucose, maltose, or other simple sugars.
(b)(ii)
Explanation: The difference arises because germination triggers metabolic activity. In ungerminated seeds, starch is the main storage carbohydrate; it’s insoluble and doesn’t affect the seed’s water potential, making it ideal for long-term storage. During germination, the seed takes up water, activating enzymes like amylase. These enzymes catalyze the breakdown (hydrolysis) of starch into smaller, soluble molecules like maltose and glucose. These sugars are then used as a respiratory substrate to produce energy (ATP) required for the growth of the embryonic plant until it can photosynthesize. Therefore, germinating seeds contain both the remaining starch and the newly produced sugars.
(b)(iii)
Explanation: The jars are left unsealed to allow for gas exchange. Germination is an active metabolic process that requires aerobic respiration to release energy for growth. Aerobic respiration consumes oxygen and produces carbon dioxide. An unsealed jar allows oxygen from the atmosphere to diffuse into the jar, ensuring the seeds have a constant supply for respiration. Simultaneously, it allows the waste product, carbon dioxide, to diffuse out, preventing its buildup, which could potentially be harmful or alter the pH. Sealing the jars would create anaerobic conditions, likely halting germination or forcing the seeds into less efficient anaerobic respiration, which would invalidate the investigation into the normal carbohydrate changes during germination.
▶️ Answer/Explanation
(a) Fungi do not carry out photosynthesis. Their body is usually organised into a mycelium made from thread-like structures called hyphae.
Fungal cell walls are made of chitin.
Fungi feed by extracellular secretion of enzymes onto food material and absorption of the organic products. This is known as saprotrophic nutrition.
Explanation: Fungi are heterotrophic organisms that decompose organic matter. Their body structure consists of a network of hyphae that form a mycelium. The cell walls contain chitin, a strong polysaccharide also found in insect exoskeletons. Fungi digest food externally by secreting enzymes that break down complex molecules into simpler ones, which are then absorbed. This feeding method is called saprotrophic nutrition.
(b)(i) Carbon dioxide / CO2
Explanation: During anaerobic respiration (fermentation), yeast converts glucose into ethanol and carbon dioxide. The gas bubbles produced are CO2, which is what the student measures in this experiment.
(b)(ii) An explanation that makes reference to the following:
- Increasing (kinetic) energy / molecules move more
- More collisions / more enzyme-substrate complexes formed
- Above 37/40°C / optimum / eventually / at higher temperature enzyme denatures / change in active site / substrate and enzyme can no longer bind
Explanation: As temperature increases from low to moderate levels, the rate of gas production increases because the reactant molecules (enzymes and substrates) have more kinetic energy. This causes them to move faster and collide more frequently, leading to more enzyme-substrate complexes and a higher reaction rate. However, beyond the optimum temperature (around 37-40°C for many enzymes), the enzyme structure begins to denature. The hydrogen bonds holding the enzyme’s shape break, causing the active site to change shape. When this happens, substrates can no longer fit into the active site, and the reaction rate decreases dramatically.
(b)(iii) A description that makes reference to two of the following:
- Use (collect gas in) measuring cylinder / (gas) syringe
- Measure volume / cm3 in time / or time to produce volume
Explanation: To measure the rate of gas production, the student should collect the gas produced in a gas syringe or by displacing water in an inverted measuring cylinder. The volume of gas collected should be measured at regular time intervals (e.g., every minute). The rate can then be calculated as volume of gas produced per unit time (e.g., cm3/min). This method allows for quantitative measurement of the respiration rate at different temperatures.
▶️ Answer/Explanation
(a)(i) B
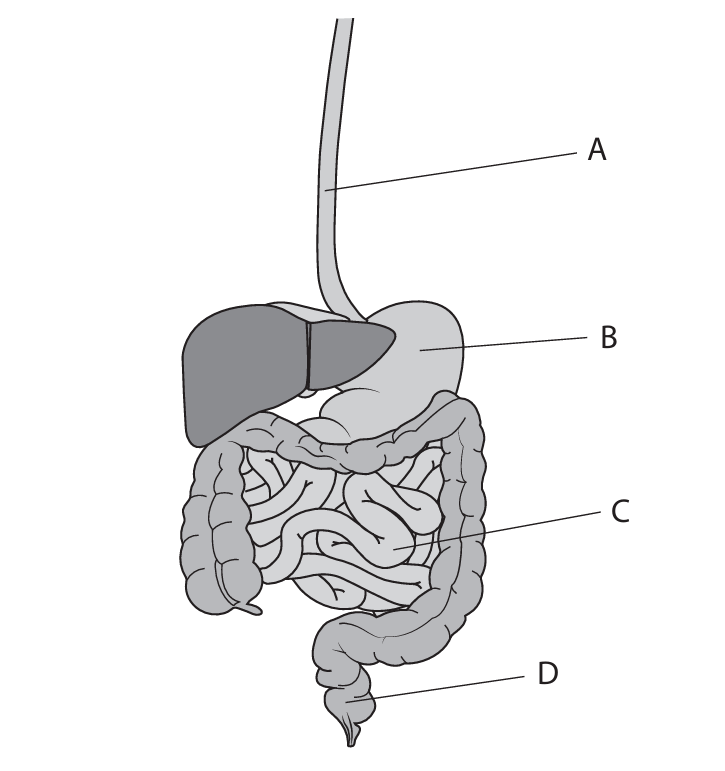
Explanation: Hydrochloric acid is produced in the stomach. In the diagram, part B represents the stomach, which contains gastric glands that secrete hydrochloric acid. This acid creates an acidic environment that helps to kill pathogens and provides the optimal pH for the enzyme pepsin to break down proteins.
(a)(ii) D
Explanation: Faeces are stored in the rectum before egestion. In the diagram, part D represents the rectum, which acts as a temporary storage site for undigested food material (faeces) until it is expelled from the body through the anus.
(b) Bile plays two crucial roles in digestion: emulsification of fats and neutralization of stomach acid.
Explanation: The liver produces bile, which is stored in the gallbladder and released into the small intestine. Bile contains bile salts that emulsify lipids, meaning they break large fat globules into smaller droplets. This dramatically increases the surface area of the fats, allowing the enzyme lipase to break them down more efficiently. Additionally, bile is alkaline, which helps to neutralize the hydrochloric acid from the stomach. This creates a more suitable pH environment for the pancreatic and intestinal enzymes (like lipase) to function effectively in the small intestine.
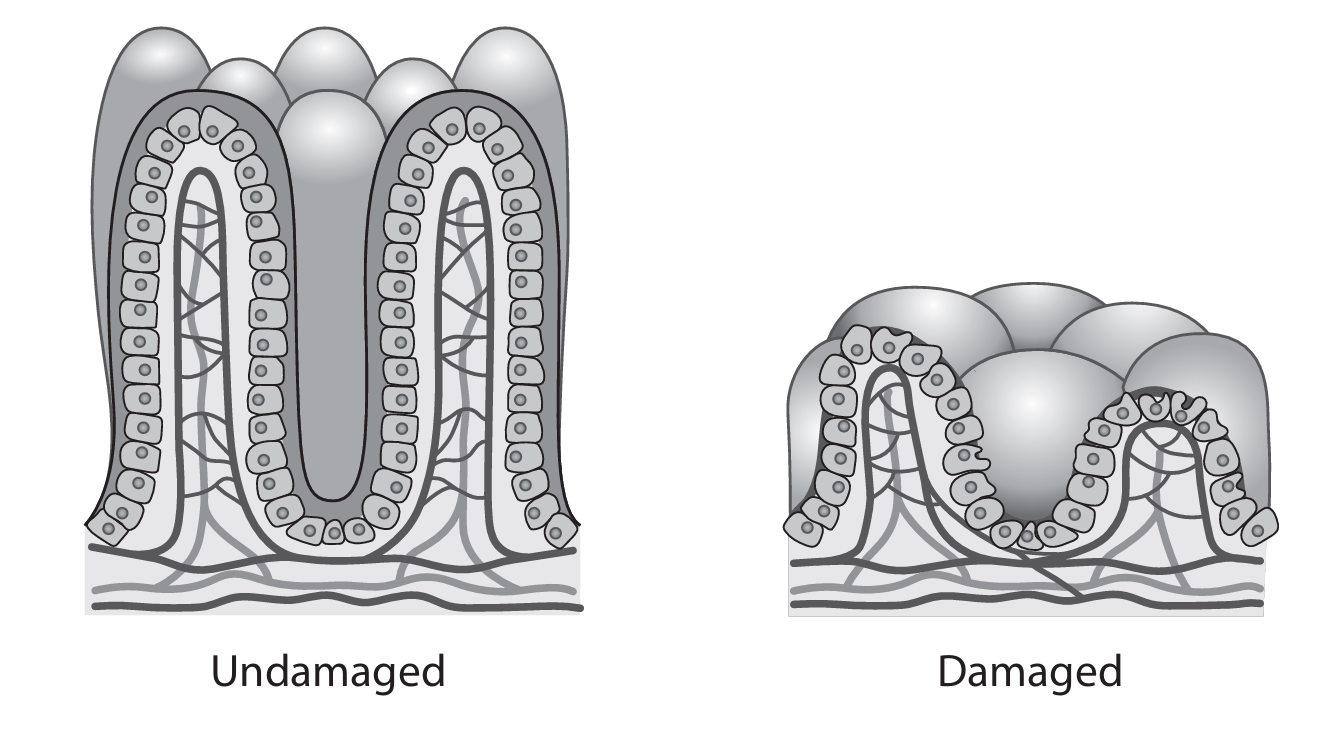
(c)(i) Undamaged villi are highly adapted for efficient absorption of digested food molecules.
Explanation: The adaptations of the villi include:
1. Large Surface Area: The villi are finger-like projections, and each villus is covered with even smaller projections called microvilli. This combined structure creates a massive surface area for absorption.
2. Thin Wall: The wall of each villus is only one cell thick. This creates a very short diffusion path, allowing for rapid absorption of nutrients into the bloodstream.
3. Rich Blood Supply: Each villus contains a dense network of capillaries. This maintains a steep concentration gradient for digested products like glucose and amino acids, facilitating their rapid absorption into the blood.
4. Lacteal: Each villus also contains a lacteal, which is a lymphatic vessel. The lacteal specifically absorbs fatty acids and glycerol, which are the products of fat digestion.
(c)(ii) Children with untreated coeliac disease experience impaired nutrient absorption due to villi damage, leading to stunted growth and fatigue.
Explanation: In coeliac disease, the immune reaction to gluten flattens and damages the villi. This damage has several consequences:
1. Reduced Surface Area: The damaged villi have a much smaller surface area compared to healthy, finger-like villi. This severely limits the area available for absorbing digested nutrients.
2. Slower Growth: With impaired absorption, the body receives fewer amino acids, which are the building blocks for proteins and new tissues. A deficiency in these essential molecules directly hinders growth and development in children.
3. Increased Fatigue: The damaged villi also absorb less glucose, which is the primary fuel for cellular respiration. With less glucose available, cells cannot produce sufficient ATP (energy). This leads to lower energy levels, making the child feel tired more easily. Additionally, reduced absorption of minerals like iron can lead to anemia, which further contributes to fatigue and weakness.


▶️ Answer/Explanation
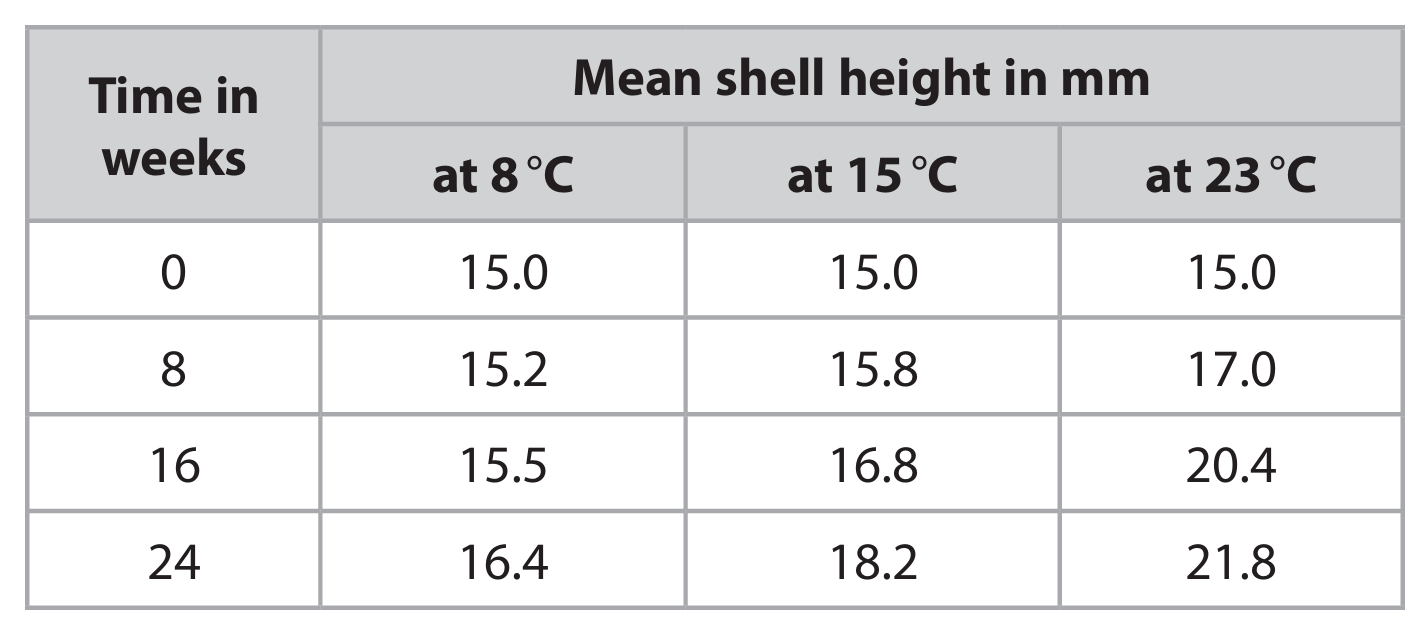
(a)(i)
Graph plotting: A line graph should be drawn with Time (weeks) on the x-axis and Mean shell height (mm) on the y-axis. Three separate lines should be plotted for the three temperatures (8°C, 15°C, 23°C) using the data from the table. The points should be joined with straight lines using a ruler.
Explanation: The graph would show that the line for 23°C is the steepest, indicating the fastest growth rate. The line for 15°C would be less steep, and the line for 8°C would be the least steep, showing the slowest growth. This visually demonstrates that higher temperatures lead to increased snail growth over the 24-week period.
(a)(ii)
Explanation: The investigation shows that higher temperatures result in greater snail growth. This is because temperature affects enzyme activity within the snails. Enzymes are biological catalysts that control metabolic processes like digestion and respiration, which provide energy and materials for growth. At higher temperatures, enzymes and substrate molecules have more kinetic energy, leading to more frequent and successful collisions. This increases the rate of enzyme-substrate complex formation and accelerates metabolic reactions. Consequently, processes like respiration occur faster, providing more ATP (energy) for growth activities, resulting in the observed increase in shell height at 23°C compared to lower temperatures.
(a)(iii)
Dependent variable: Mean shell height / growth of shell.
Explanation: The dependent variable is what is being measured in the experiment. In this case, the scientist is measuring how the shell height changes in response to different temperatures, so the mean shell height is the dependent variable.
(a)(iv)
Method for reliability: The scientist used groups of snails / used many snails / calculated the mean / repeated the measurements.
Explanation: To ensure reliability, the scientist didn’t just use one snail per temperature. By using groups of snails and calculating the average (mean) shell height for each group at each time interval, the scientist reduces the effect of individual variation among the snails. This makes the results more representative and reliable, as any anomalous measurements from individual snails are less likely to skew the overall data trend.
(b)(i)
Calculation:
Mass of food assimilated = Mass of food eaten – Mass of faeces egested = 1.2 g – 0.30 g = 0.9 g
Assimilation efficiency = \(\frac{0.9}{1.2} \times 100 = 75\%\)
Answer: 75%
Explanation: The calculation shows that 75% of the food eaten by the snail was actually absorbed and used by its body, while 25% was egested as waste (faeces).
(b)(ii)
Explanation: Primary consumers (herbivores) eat plant material, which often contains a high proportion of indigestible substances like cellulose. Cellulose is a tough carbohydrate that forms plant cell walls, and many animals lack the specific enzymes needed to break it down completely. Therefore, a significant portion of the plant material eaten by primary consumers passes through their digestive system undigested and is egested as faeces. In contrast, secondary consumers (carnivores) eat animal tissue, which is generally more easily and completely digested. Animal cells do not have rigid cell walls made of cellulose, and the proteins and lipids in animal tissue are more readily broken down by digestive enzymes. This results in less waste and a higher proportion of the consumed food being assimilated, leading to a greater assimilation efficiency in secondary consumers compared to primary consumers.
(c)
Explanation: Mammals are endotherms (warm-blooded), meaning they use a significant amount of the energy they assimilate from food to maintain a constant internal body temperature through metabolic processes. This requires a lot of energy, especially when the external environment is cold. A large portion of the assimilated energy is used for heat production rather than being converted into new body mass (growth). In contrast, snails are ectotherms (cold-blooded). They do not use metabolic energy to regulate their body temperature; their body temperature fluctuates with the environment. Therefore, a much larger proportion of the energy they assimilate can be directed towards growth and producing new biomass, resulting in a much higher production efficiency (35%) compared to the mammal (2%). Additionally, mammals are generally more active than snails, and this activity also consumes energy that could otherwise be used for growth.
▶️ Answer/Explanation
(a) oxygen + glucose → carbon dioxide + water + ATP
Explanation: The complete word equation for aerobic respiration is fundamental to understanding how cells produce energy. Glucose, derived from the food we eat, combines with oxygen we breathe in. Through a series of complex biochemical reactions in the mitochondria, these reactants are broken down to produce carbon dioxide (which we exhale), water, and ATP (adenosine triphosphate), which is the main energy currency used by cells for all their functions.
text
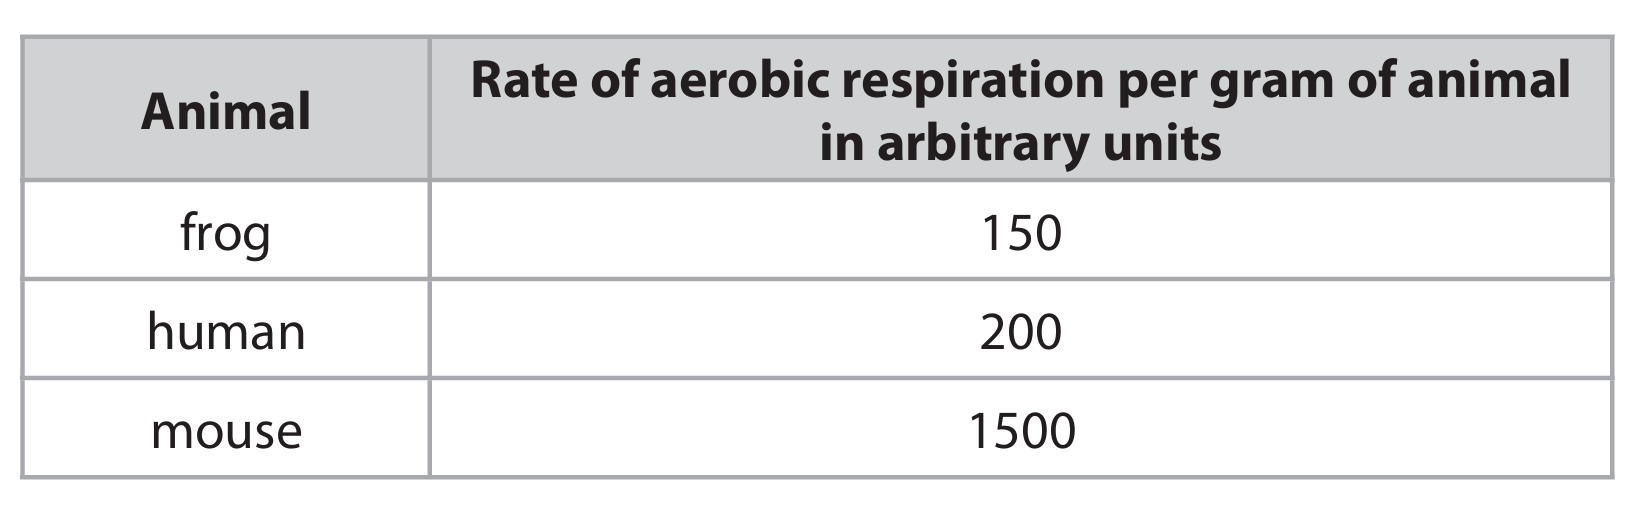
(b) A mouse has a higher metabolic rate and a larger surface area to volume ratio than a human, leading to greater heat loss that must be compensated for by increased respiration.
Explanation: When comparing animals of different sizes, the surface area to volume ratio plays a crucial role in physiological processes. A mouse, being much smaller than a human, has a relatively larger surface area through which it can lose heat to its environment. To maintain a constant body temperature (as both are mammals), the mouse must generate more heat internally. This requires a higher metabolic rate, meaning more cellular respiration occurs per gram of tissue. Since aerobic respiration consumes oxygen, the mouse consequently uses more oxygen per gram of body mass to fuel this increased metabolic activity and heat production.
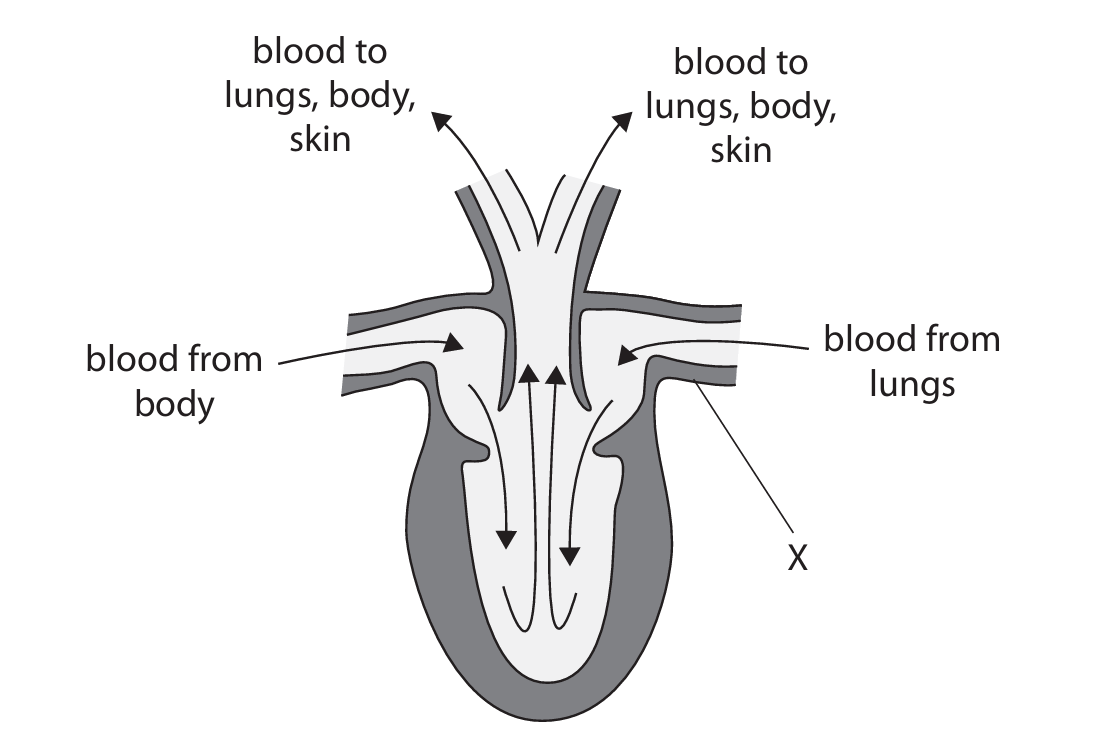
(c)(i) C pulmonary vein
Explanation: In both frog and human circulatory systems, the pulmonary vein is responsible for carrying oxygenated blood from the lungs back to the heart. Looking at the diagram and the direction of blood flow, vessel X is bringing blood from the lungs into the heart chamber, which matches the function of the pulmonary vein.
(c)(ii) A frog heart has three chambers (two atria and one ventricle) while a human heart has four chambers (two atria and two ventricles).
Explanation: This structural difference is significant. The frog’s heart has a single ventricle that receives blood from both atria, whereas the human heart has a complete separation between the right and left ventricles. This separation in humans prevents the mixing of oxygenated and deoxygenated blood, making the circulatory system more efficient.
(c)(iii) The three-chambered heart of a frog causes mixing of oxygenated and deoxygenated blood in the single ventricle, resulting in less efficient oxygen delivery to tissues and limited endurance for sustained activity.
Explanation: The frog’s three-chambered heart presents several limitations for sustained activity. Since there’s only one ventricle, oxygenated blood returning from the lungs and skin mixes with deoxygenated blood returning from the body. This mixture is then pumped out to both the lungs and the body simultaneously. The blood going to the body therefore has a lower oxygen content than what would be delivered by a fully separated four-chambered heart. During exercise, muscles require more oxygen for aerobic respiration to produce ATP. The frog’s circulatory system cannot meet this increased demand effectively. Consequently, frog muscles resort to anaerobic respiration more quickly, leading to lactic acid buildup and fatigue. This explains why frogs are adapted for short bursts of activity (like jumping to escape predators) rather than endurance activities like long-distance running that humans are capable of.
▶️ Answer/Explanation
(a) B 1
Explanation: Human sperm cells are gametes produced by meiosis. They contain half the number of chromosomes (23) compared to body cells. Sex chromosomes in sperm can be either X or Y. The maximum number of X chromosomes a sperm can carry is therefore 1. If a sperm carries an X chromosome, the resulting offspring will be female (XX); if it carries a Y chromosome, the offspring will be male (XY). A sperm cannot have 0, 2, or 23 X chromosomes.
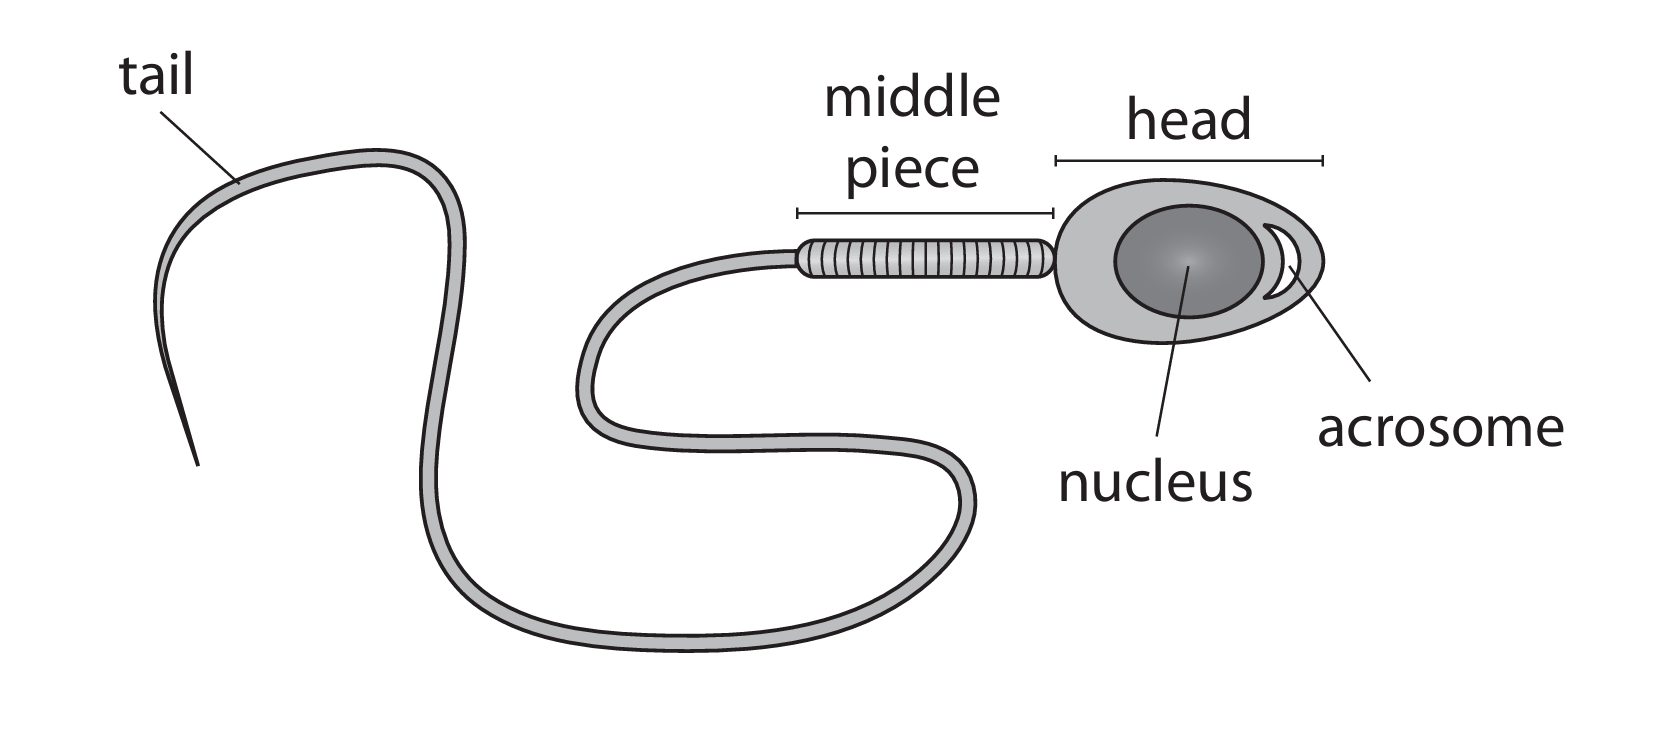
(b) The mitochondria in the middle piece provide the energy (in the form of ATP) required for the movement of the tail, enabling the sperm to swim towards the egg.
Explanation: The tail of the sperm is a flagellum whose movement is essential for propulsion through the female reproductive tract. This movement is an active process that requires a significant amount of energy. Mitochondria are the organelles responsible for aerobic respiration, where they break down energy-rich molecules to produce ATP (adenosine triphosphate). The ATP generated then fuels the motor proteins in the tail, allowing it to beat and propel the sperm forward in its journey to reach and fertilize the egg.
(c) The acrosome digests or breaks down the outer layers of the egg cell (the zona pellucida), allowing the sperm nucleus to penetrate and fuse with the egg nucleus for fertilization.
Explanation: The egg is surrounded by protective layers, including a thick glycoprotein layer called the zona pellucida. The acrosome, located at the tip of the sperm head, is a specialized cap-like structure filled with powerful digestive enzymes (e.g., hyaluronidase and acrosin). When the sperm reaches the egg, the acrosome releases these enzymes in a process known as the acrosome reaction. These enzymes chemically break down and dissolve a path through the zona pellucida, enabling the sperm to reach and fuse with the egg’s cell membrane, leading to fertilization.
(d) The sperm enters through the vagina, travels through the cervix into the uterus, and then moves into the oviduct (Fallopian tube) where fertilization occurs.
Explanation: The journey of the sperm is a long and challenging one. It begins when sperm are deposited in the vagina during sexual intercourse. From there, they must swim through the cervix (the opening to the uterus) and into the womb or uterus. The final and most specific part of the journey involves entering the correct oviduct (Fallopian tube). Fertilization typically takes place in the upper third of the oviduct. Only a tiny fraction of the millions of sperm released actually complete this entire route to reach the egg.
▶️ Answer/Explanation
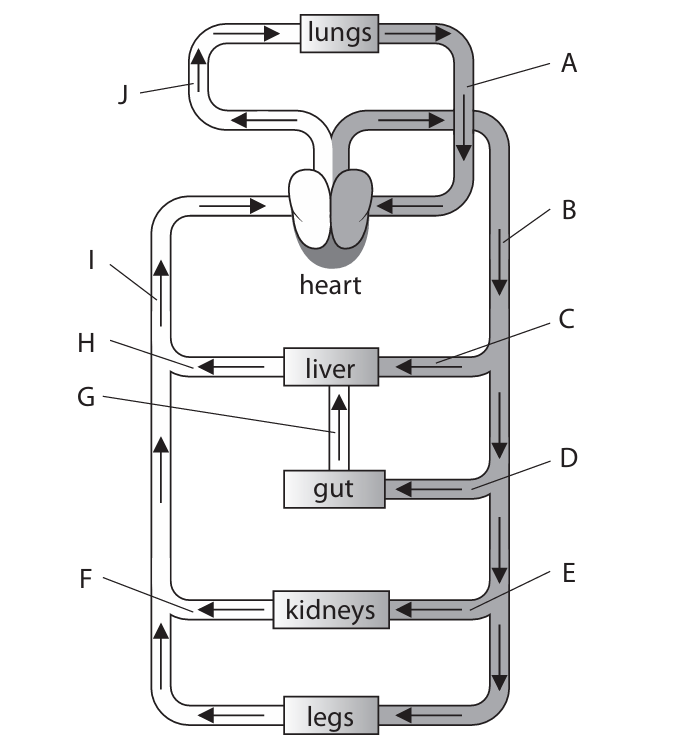
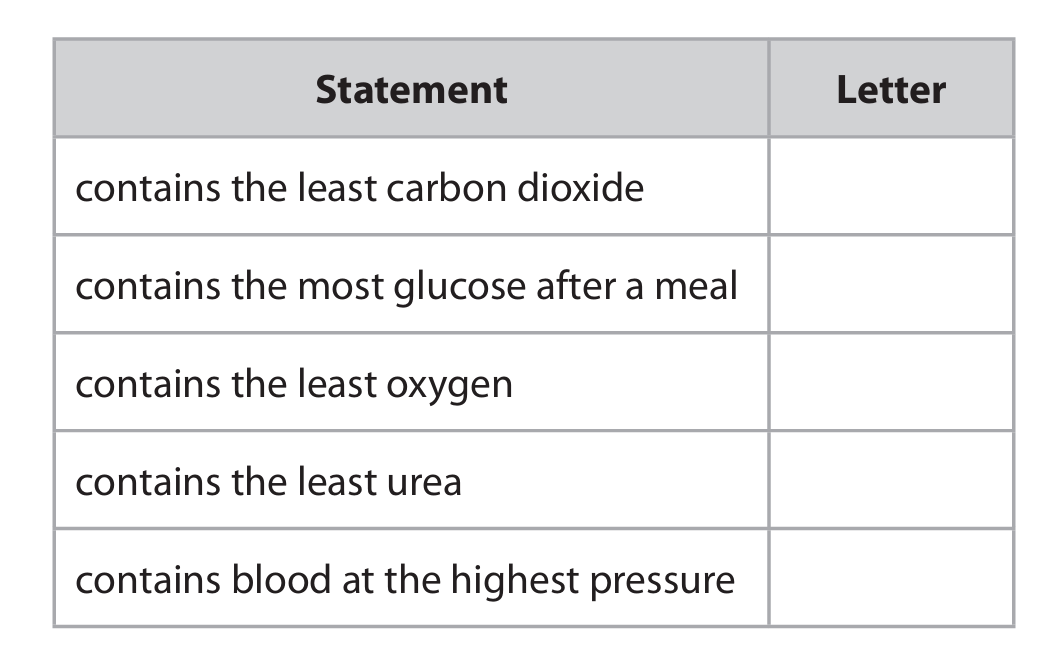
(a)(i)
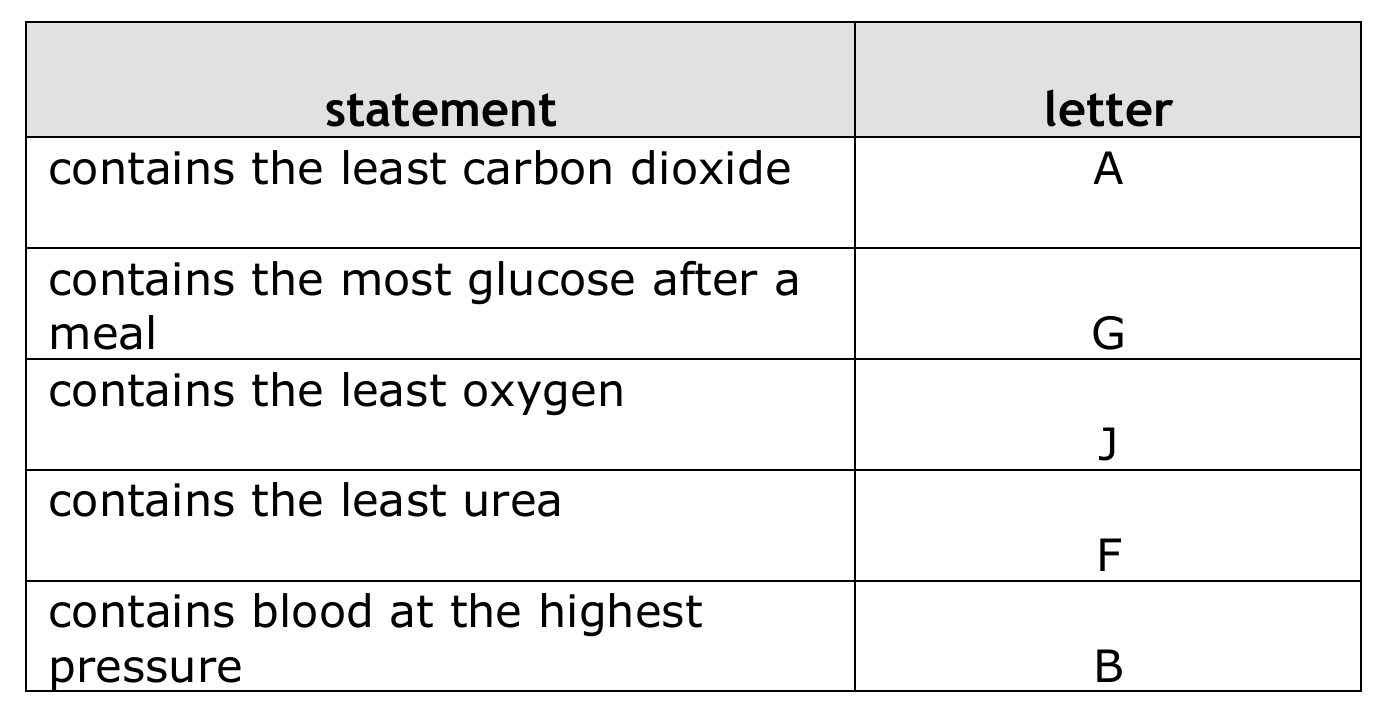
Explanation: To answer this, we need to understand the path of blood flow and the changes that occur in different vessels.
- Least Carbon Dioxide (A): This is likely a pulmonary vein, returning oxygenated blood from the lungs to the heart. It has just exchanged CO₂ for O₂ in the lungs, so its CO₂ content is minimal.
- Most Glucose after a meal (G): After a meal, the hepatic portal vein carries blood rich in absorbed nutrients, like glucose, from the digestive system to the liver.
- Least Oxygen (J): This is likely a pulmonary artery, carrying deoxygenated blood from the heart to the lungs. It has the lowest oxygen saturation.
- Least Urea (F): The renal vein carries blood away from the kidneys. The kidneys have filtered urea out of the blood, so the renal vein has a lower urea concentration than other veins.
- Highest Pressure (B): The aorta is the major artery leaving the heart. It receives blood directly from the left ventricle under high pressure, which is necessary to propel blood throughout the entire systemic circulation.
(a)(ii)
1 Blood vessel A has a thinner wall than blood vessel J.
2 Blood vessel A has a wider lumen than blood vessel J.
Explanation: Based on the roles identified in part (i), vessel A is a vein (e.g., pulmonary vein) and vessel J is an artery (e.g., pulmonary artery). Their structures are adapted to their functions:
- Walls: Arteries (J) have thick, muscular, and elastic walls to withstand high pressure and maintain blood pressure. Veins (A) have thinner walls because blood is under lower pressure.
- Lumen: Veins (A) often have a wider lumen to accommodate the slower flow of blood and facilitate the return of blood to the heart. Arteries (J) have a relatively narrower, more maintained lumen.
Other differences could include the presence of valves in veins (to prevent backflow) and more elastic tissue/muscle in arteries, but the two points listed are the primary structural distinctions.
(b)
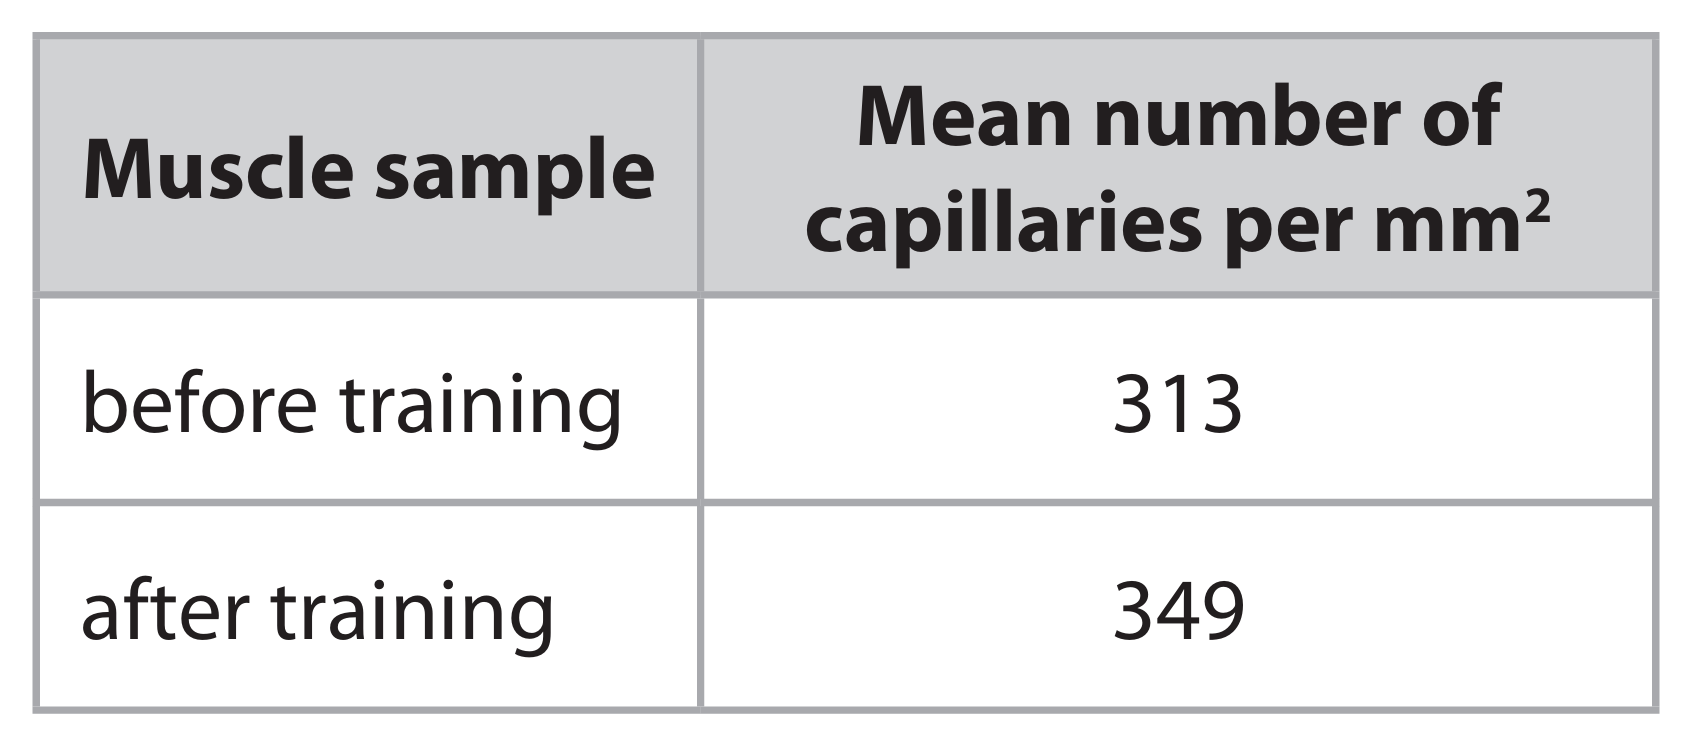
Discussion of the Scientist’s Conclusion:
The scientist’s data shows an increase in the mean number of capillaries per mm² from 313 to 349 after training. This supports the idea that training can induce physiological adaptations. Here is a discussion of the conclusion that this improves athletic performance:
Arguments Supporting the Conclusion:
- Enhanced Oxygen and Glucose Delivery: More capillaries mean a denser network for blood flow within the muscle. This reduces the diffusion distance for oxygen and glucose from the blood to the muscle cells. This is crucial for sustained aerobic respiration during exercise.
- Improved Waste Removal: A richer capillary bed also allows for more efficient removal of waste products like carbon dioxide and lactic acid, potentially reducing fatigue and muscle soreness.
- Increased Aerobic Respiration: With better oxygen and fuel supply, muscles can rely more on efficient aerobic respiration, producing more ATP (energy) and less lactic acid compared to anaerobic respiration.
- Beneficial for Endurance: These adaptations are particularly beneficial for long-distance or endurance athletic events where sustained energy production is key.
Limitations and Other Factors to Consider (Weakening the Conclusion):
- Correlation vs. Causation: The study shows a correlation between training and increased capillaries, but it doesn’t definitively prove that the capillary increase caused improved performance. Other factors changed by training (e.g., stronger heart, more mitochondria, improved lung capacity) also contribute significantly.
- Sample Size: The conclusion is based on data from a single athlete. To be more robust, the study should be repeated with a larger sample size to account for individual variation.
- Type of Performance: The adaptation might not improve all types of athletic performance equally. For short, powerful bursts of activity (e.g., weightlifting, sprinting) that rely on anaerobic respiration, an increased capillary density might be less critical.
- Other Influencing Factors: Athletic performance is complex and influenced by many other factors not measured here, such as diet, motivation, skill, nerve function, and the health of other organs like the heart and lungs.
Overall: While the increase in capillary density is a plausible adaptation that could contribute to improved athletic performance, especially in endurance sports, the scientist’s conclusion is an oversimplification. The evidence supports a positive physiological change, but it does not, on its own, conclusively prove that performance is improved, as many other variables are involved.
▶️ Answer/Explanation
(a)(i) D (trachea)
A is incorrect because it is not the bronchiole
B is incorrect because it is not the bronchus
C is incorrect because it is not the oesophagus
(a)(ii) B (pulmonary artery)
A is incorrect because it is not the aorta
C is incorrect because it is not the pulmonary vein
D is incorrect because it is not the vena cava
(a)(iii) A (contract, contract)
B is incorrect because the external intercostals do not relax
C is incorrect because the diaphragm does not relax
D is incorrect because the diaphragm and the intercostals do not relax
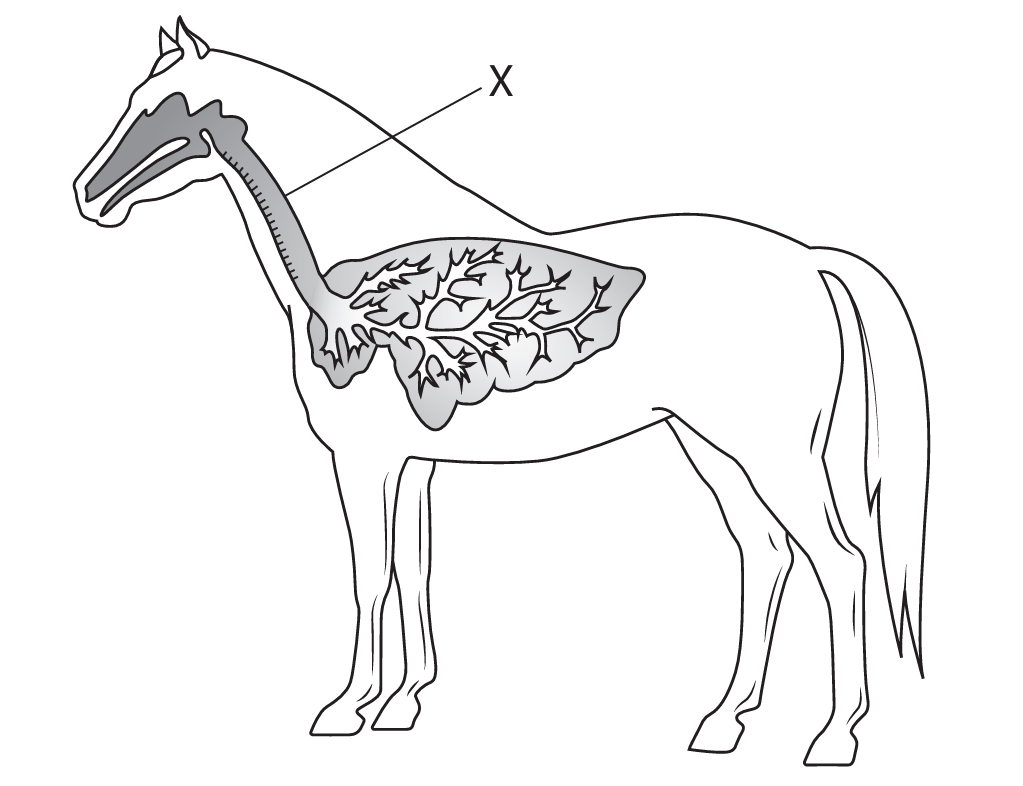
(b) An answer that makes reference to four of the following points:
• more blood to muscles / less blood to intestine (during exercise) / eq
• supply oxygen / oxygenated blood / glucose
• respiration
• energy / ATP
• muscle contraction
• less absorption of food / eq, in intestine when running /
Example full answer: When the horse runs, a much greater percentage of its total blood flow is directed to the leg muscles (increasing from 15% to 82%) to supply oxygen and glucose for aerobic respiration, which releases energy (ATP) for muscle contraction. Conversely, blood flow to the intestine decreases sharply (from 30% to 3%) because processes like digestion and absorption of food are less critical during intense physical activity. This redistribution ensures that the working muscles receive the oxygen and nutrients they need.
(c) An explanation that makes reference to two of the following points:
• (supply (more)) oxygen / there was a shortage of oxygen
• breakdown / remove lactic acid
• repay oxygen debt
• anaerobic respiration had occurred
Example full answer: The horse continues to breathe faster and deeply after running to repay an oxygen debt. During intense exercise, some muscles respire anaerobically, producing lactic acid. The continued high rate of breathing supplies extra oxygen to break down this lactic acid and to fully oxidise the remaining respiratory substrates.
▶️ Answer/Explanation
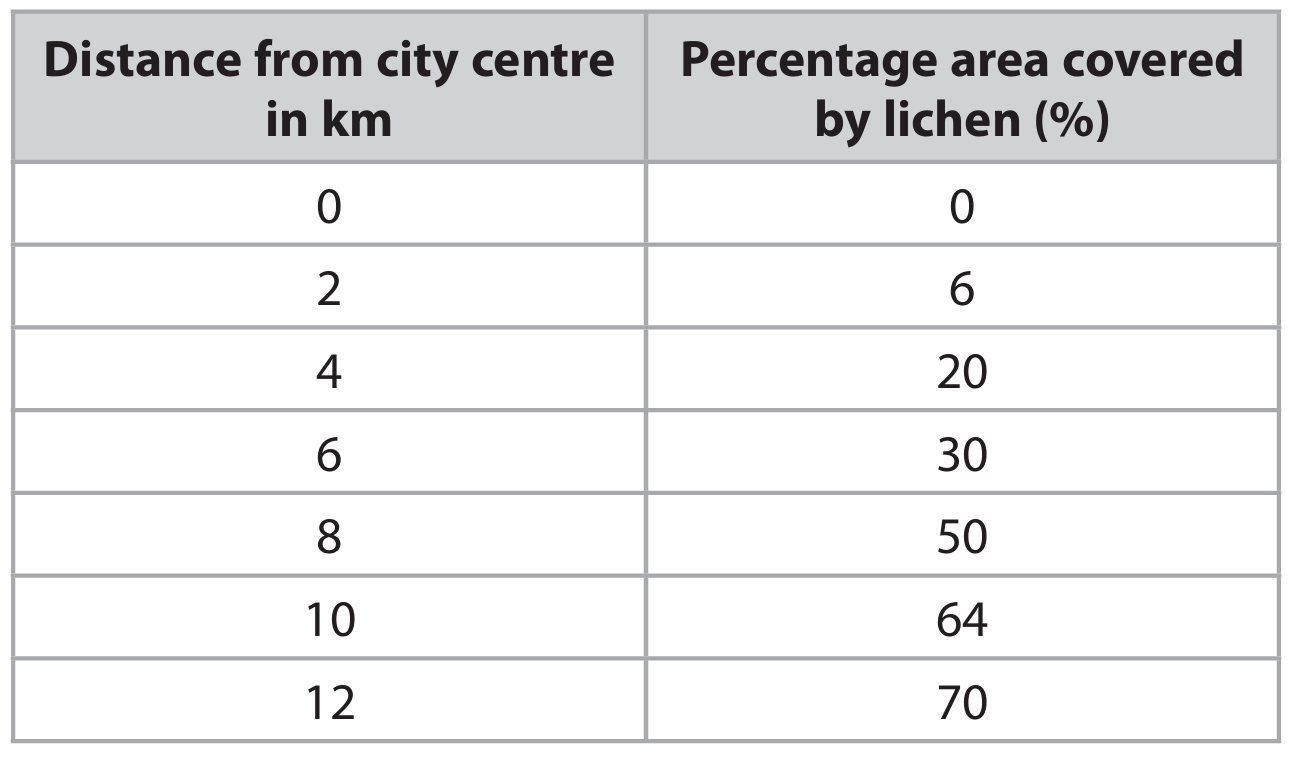
(a) An explanation that makes reference to two of the following points:
• As distance from the city centre increases, the percentage area covered by lichen increases.
• There are more cars/pollution/sulfur dioxide in the city centre, which inhibits lichen growth.
Allow converse statements (e.g., lichen coverage decreases closer to the city centre).
(b) An answer that makes reference to three of the following points:
• Measure the area covered by lichen. Allow using a grid/quadrat to count squares with lichen.
• Measure the total area of the stone wall.
• Divide the lichen-covered area by the total area and multiply by \(100\) to get the percentage.
• Repeat the measurements in different places on the wall to find a mean.
(c) An answer that makes reference to six of the following points:
• C (Change): Expose one set of germinating seeds to sulfur dioxide (\(SO_2\)) from sodium metabisulphite and another set to air without \(SO_2\) (or use different concentrations of \(SO_2\)).
• O (Organisms): Use the same species/type/age/variety of seeds.
• R (Repeat): Use a large number of seeds/repeat the experiment.
• M1 (Measurement 1): Measure the temperature change.
• M2 (Measurement 2): Use a thermometer.
• S1 (Same 1): Use a thermos flask (or insulated container) to contain the seeds and prevent heat loss.
• S2 (Same 2): Control other variables (e.g., same moisture, oxygen, starting temperature, light, time, disinfect seeds).
Answer must be in full sentences and include experimental details to access the marks.


▶️ Answer/Explanation
(a) Nucleus
Explanation: The drawing of the human cheek cell shows a large, prominent central organelle which is the nucleus. The nucleus is the control center of the cell, containing the cell’s genetic material (DNA). It is the most visible organelle in a typical animal cell when viewed under a light microscope.
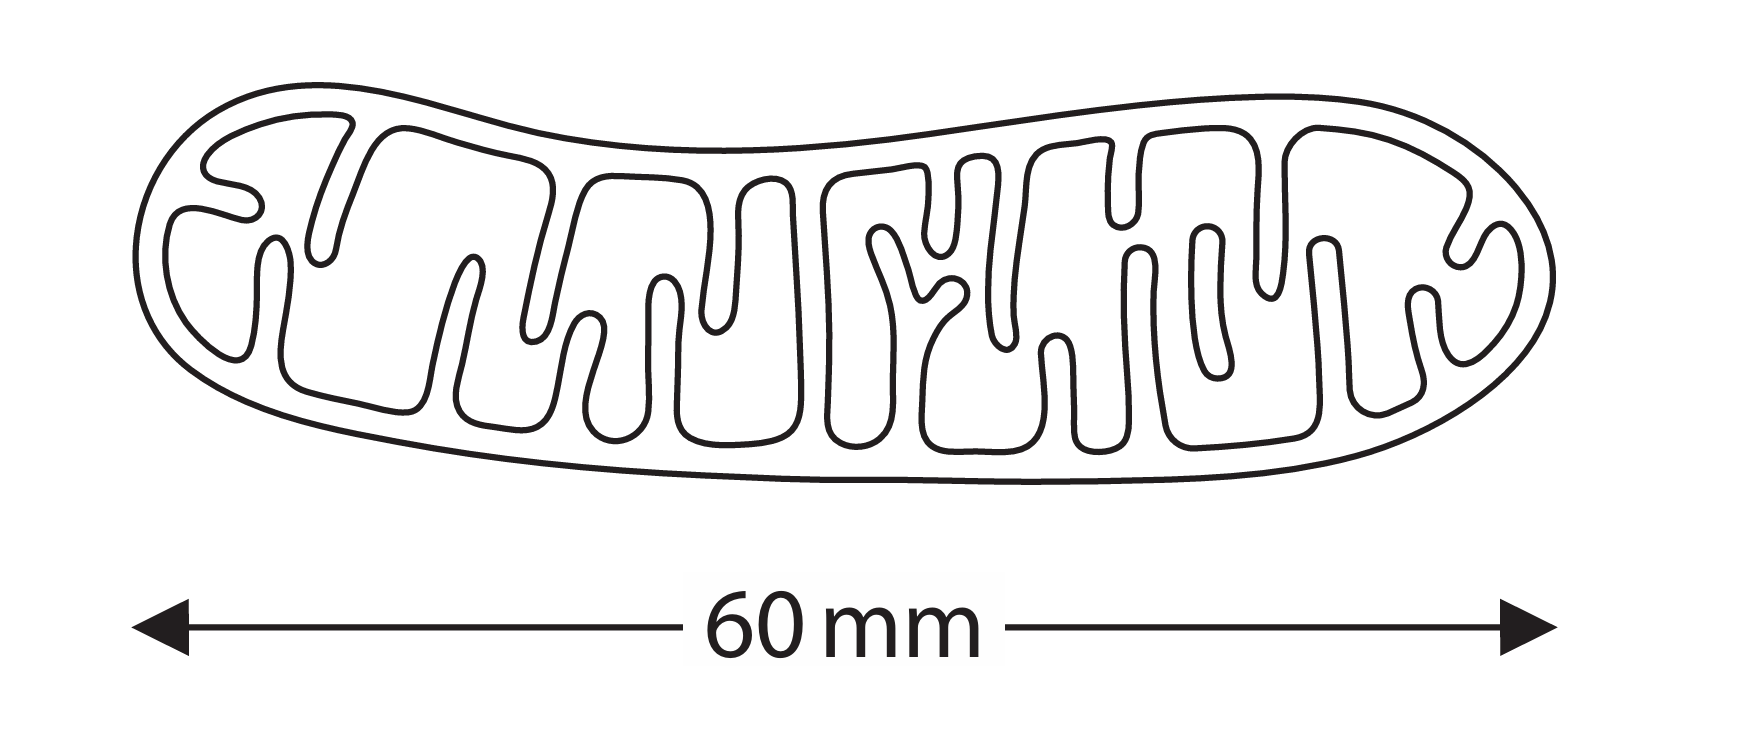
(b) Magnification = ×10 000
Explanation: To calculate the magnification, we use the formula:
\[ \text{Magnification} = \frac{\text{Size of Image}}{\text{Actual Size}} \]
First, ensure both measurements are in the same units. The actual size is 6 µm. Since 1 µm = 0.001 mm, the actual size in mm is \(6 \times 0.001 = 0.006\) mm. The image size is given as 60 mm.
\[ \text{Magnification} = \frac{60 \text{ mm}}{0.006 \text{ mm}} = 10 000 \]
Alternatively, you can convert the image size to µm: 60 mm = 60 000 µm.
\[ \text{Magnification} = \frac{60 000 \ \mu m}{6 \ \mu m} = 10 000 \]
So, the drawing of the mitochondrion has been magnified 10,000 times.
(c)(i) A 0.33
Explanation: To find the mean number of mitochondria per µm³ for the heart muscle cell, we divide the mean number of mitochondria by the mean cell volume:
\[ \frac{5000}{15000} = \frac{1}{3} \approx 0.33 \]
Therefore, there are approximately 0.33 mitochondria per cubic micrometre in a heart muscle cell.
(c)(ii)
Explanation: The data shows significant differences between sperm and egg cells regarding their mitochondria:
- Total Number: The egg cell has a vastly greater total number of mitochondria (600,000) compared to the sperm cell (only 75). This is because the egg provides the cytoplasm and organelles for the developing zygote after fertilization and needs a large energy reserve.
- Cell Volume: The egg cell is much larger in volume (4,000,000 µm³) than the sperm cell (30 µm³). The sperm cell is small and streamlined for motility.
- Density (Mitochondria per µm³): Despite having far fewer total mitochondria, the sperm cell has a much higher density of mitochondria per unit volume (2.50 per µm³) compared to the egg cell (0.15 per µm³). This high density is crucial for the sperm cell because it requires a lot of energy (ATP) to power the movement of its tail (flagellum) as it swims towards the egg for fertilization. The egg cell, being non-motile, does not require such a high density of mitochondria for immediate movement.
In summary, the sperm is a small, motile cell packed with mitochondria for energy, while the egg is a large, static cell with a massive total number of mitochondria to support early embryonic development, but they are less densely packed due to the cell’s enormous volume.

▶️ Answer/Explanation
(a) D \( C_6H_{12}O_6 + 6O_2 \rightarrow 6CO_2 + 6H_2O \)
Explanation: Aerobic respiration is the process where glucose reacts with oxygen to produce carbon dioxide, water, and energy. Option D correctly shows this balanced equation with 6 molecules each of oxygen, carbon dioxide, and water. Option A is incomplete as it lacks water, option B shows anaerobic respiration in yeast (producing ethanol and carbon dioxide), and option C has the reactants and products reversed, representing photosynthesis instead.
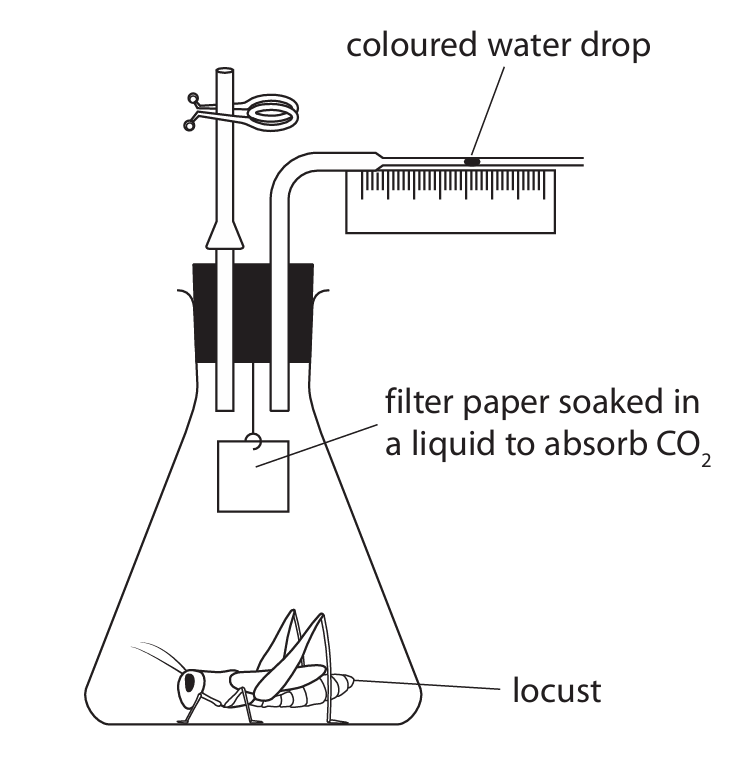
(b)(i) The coloured water drop moves because the locust respires, using oxygen and producing carbon dioxide. The carbon dioxide is absorbed by the potassium hydroxide (KOH) on the filter paper. This consumption of oxygen and removal of carbon dioxide creates a decrease in gas pressure inside the tube, causing the coloured water drop to be drawn inward (towards the locust).
(b)(ii) Three other variables that need to be controlled are:
- Mass/Size of the locusts: Larger locusts have more cells and would respire at a higher rate, so all locusts used should be of similar mass or size.
- Temperature: Respiration is an enzyme-controlled process. The rate of respiration increases with temperature, so the investigation should be conducted at a constant temperature.
- Time/Duration of the experiment: The distance the water drop moves depends on how long the locust has been respiring. All trials must be run for the same length of time to make fair comparisons.
(c)(i) The missing mean value for the female locusts is 5.3 mm (or 5.27, 5.267). This is calculated as (5.4 + 5.2 + 5.2) / 3 = 15.8 / 3 = 5.266… mm.
(c)(ii) The reliability of the data is questionable for several reasons. Firstly, there is an anomalous result in the male trial 3 (2.0 mm), which is significantly lower than the other two male results (5.0 and 4.9 mm). This outlier suggests an error may have occurred during that trial. Secondly, with only three trials, the data set is quite small. More repeats would help to identify and average out any anomalies, giving a more reliable mean. Finally, the variation within the male group (due to the anomaly) is greater than the variation between the male and female means, making it difficult to draw a confident conclusion about any difference between the sexes based on this data alone.
▶️ Answer/Explanation
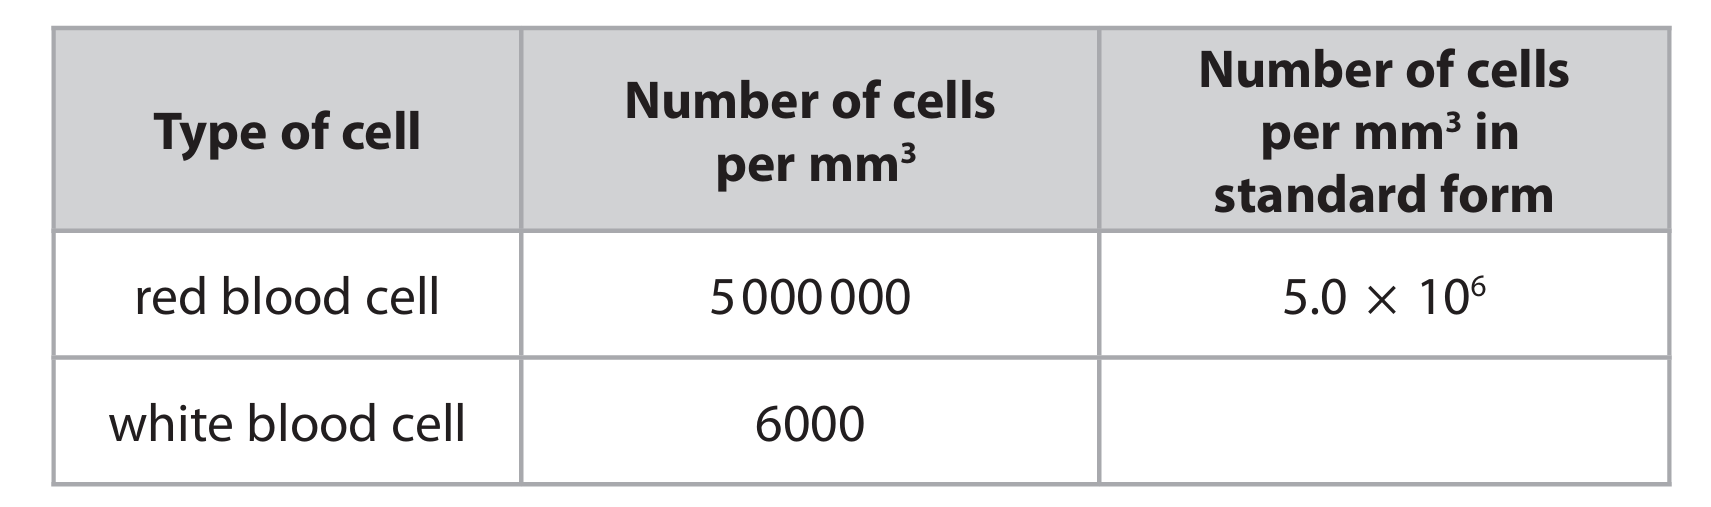
(a)(i) 6.0 × 10³
Explanation: To convert 6000 into standard form, we move the decimal point three places to the left, resulting in 6.0. Since we moved the decimal point three places, we multiply by 10 raised to the power of 3. Therefore, 6000 in standard form is 6.0 × 10³.
(a)(ii) D 5.0 × 10¹²
Explanation: First, we need to know the volume conversion. There are 1000 mm3 in 1 cm3. Therefore, 1000 cm3 is equal to 1000 × 1000 = 1,000,000 mm3 (or 106 mm3). The number of red blood cells per mm3 is 5.0 × 10⁶. To find the total number in 106 mm3, we multiply: (5.0 × 10⁶ cells/mm3) × (106 mm3) = 5.0 × 10¹² cells.
(b)(i) Red blood cells contain haemoglobin, which carries oxygen. A low red blood cell count (anaemia) means less haemoglobin is available to transport oxygen to the body’s tissues. Muscles and organs require oxygen for aerobic respiration to release energy (in the form of ATP). With less oxygen delivered, the rate of respiration decreases, leading to less energy being produced. This lack of energy causes the person to feel tired and fatigued.
(b)(ii) White blood cells are crucial components of the immune system. A low white blood cell count (leukopenia) means the body has fewer of these defence cells. Specifically, there are fewer phagocytes to engulf and digest pathogens (like bacteria and viruses) through phagocytosis, and fewer lymphocytes to produce antibodies that neutralise pathogens or mark them for destruction. With this weakened immune response, the body is less able to fight off invading microorganisms, making the person more susceptible to infections.
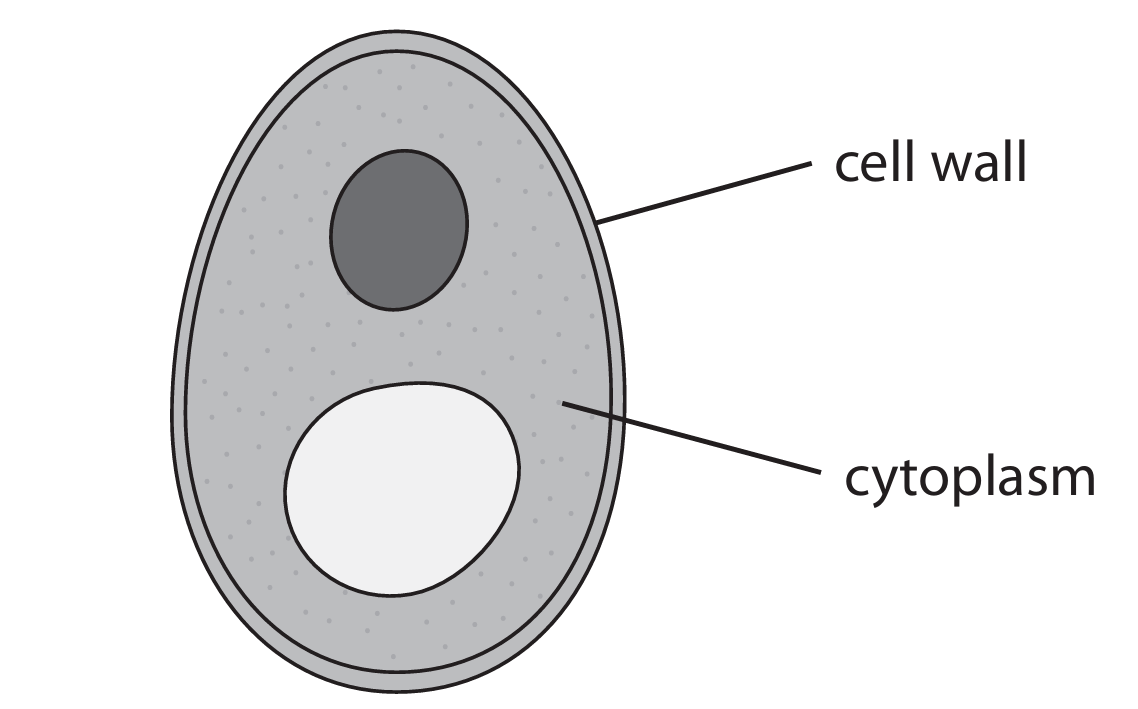
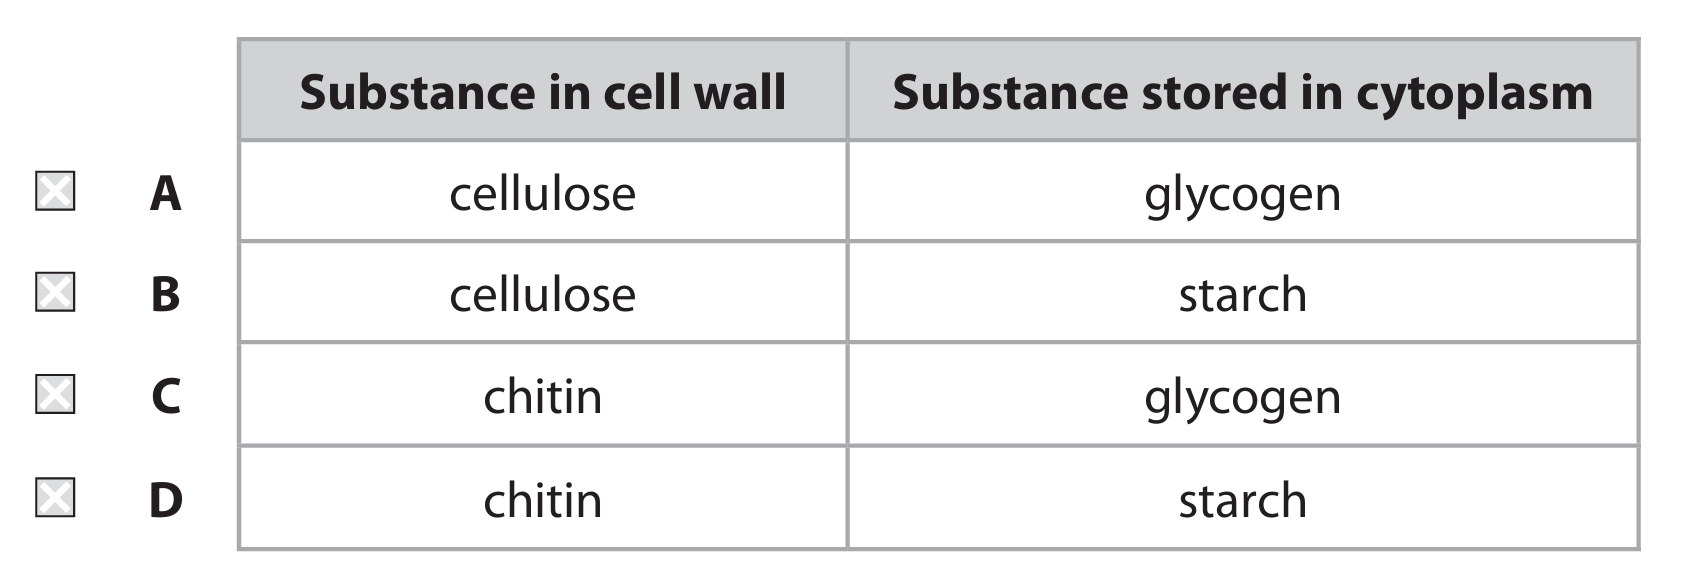

▶️ Answer/Explanation
(a)(i) C (chitin and glycogen)
Explanation: Yeast is a fungus, and fungal cell walls are primarily composed of chitin, not cellulose which is found in plants. For energy storage, fungi like yeast store glycogen in their cytoplasm, similar to animals, rather than starch which is typical of plants.
(a)(ii) B (a fungus)
Explanation: Yeast is classified as a unicellular fungus. It is not a bacterium (which are prokaryotic), a plant (which are multicellular and photosynthetic), or a protoctist (which is a diverse group including algae and protozoa).
(b)(i) B (glucose → ethanol + carbon dioxide)
Explanation: The respiration described is anaerobic respiration (fermentation) in yeast. The correct chemical equation for this process is glucose being broken down into ethanol and carbon dioxide, without the use of oxygen. Option A is incomplete, and options C and D involve oxygen, which characterizes aerobic respiration.
(b)(ii) Restriction enzyme / endonuclease / ligase
Explanation: To genetically modify the yeast, scientists use enzymes like restriction endonucleases (which cut DNA at specific sequences) and DNA ligase (which joins DNA fragments together). These enzymes are essential tools in genetic engineering for inserting new genes into an organism’s genome.
(b)(iii) Contains new / foreign DNA / gene from another organism.
Explanation: A recombinant organism is one that has had its genetic material altered by the insertion of DNA from a different source. In this case, the GM yeast has been modified to contain a gene from another organism that codes for an enzyme capable of digesting plant cell walls.
(b)(iv)
Explanation: Biofuel from plants can help reduce global warming primarily because it is part of a carbon-neutral cycle. The carbon dioxide released when the biofuel is burned is approximately equal to the carbon dioxide that the plants absorbed from the atmosphere during photosynthesis. This contrasts with burning fossil fuels, which releases carbon that has been locked away for millions of years, thereby increasing the net concentration of CO₂ in the atmosphere. Additionally, using biofuels can reduce our dependence on fossil fuels, leading to lower overall emissions of greenhouse gases.
(c)(i) 76% (accept range 69-80%)
Explanation: To calculate the percentage increase, we use the formula: \[ \text{Percentage Increase} = \frac{\text{Mass from GM yeast} – \text{Mass from normal yeast}}{\text{Mass from normal yeast}} \times 100\% \] From the graph, after 1 day, the mass from GM yeast is approximately 2.2 g and from normal yeast is approximately 1.25 g. \[ \text{Increase} = 2.2 – 1.25 = 0.95 \text{ g} \] \[ \text{Percentage Increase} = \frac{0.95}{1.25} \times 100\% = 76\% \] Slight variations in reading the graph values can lead to answers between 69% and 80% being accepted.
(c)(ii)
Explanation: The rate of ethanol production decreases after 1 day likely due to two main factors. First, the glucose (substrate) that the yeast uses for respiration begins to run out or become depleted, slowing down the metabolic process. Second, the ethanol produced is actually toxic to the yeast in high concentrations. As ethanol builds up in the surrounding environment, it can inhibit the yeast’s enzymes and eventually kill the cells, leading to a decline in the production rate.
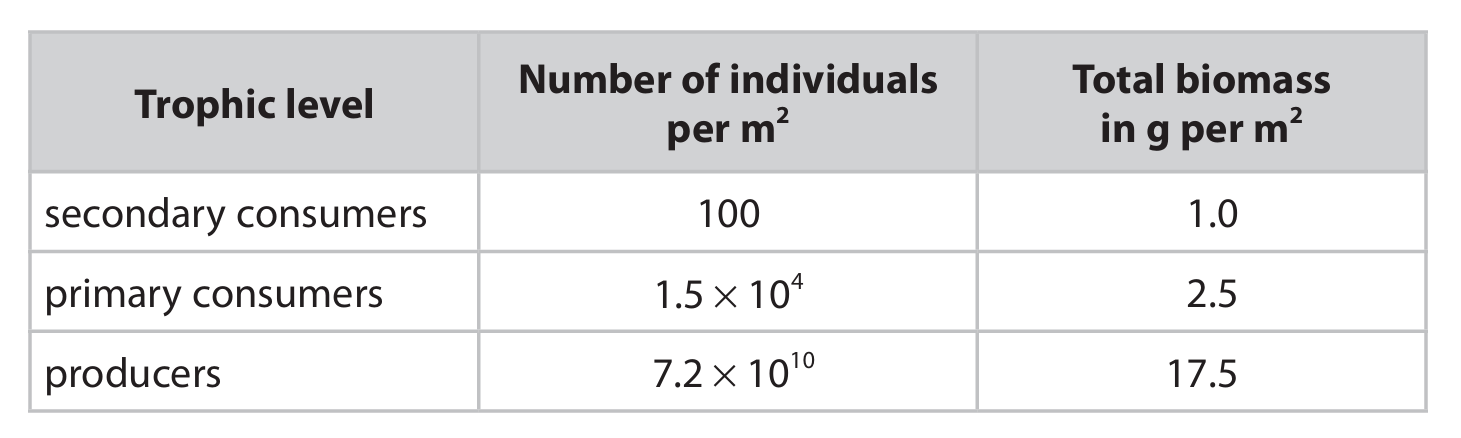

▶️ Answer/Explanation
(a) C – the organisms of all species in a habitat.
Explanation: A community in ecology refers specifically to all the populations of different species that live and interact together in a particular area or habitat. Option A describes an ecosystem, option B describes a habitat, and option D describes a population.
(b)(i) Mean mass = \(1.67 \times 10^{-4}\) g
Explanation: To find the mean mass of a single primary consumer, we divide the total biomass by the total number of individuals. The total biomass for primary consumers is 2.5 g/m², and the number of individuals is \(1.5 \times 10^4\), which is 15,000. The calculation is therefore \(2.5 \div 15,000 = 0.0001667\) g. Converting this to standard form gives \(1.667 \times 10^{-4}\) g. This very small mass makes sense as many primary consumers in a pond, like small aquatic insects or zooplankton, are tiny.
(b)(ii)
Explanation: A pyramid of biomass represents the total dry mass of living organisms at each trophic level. For this pond community, the pyramid should have three horizontal bars, each representing a trophic level. The widest bar at the bottom represents the producers (17.5 g/m²), a narrower bar above represents the primary consumers (2.5 g/m²), and the narrowest bar at the top represents the secondary consumers (1.0 g/m²). This typical pyramid shape shows that biomass decreases at higher trophic levels because energy is lost as it moves up the food chain.
(c)(i)
Explanation: Egestion is the process where undigested food material is expelled from the body as faeces. This undigested material still contains chemical energy that was present in the consumed food. Since this energy is not absorbed and assimilated by the consumer, it is lost from the food chain and is not available to be transferred to the next trophic level. For example, if a primary consumer eats a plant but cannot digest all the cellulose, the energy in that undigested cellulose is egested and lost.
(c)(ii)
1. Respiration. A significant portion of the energy that is assimilated by an organism is used for respiration to fuel life processes like movement, maintaining body temperature, and pumping ions. This energy is converted to heat and lost to the environment, making it unavailable for the next consumer.
2. Excretion. Energy is also lost through the waste products of metabolism, such as urine. These excretory products contain chemical energy that the organism has not utilized.
Other valid reasons include: Uneaten parts (organisms not fully consumed die and decompose), or Death (organisms that die without being eaten).