▶️ Answer/Explanation
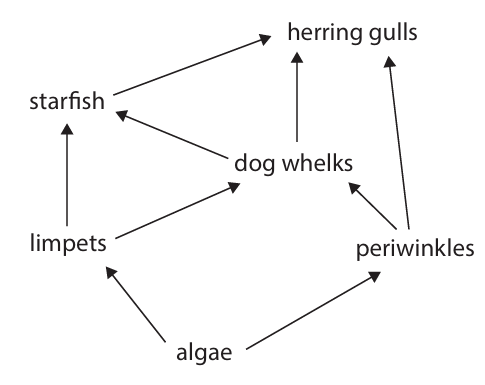
(a)(i) C (secondary consumer and tertiary consumer)
A is incorrect as it is not a primary consumer
B is incorrect as it is not a primary consumer
D is incorrect as it is also a tertiary consumer
(a)(ii) • all of (the organisms of) one / a species in an area (at one time)
(a)(iii) An explanation that makes reference to three of the following:
• (energy lost) from movement
• (energy lost) from respiration / heat loss
• (energy lost) as not some not eaten / are inedible
• (energy lost) as some not digested / indigestible / faeces / egestion
• (energy loss) due to death and decay / (energy lost) to other food chains
(b)(i) A description that makes reference to three of the following:
• quadrat / square in gridded area
• place randomly / choose random coordinates
• repeats
• count limpets (in quadrat / square)
• scale up for whole area multiply by area
(b)(ii) • time of day / location / area / position on shore / species of limpet / same day in August
(b)(iii) An answer that makes reference to five of the following:
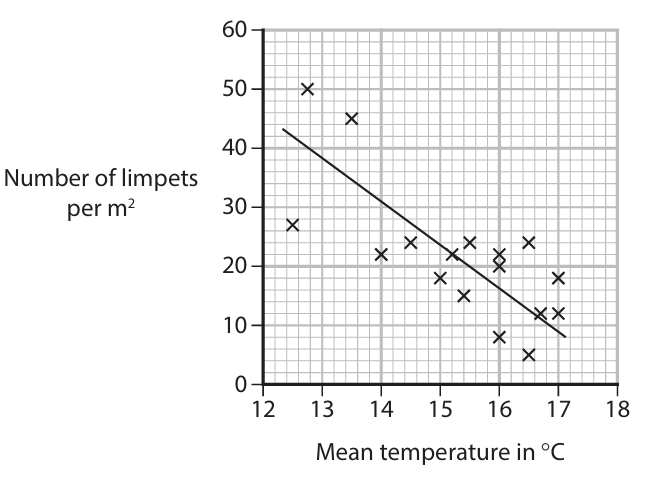
1. fossil fuel use releases carbon dioxide
2. carbon dioxide is a greenhouse gas / may cause global warming
3. increased temperature reduces limpet number
4. less food / energy for starfish / dogwhelks / gulls
5. dogwhelks / gulls / starfish / secondary consumers would decrease
6. algae would increase / less algae eaten / more food for periwinkles
7. there are anomalies / outliers / not all close to line of best fit
8. other factors may affect limpet population / other greenhouse gases may have effect
9. not done for long enough time so less reliable OR done for long time / 17 years so reliable
10. data only for one month / only August / only one location / only one shore / only looks at one species
▶️ Answer/Explanation
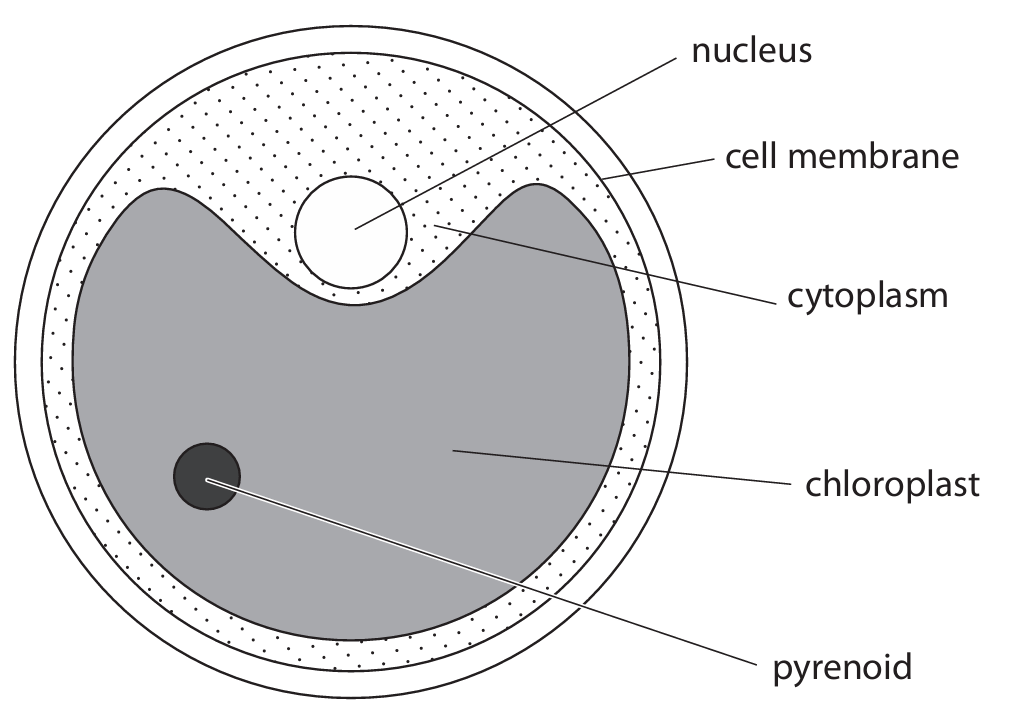
(a)(i) • producer / first trophic level (1)
(a)(ii) • tertiary consumer / third consumer / fourth trophic level (1)
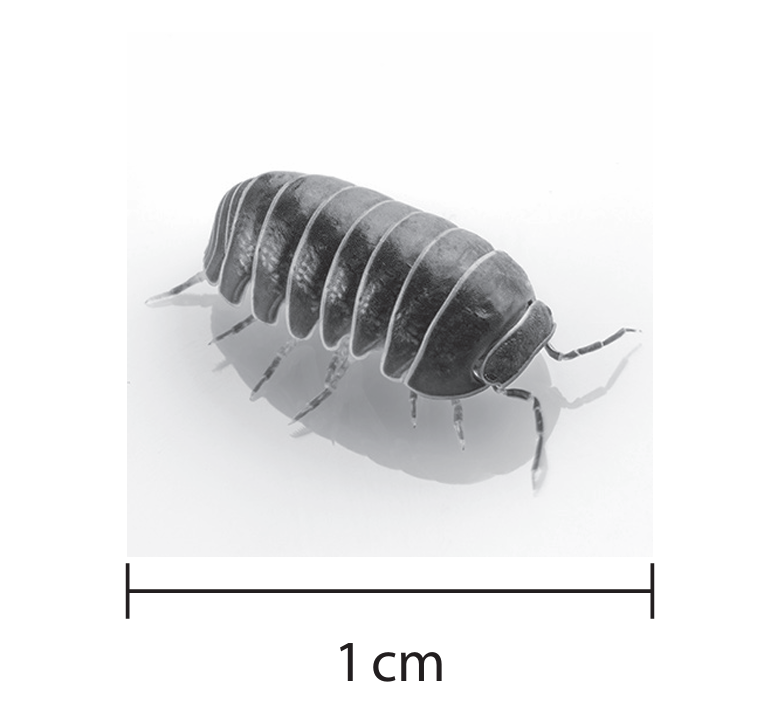
(b)(i)
Calculation method (not marking points):
Full marks for correct answer with no working.
Example: Measured length = 75 mm = 75 × 1000 = 75000 µm
Magnification = image size / actual size = 75000 µm / 10 µm = × 7500 (2)
(Allow answers in the range 7400 to 7600 depending on measurement. Ignore units in final answer.)
(b)(ii)
Calculation method (not marking points):
Full marks for correct answer with no working.
Example using formula: \( V = \frac{4}{3} \pi r^3 \)
\( r^3 = 5^3 = 125 \)
\( V = \frac{4}{3} \times 3.14 \times 125 = \frac{4 \times 392.5}{3} = \frac{1570}{3} = 523.33 \)
Volume = 523 µm3 (2) (Allow 522–524). If they round 4/3 to 1.33, answer will be = 522.
(b)(iii) A description that includes two of the following points:
• absorbs / traps (sun)light / light energy (1)
• site of photosynthesis (1)
• produces glucose / carbohydrate / sugar / starch (1)
(Note: Ignore “uses”. “Converts light energy into chemical energy” scores the first and third marking points.) (2)
(b)(iv) A description that includes the following points:
• provides an energy store / energy reservoir / stores carbohydrate (1)
• (can be broken down to release energy in) respiration (1) (2)
(c) A description that includes four of the following points:
• use quadrats (1)
• random sampling (1)
• use coordinates / grid to select sample positions (1)
• count number of individuals / plants in each quadrat (1)
• repeat and (calculate) mean / average (1)
• multiply (mean count) by size of (total) area to estimate population size (1)
(Note: “Use quadrats” scores the first and fifth marking points.) (4)

▶️ Answer/Explanation
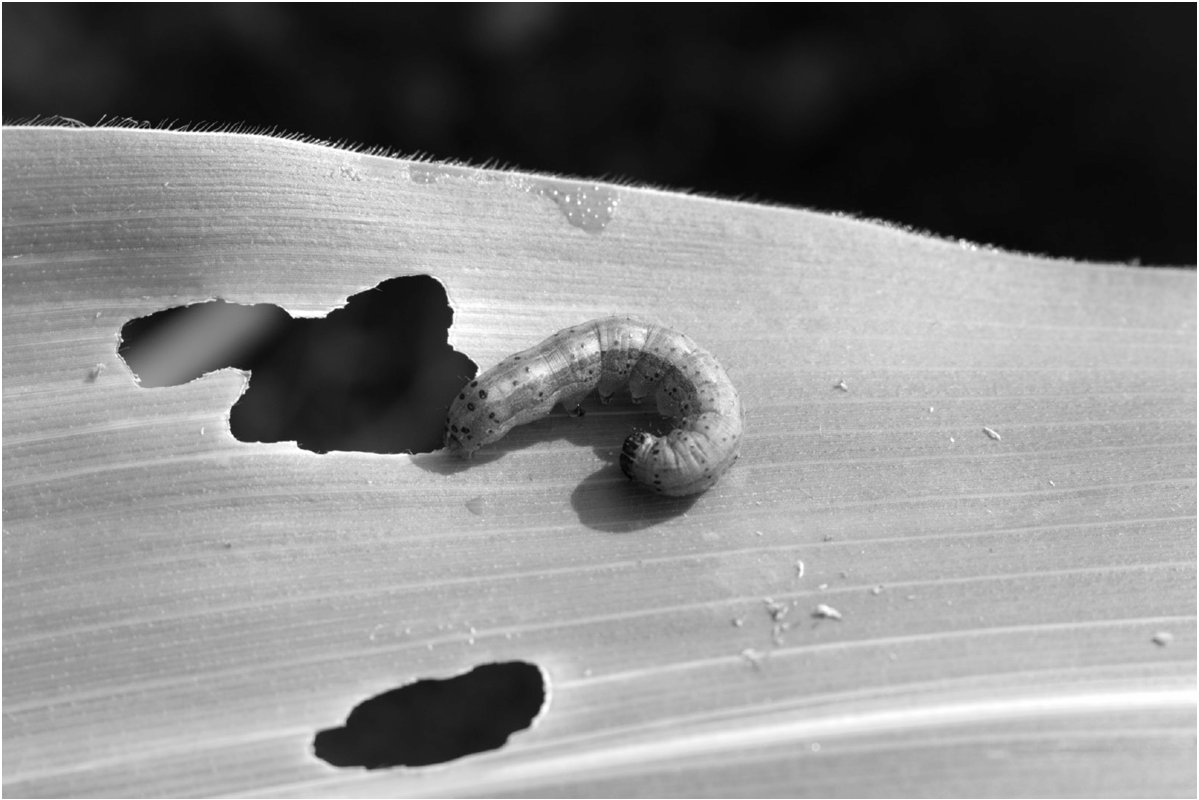
(a) An explanation that makes reference to two of the following points:
- less (leaf) area / surface / fewer leaves
- fewer chloroplasts / less chlorophyll
- (less) photosynthesis
- less carbohydrate / glucose / sugar produced
(b) An explanation that makes reference to four of the following points (advantages of biological control):
- lasts longer / does not need reapplication
- specific / does not affect food chain / other organisms
- no residue on crop / not eaten by humans / does not affect humans
- no bioaccumulation / biomagnification
- pest does not become resistant
(c)(i) An explanation that makes reference to three of the following points:
- moth population rises (up to 6 months)
- wasp population also rises as more moths / food is available
- (from 6 months) moth population falls as eaten by wasp
- wasp population falls as fewer moths to feed on / less food available
- moth population recovers / repeats pattern
(c)(ii)
Maximum moth number \( \approx 2150 \) (at ~7 months).
Minimum moth number \( \approx 850 \) (at ~11 months).
Maximum range \( = 2150 – 850 = 1300 \).
(c)(iii) An explanation that makes reference to two of the following points:
- some moths remain / doesn’t kill all moths
- delay to act / kill moths / slower (than chemical)
- numbers vary with time of year / seasons
- wasps are expensive
- wasps may become pest / may kill other organisms / may affect food chain / farmers may not want to leave wasps in their fields / may sting farmers
▶️ Answer/Explanation
(a)(i) C (2 and 3 only)
A is incorrect because chitin is not present in either.
B is incorrect because chitin is not present in either.
D is incorrect because both have chloroplasts.
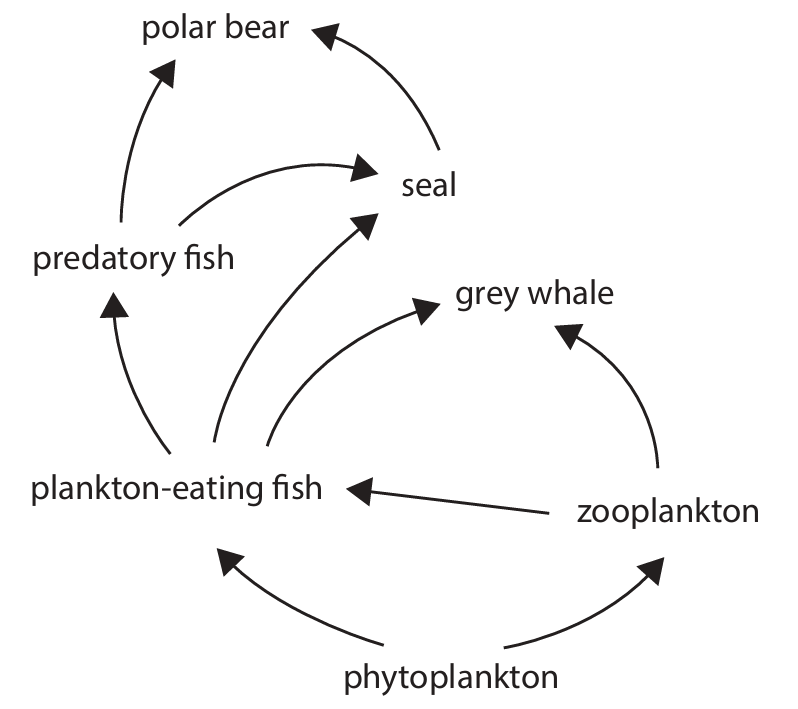
(a)(ii) Any two of: polar bear, seal, grey whale, predatory fish.
(a)(iii) phytoplankton → zooplankton → plankton-eating fish → predatory fish → seal → polar bear
One mark for correct organisms in order. One mark for correct arrow direction.
(b)(i) 950%
Working:
Increase = \(12.6 – 1.2 = 11.4\ \text{mg per dm}^3\)
Percentage Increase = \(\frac{11.4}{1.2} \times 100 = 950\%\)
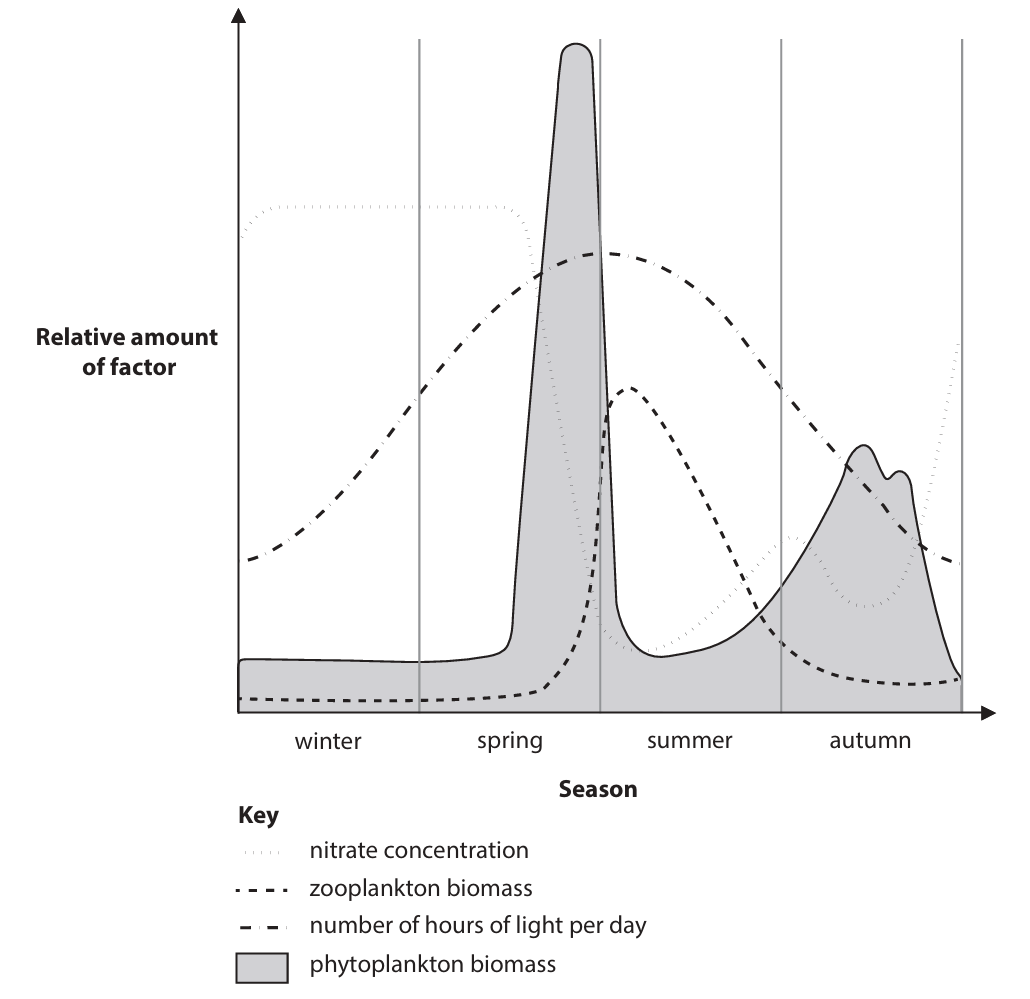
(b)(ii) An answer that makes reference to points such as:
• Phytoplankton biomass is low in winter due to low light and temperature, reducing photosynthesis.
• Biomass increases in spring as light intensity and duration increase, enhancing photosynthesis.
• Increased photosynthesis produces more glucose, allowing phytoplankton growth.
• Zooplankton biomass increases after phytoplankton increase, as they feed on phytoplankton.
• Phytoplankton decrease in late summer/autumn as zooplankton population peaks and consume them, and light/nitrate levels fall.
• Nitrate concentration decreases in spring/summer as phytoplankton absorb nitrates to make amino acids and proteins.
• The biomass of both is limited by abiotic factors (light, nitrates) and biotic factors (predation).
▶️ Answer/Explanation
Answer that makes reference to six of the following points:
- C (Change): Change the colour of the scarecrow’s clothes (e.g., use red, blue, yellow, green, etc.) as the independent variable.
- O (Other variables controlled): Keep the type/size of scarecrow, fabric, clothing size, and position in the field the same.
- R (Repeat/Reliability): Repeat the experiment multiple times for each colour and calculate averages to ensure reliability.
- M1 (Measurement 1): Measure the dependent variable, e.g., count the number of birds in the field, or measure the mass of crop eaten/remaining.
- M2 (Measurement 2): Carry out measurements over a stated, consistent period of time (e.g., one week per colour).
- S1 (Standardization 1): Control environmental factors such as time of year, weather, time of day, wind speed, and light intensity.
- S2 (Standardization 2): Use the same crop type, field area, soil quality, and avoid using pesticides or fertilisers during the experiment.
Example full-sentence answer structure:
“I would use several identical scarecrows and dress them in clothes of different colours (e.g., red, blue, yellow, green). I would place each scarecrow in a separate but identical field plot growing the same crop, at the same time of year, for one week. I would count the number of birds seen in each plot at the same time each day and also measure the mass of crop remaining at the end of the week. I would repeat the experiment with each colour three times and calculate an average. All other factors like scarecrow size, weather conditions, and field size would be kept the same to make it a fair test.”
▶️ Answer/Explanation
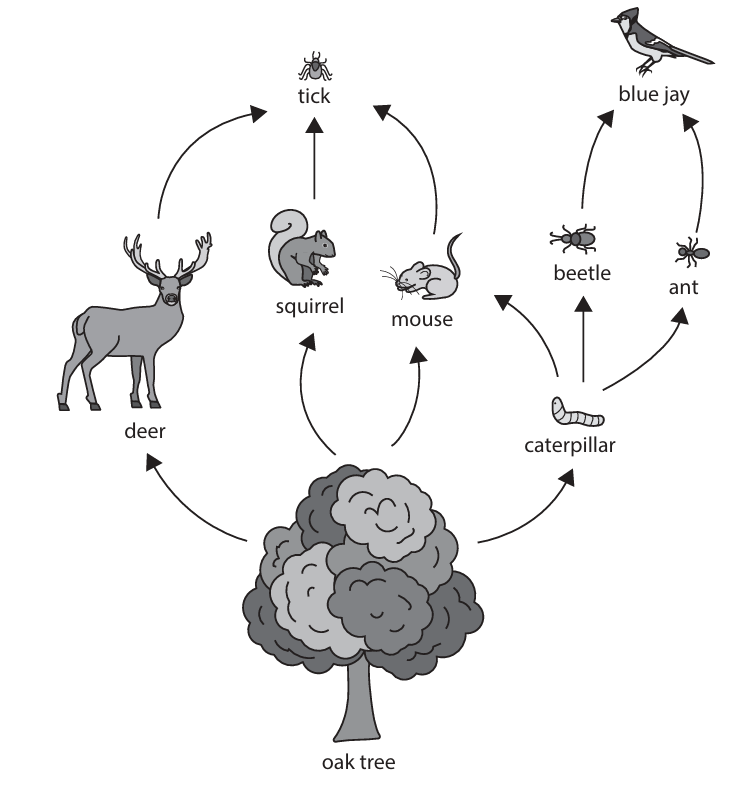
(a)(i) C (oak tree)
A is not the answer as beetle is not the producer
B is not the answer as deer is not the producer
D is not the answer as tick is not the producer
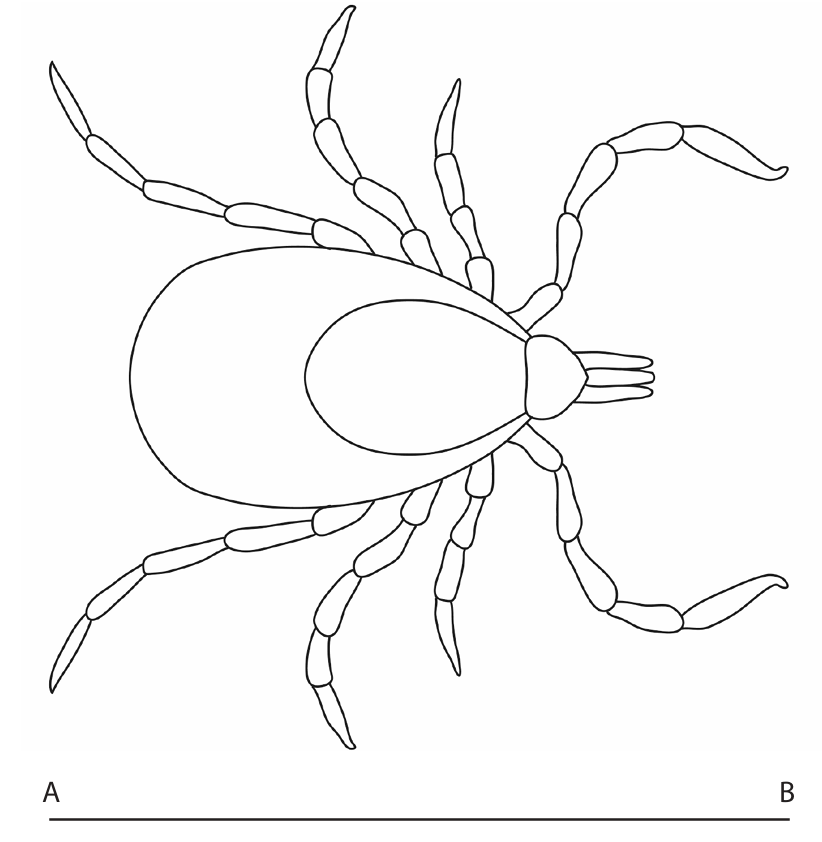
(a)(ii)
oak tree → caterpillar → mouse → tick
Allow 1 mark for correct order. No credit for pyramids.
(a)(iii) D (mouse)
A is not correct as the ant is not at two levels
B is not correct as the blue jay is not at two levels
C is not correct as the caterpillar is not at two levels
(b)(i)
Measurement of line = \(10.4 \text{ cm} = 104 \text{ mm}\)
Magnification = \(\frac{\text{image size}}{\text{actual size}} = \frac{104}{3.5}\)
Magnification = \(29.7\) (range \(29.0 – 30.0\) accepted)
Allow 1 mark for correct measurement of line (10.3-10.5 cm or 103-105 mm) with units.
(b)(ii)
An explanation makes reference to four of the following points (substance + matching function):
• Glucose (1) — for energy / respiration (1)
• Iron (1) — for haemoglobin / red blood cells (1)
• Amino acids (1) — for protein (synthesis) / growth (1)
• Fatty acids / lipids (1) — for energy / insulation (1)
• Water (1) — for keeping body hydrated / transport / solvent (1)
• Vitamin C (1) — for prevents scurvy (1)
Allow named vitamin or mineral for one mark each. Function must match substance.
(b)(iii)
An answer that makes reference to two of the following:
• Tick picks up / bites / sucks up / absorbs blood from infected animal / animal with disease (1)
• Bacteria / virus / pathogen is present in the blood (1)
• Tick then feeds on / bites a new / uninfected animal (1)
• Pathogen is transferred to the new host (1)
Allow ‘transfer’ if reference to biting is included.

▶️ Answer/Explanation
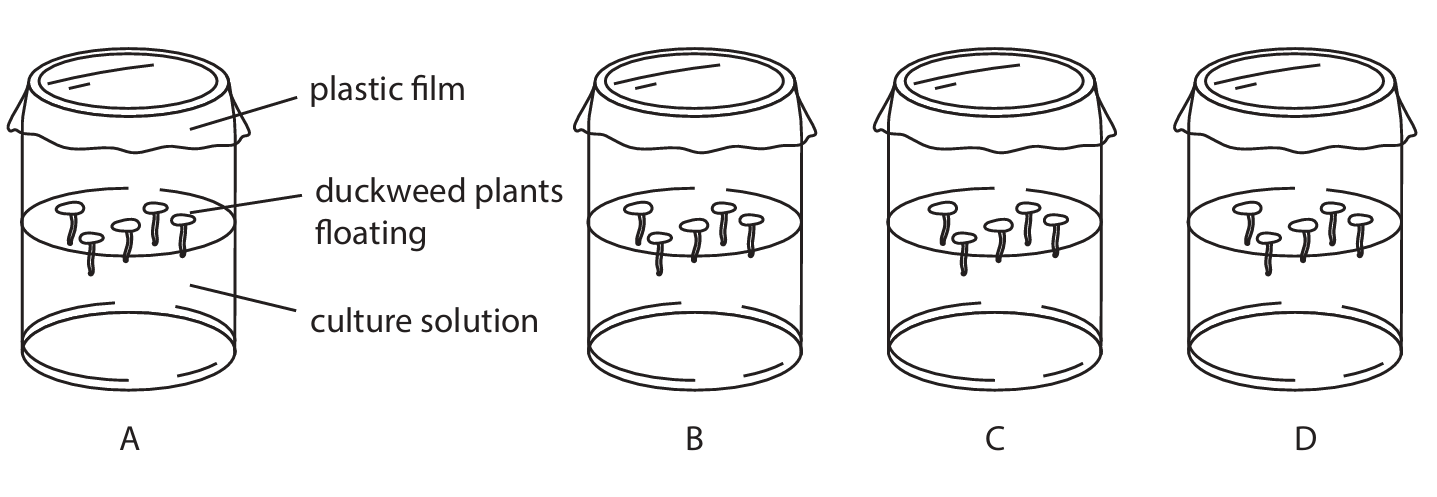
(a)(i) An answer that makes reference to two of the following:
• sunlight / light / eq (1)
• volume / mass of solution / eq (1)
• number of plants / number of leaves / size of leaves / size of plant / health of leaves (at start) / eq (1)
• same species / use duckweed / eq (1)
• time / duration / eq (1)
• all jars covered / eq (1)
(a)(ii) An explanation that makes reference to two of the following:
• it (complete solution) (contains all minerals) so produces normal growth / ideal growth / eq (1)
• distilled water contains no minerals / plant would be lacking all minerals / would not grow normally / eq (1)
• so any difference in growth due to missing one mineral / eq (1)
(a)(iii) An explanation that makes reference to two of the following:
• photosynthesis / eq (1)
• to produce glucose (for respiration) / eq (1)
• for growth / to allow normal growth / eq (1)
(a)(iv) • mineral that is missing / absent from solution / minerals present / composition of solution / solution / eq (1)
(b)(i) • (quantitative / number of leaves) uses number / is measured / counted / and (qualitative / size of leaf) is a type / category / uses words / observed / subjective / opinion / eq (1)
(b)(ii) An answer that makes reference to 6 of the following:
1. complete / no minerals lacking / A have most leaves / largest leaves / eq (1)
2. complete / no minerals lacking / A have dark green / greenest leaves / eq (1)
3. minus nitrate / B have few / least / smaller / smallest leaves / less green / yellow / eq (1)
4. nitrate required for amino acid / protein / chlorophyll / chloroplasts / nitrate required for growth / eq (1)
5. minus magnesium / C have few / smaller / less green / yellow / eq (1)
6. magnesium required for chlorophyll / chloroplasts / photosynthesis / eq (1)
7. minus iron / D have few / smaller leaves / less green / least green / yellow / eq (1)
8. iron required for chlorophyll / chloroplasts / photosynthesis / eq (1)
9. Not repeated / not reliable / few plants used / eq (1)
▶️ Answer/Explanation
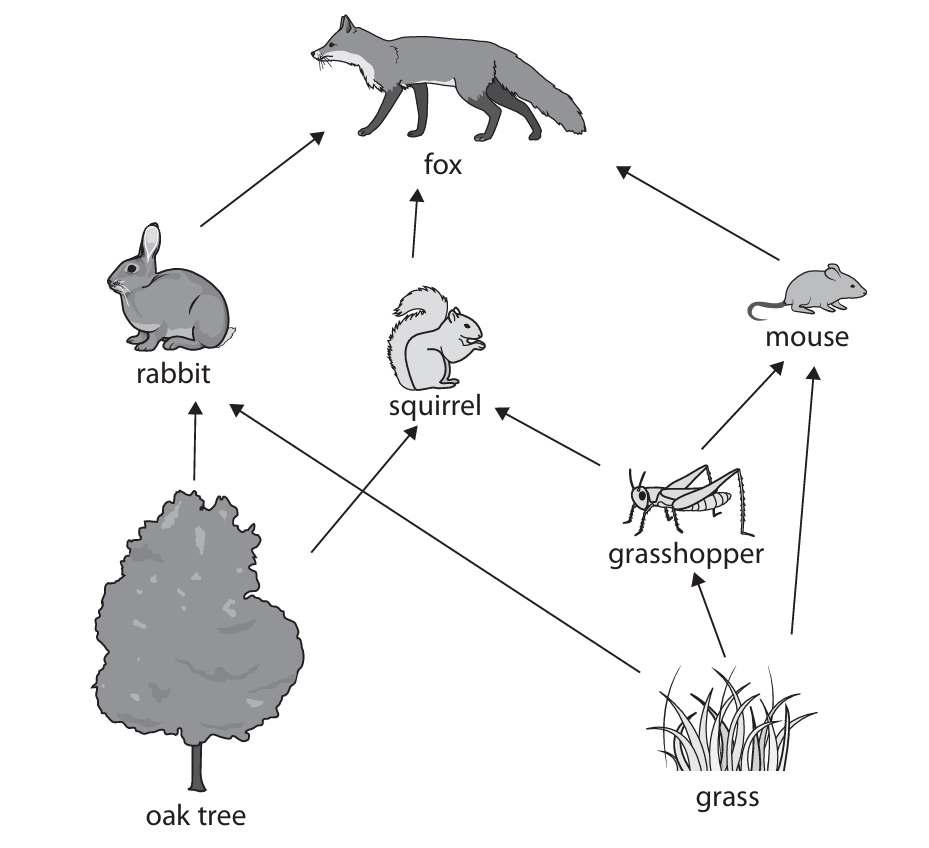
(a)(i) C (3)
Explanation: Secondary consumers eat primary consumers. Here, the fox eats the rabbit, squirrel, and mouse (all primary consumers), making it a secondary consumer in three instances.
(a)(ii) B (ecosystem)
Explanation: An ecosystem includes all living organisms and their physical environment.
(a)(iii) The food chain from the oak tree is shorter, so there are fewer energy transfers and less energy is lost.
Explanation: Energy is lost at each trophic level through respiration, waste, and uneaten parts. Shorter chains lose less energy overall.
(b)(i) To avoid bias and ensure the sample is representative of the whole area.
(b)(ii) Use more quadrats and sample systematically (e.g., along a transect or grid).
Explanation: More samples improve reliability; systematic sampling ensures even coverage.
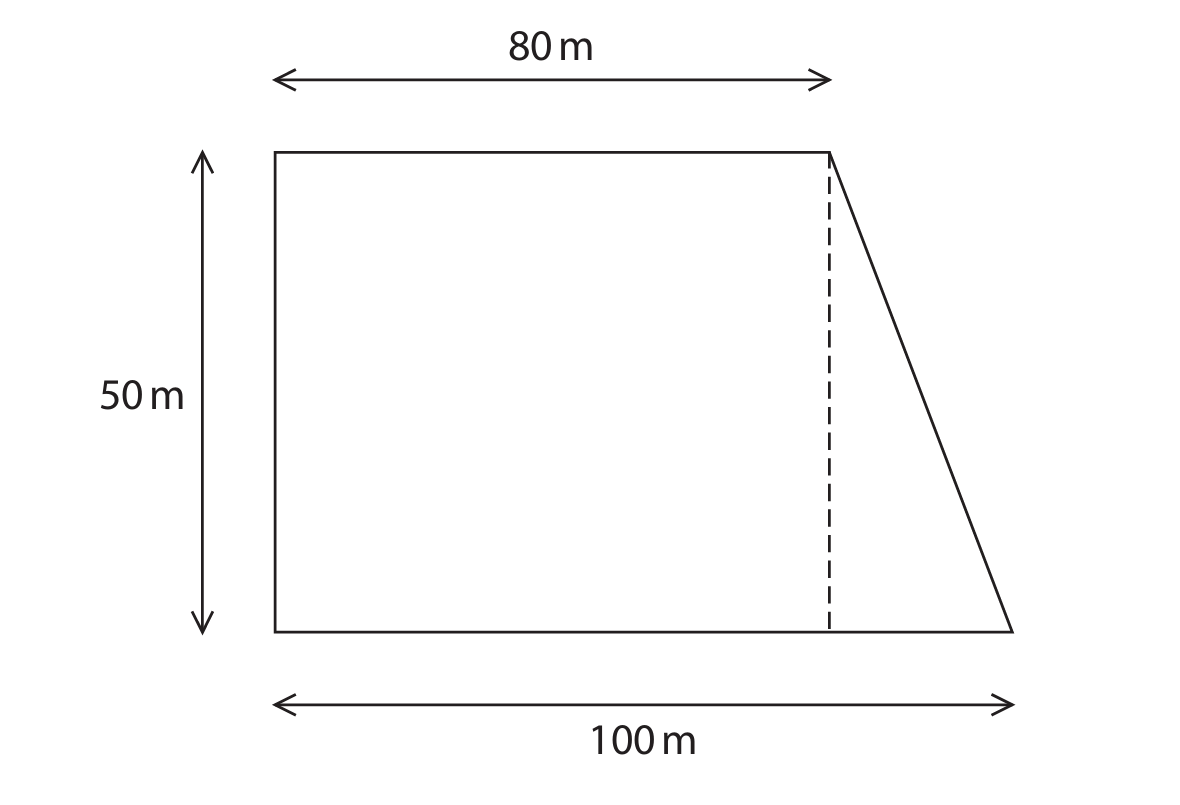
(b)(iii) 2925 m²
Explanation: Total woodland area = rectangle (80 × 50 = 4000 m²) + triangle (½ × 20 × 50 = 500 m²) = 4500 m². Grass coverage = 65% of 4500 = 2925 m².

▶️ Answer/Explanation
(a) 6CO2 + 6H2O → C6H12O6 + 6O2
Explanation: The balanced equation for photosynthesis shows that six molecules of carbon dioxide and six molecules of water are used as reactants. In the presence of light energy and chlorophyll, these are converted into one molecule of glucose (a sugar) and six molecules of oxygen gas, which is released as a byproduct.
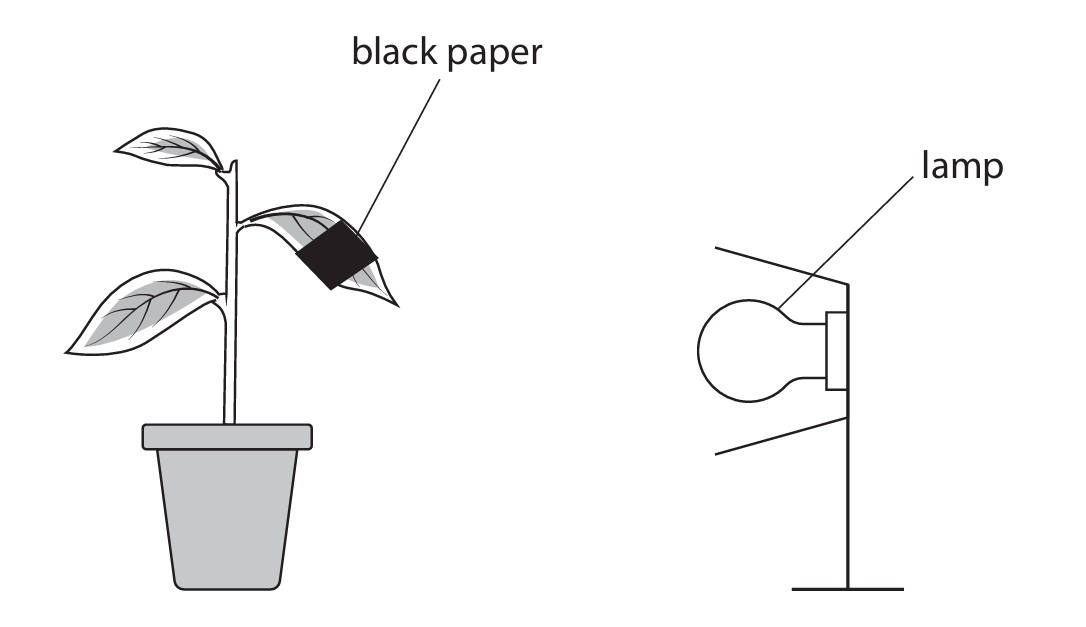
(b)(i) To destarch the leaves / remove starch / so no starch is present (in leaves) at the start of the experiment.
Explanation: Placing the plant in darkness for 24 hours ensures that any starch already present in the leaves is used up by the plant for respiration or converted to other forms for transport and storage. This is crucial because it means that any starch detected after the experiment must have been produced during the 24-hour light period, allowing the student to accurately investigate the effect of light on photosynthesis.
(b)(ii)

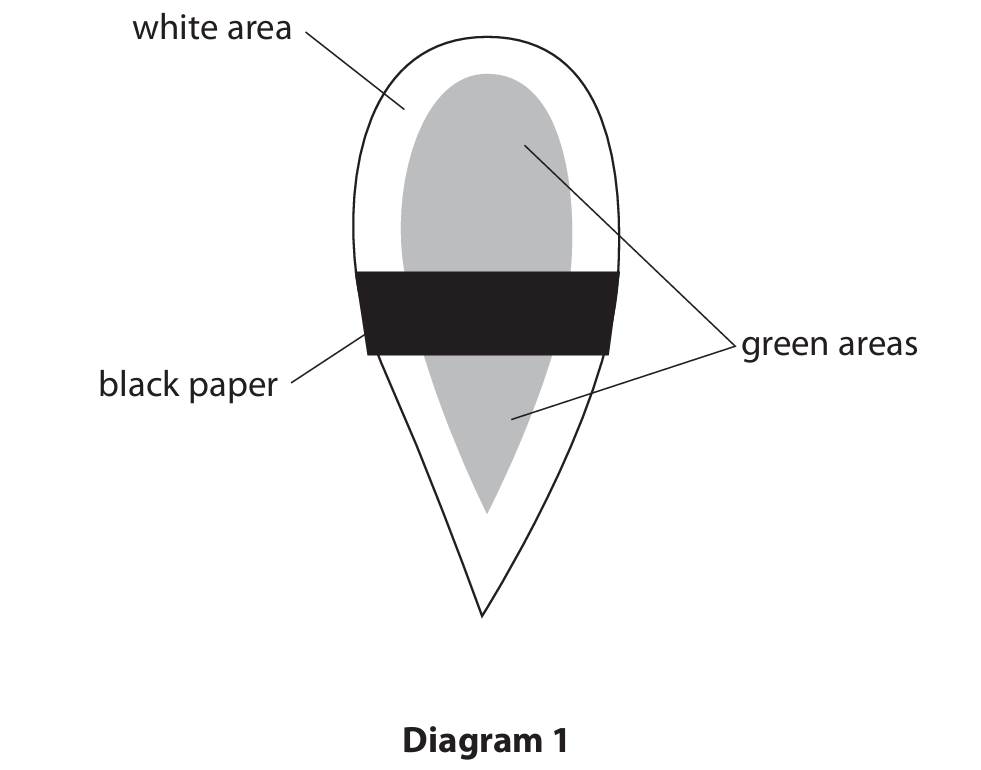
Explanation: Iodine solution turns blue-black in the presence of starch. Starch is only produced in areas of the leaf where photosynthesis occurs, which requires both chlorophyll (found only in the green parts) and light. Therefore, the green areas that were exposed to light will test positive for starch and appear black. The white areas lack chlorophyll and cannot photosynthesize, so they will not produce starch and will not turn black. The green area that was covered by the black paper was deprived of light and also could not photosynthesize, so it will not produce starch and will not turn black.
(c) A designed investigation that includes references to six of the following points:
- Control Variable: Plant ivy in areas with different exposures to light (e.g., a shaded area and an unshaded area).
- Organism: Use the same species/type of ivy. Use plants of the same age or starting size to ensure a fair test.
- Repeats: Repeat the investigation with multiple leaves and multiple plants in each light condition to improve reliability.
- Measurement 1: Measure the size of the leaves. This could be done by measuring their length, width, or calculating their surface area using a ruler.
- Measurement 2: Grow the ivy plants for a specified, identical period of time (e.g., one month) before taking measurements.
- Standardization 1: Control other factors that could affect leaf size, such as temperature, humidity, and carbon dioxide concentration.
- Standardization 2: Ensure the plants receive the same amounts of water, minerals, and the same type of soil to ensure any difference in leaf size is due to light intensity alone.
Example Investigation Description:
To investigate this, I would obtain several young ivy plants of the same species and similar size. I would place half of them in a very sunny location and the other half in a heavily shaded location. All plants would be planted in the same type of soil and would be given the same amount of water each day. I would leave the plants to grow for two months. After this time, I would randomly select 10 leaves from different parts of several plants in each group. I would measure the length and width of each leaf and calculate the average leaf size for the sunny group and the average leaf size for the shaded group. By comparing these averages, I could determine if the amount of sunlight affects leaf size. Using multiple plants and multiple leaves ensures the results are reliable.

▶️ Answer/Explanation
(a)(i)
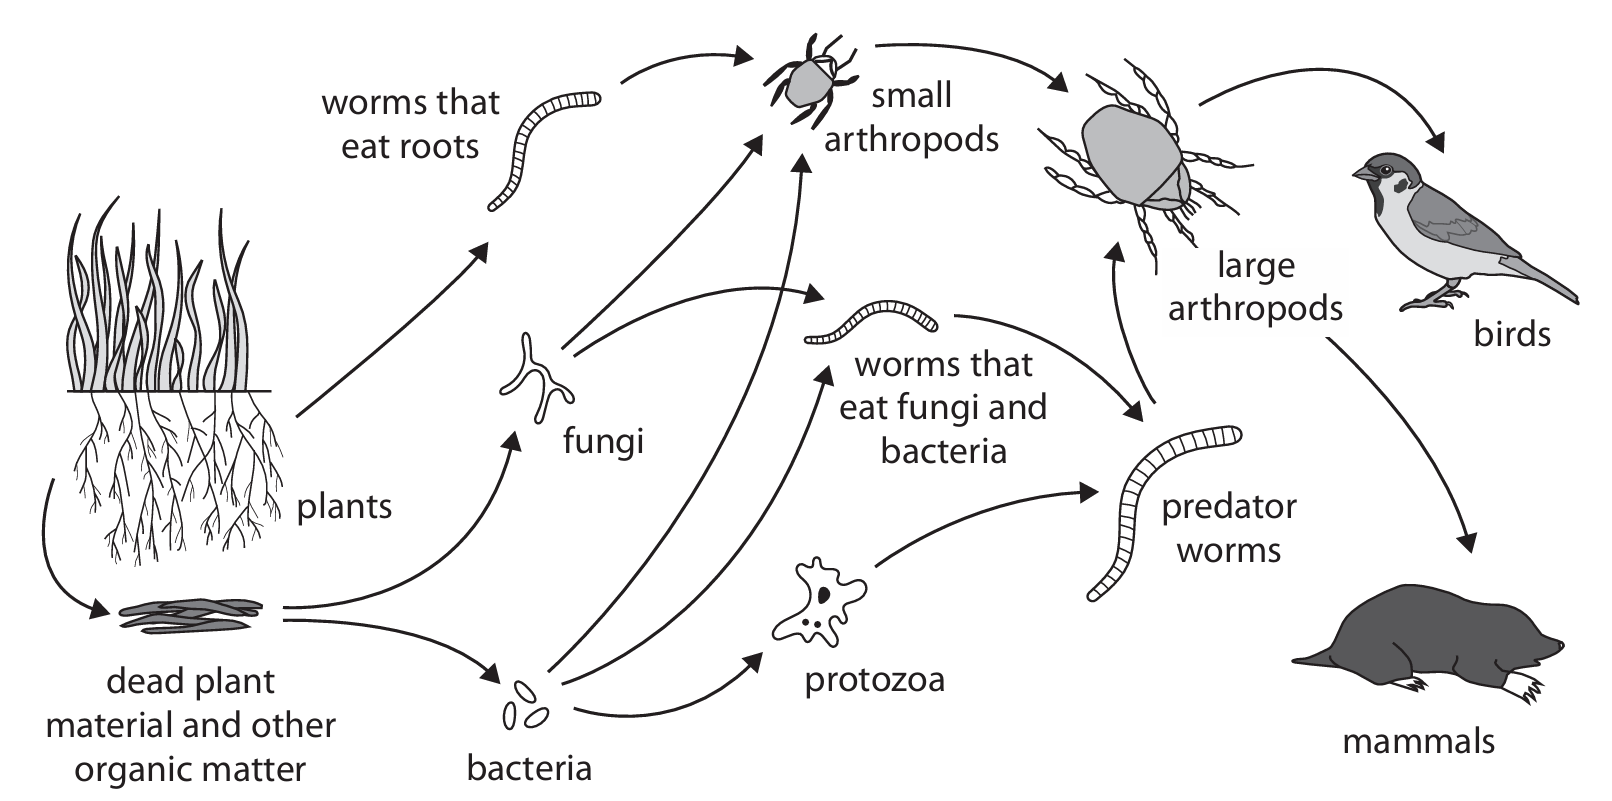
Answer: plants ⟶ worms (that eat roots) ⟶ small arthropods ⟶ large arthropods ⟶ birds
OR
(dead) plants ⟶ fungi ⟶ small arthropods ⟶ large arthropods ⟶ birds
Explanation: A food chain shows the transfer of energy from one organism to the next. Starting with plants (producers), energy moves to primary consumers (worms that eat roots), then to secondary consumers (small arthropods), then to tertiary consumers (large arthropods), and finally to quaternary consumers (birds). The arrows must point in the direction of energy flow, from the organism being eaten to the organism that eats it. The chain must include five trophic levels and end with birds.
(a)(ii)
Answer: Bacteria and fungi are decomposers. They digest/decompose/decay/break down organic matter using enzymes. They are saprophytic/saprotrophic (feed on dead matter). They respire to produce ATP/energy.
Explanation: Bacteria and fungi play a crucial role in ecosystems by breaking down dead organic material (like dead plants and animals). They secrete enzymes onto the organic matter. These enzymes break down complex molecules (like cellulose, proteins) into simpler, soluble substances. The decomposers then absorb these nutrients. The process of breaking down the material releases energy. This energy is used by the decomposers for their own life processes, primarily through respiration which produces ATP. This mode of nutrition, where organisms feed on dead and decaying matter, is called saprophytic or saprotrophic nutrition.
(b)
Answer: The bird population will decrease because there are fewer large arthropods to eat/less food. The population of worms that eat roots will increase because fewer of them are eaten by small arthropods/fewer predators of worms.
Explanation: The pesticide directly reduces the populations of small and large arthropods. Birds, which prey on large arthropods, will have less food available. This lack of food will likely lead to a decrease in the bird population due to starvation, reduced reproduction, or emigration. On the other hand, small arthropods are predators of worms that eat roots. With the population of small arthropods reduced, the predation pressure on the worms is lowered. This allows the worm population to thrive and increase in size, as fewer of them are being eaten.
(c)
Answer:
- More mites were collected in all types of traps compared to the other animal types.
- The fewest large arthropods were collected in all trap types.
- The cul-de-sac trap (C) collected the most mites.
- The pitfall trap (P) collected the fewest mites.
- The basket trap (B) collected the most springtails.
- The pitfall trap (P) collected the fewest springtails.
- There was little difference in the number of mites collected between the cul-de-sac and basket traps.
- There was little difference in the number of springtails collected between the cul-de-sac and basket traps.
- The cul-de-sac trap collected the most animals in total.
- The pitfall trap collected the fewest animals in total.
Explanation: By analyzing the graph data, we can discuss the effectiveness of each trap for different animals. The results show that mites are the most commonly collected animal group across all traps. The cul-de-sac trap is particularly effective for collecting mites, while the basket trap is best for springtails. The pitfall trap is the least effective for collecting both mites and springtails. The number of large arthropods collected is consistently low across all traps. The overall most effective trap for collecting a high total number of soil animals appears to be the cul-de-sac trap, while the pitfall trap is the least effective overall. These differences are likely due to the design of the traps, which target different animal behaviors (e.g., crawling, falling, being active on the surface).

▶️ Answer/Explanation
(a)(i) A (aphid)
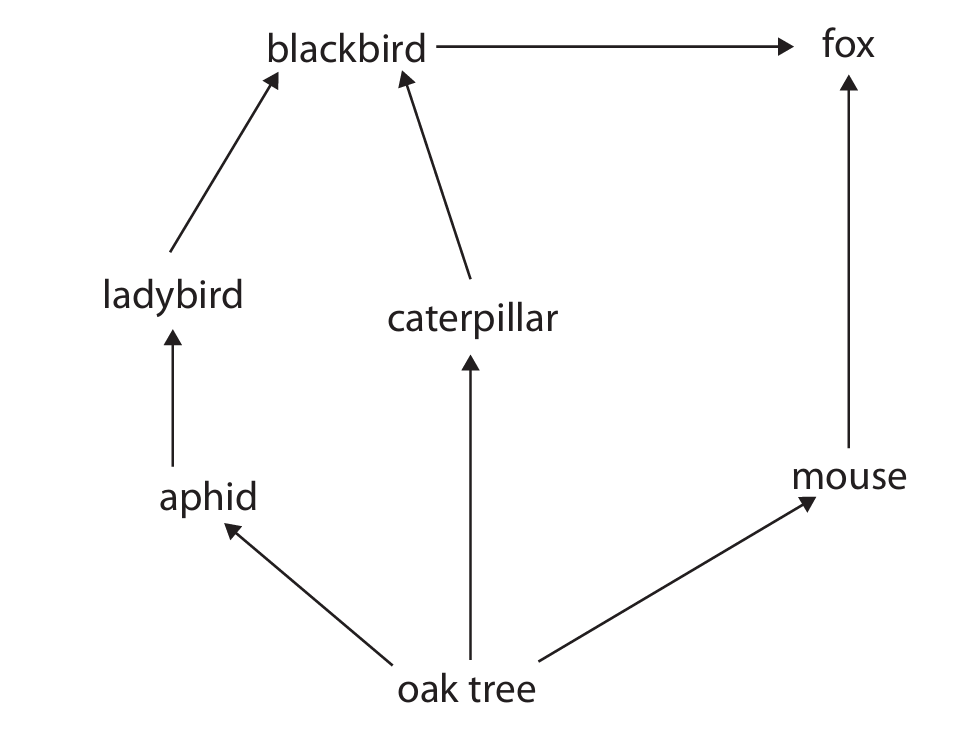
Explanation: A primary consumer is an organism that eats producers. In this food web, the oak tree is the producer. The aphid feeds directly on the oak tree, making it the primary consumer. The blackbird and fox are consumers that eat other animals, so they are secondary or tertiary consumers.
(a)(ii) D (all the different species in the area)
Explanation: A community is defined as all the populations of different species living and interacting in a particular area at the same time. Option A describes an ecosystem (community + habitat). Option B describes a single population. Option C also describes an ecosystem.
(b)(i)
Answer: A pyramid of numbers represents the number of organisms at each trophic level. The base should be the producer (oak trees). Since there are 4 oak trees, the bar should be drawn to represent this number. The next level is the primary consumer (mice), with a bar for 20 mice. The top level is the secondary consumer (foxes), with a bar for 2 foxes. The pyramid should be drawn to scale, meaning the relative sizes of the bars should accurately reflect the numbers (e.g., the mouse bar should be 5 times wider than the fox bar, and the oak tree bar should be 5 times narrower than the mouse bar). The pyramid should be labelled with the names of the organisms and the trophic levels.
[A drawn pyramid with ‘Fox (2)’ at the top, ‘Mouse (20)’ in the middle, and ‘Oak Tree (4)’ at the bottom, all bars correctly scaled and labelled.]
(b)(ii) 100 kJ
Explanation: First, calculate the total energy transferred to all the mice. 8% of 25,000 kJ is transferred.
Calculation: \( \frac{8}{100} \times 25,000 = 2,000 \) kJ.
This is the total energy for 20 mice. To find the mean for one mouse, divide this total by 20.
Calculation: \( \frac{2,000}{20} = 100 \) kJ.
So, the mean amount of energy transferred to the biomass of one mouse each year is 100 kJ.
(b)(iii)
Explanation: Energy is lost at each stage of a food chain, which is why the percentage transferred is so low. The reasons include:
• Not all parts of the oak tree are eaten by the mice (e.g., deep roots, thick bark).
• Some of the energy absorbed by the mice is lost through respiration to fuel metabolic processes like movement and maintaining body temperature. This energy is lost as heat.
• Some of the ingested material is egested as faeces because it cannot be digested or absorbed.
• Energy is also lost in excretory materials, such as urine.
These losses mean that only a small fraction (in this case, 8%) of the energy from the oak trees’ biomass is available to be stored in the mice’s biomass for growth.


▶️ Answer/Explanation
(a)
Calculation:
For 1992:
Total moths = 9 (light) + 27 (dark) = 36
Percentage dark = (27 / 36) × 100 = 75%
For 1998:
Total moths = 13 (light) + 9 (dark) = 22
Percentage dark = (9 / 22) × 100 ≈ 40.91% (or 41%)
Difference:
75% – 40.91% = 34.09% (Accept answers in the range of 34% to 34.1%)
Explanation: The calculation involves finding the percentage of dark moths for each year by dividing the number of dark moths by the total number of moths caught that year and multiplying by 100. The difference between these two percentages is then found by subtraction.
(b) (i)
Graph Requirements (for full marks):
- Appropriate linear scale using at least half the graph paper.
- Axes correctly labelled (e.g., “Year” on x-axis, “Number of moths” on y-axis).
- Points plotted accurately within half a small square.
- Straight lines drawn to connect the points.
- A key or labels to distinguish the line for light-coloured moths from the line for dark-coloured moths.
Explanation: A line graph is the correct choice to show trends over time. The x-axis should represent the years from 1992 to 1998, and the y-axis should represent the number of moths. Two separate lines should be drawn: one for the light-coloured moth counts and another for the dark-coloured moth counts. Using a ruler ensures the lines are neat and straight, connecting the data points accurately.
(b) (ii)
Comment:
- The number of dark-coloured moths generally decreased from 1992 to 1995 (from 27 to 1), then showed a slight but unsteady increase towards 1998 (reaching 9).
- The number of light-coloured moths was more variable but showed an overall increase from 1992 to 1998, particularly after a low point in 1996. The initial number was 9, it fluctuated, and ended at 13 in 1998.
- The overall total number of moths decreased significantly from 1992 to 1996 (from 36 to 5) before increasing again by 1998 (to 22). This overall change could be due to factors like disease, predation, or lack of food affecting the total population.
- These changes are linked to the reduction in coal burning and air pollution. Soot from coal had previously darkened tree trunks, providing camouflage for dark moths against predators like birds. As pollution decreased, tree trunks became lighter.
- This made dark moths more visible and thus more vulnerable to predation, causing their numbers to fall initially.
- Conversely, light moths became better camouflaged on the cleaner trees, leading to their survival and increase in numbers (natural selection).
- The subsequent slight recovery of dark moths might be due to other factors like genetic diversity or local variations in habitat, but the overall trend shows the population adapting to the cleaner environment, favouring the light-coloured form.
Explanation: This answer comments on the specific trends for each colour morph, links the initial dominance of the dark morph to industrial melanism and camouflage on sooty trees, and explains how the environmental change (clean air laws) reversed the selective pressure. It also acknowledges other potential factors affecting population size and the role of natural selection in driving these changes over time.
▶️ Answer/Explanation
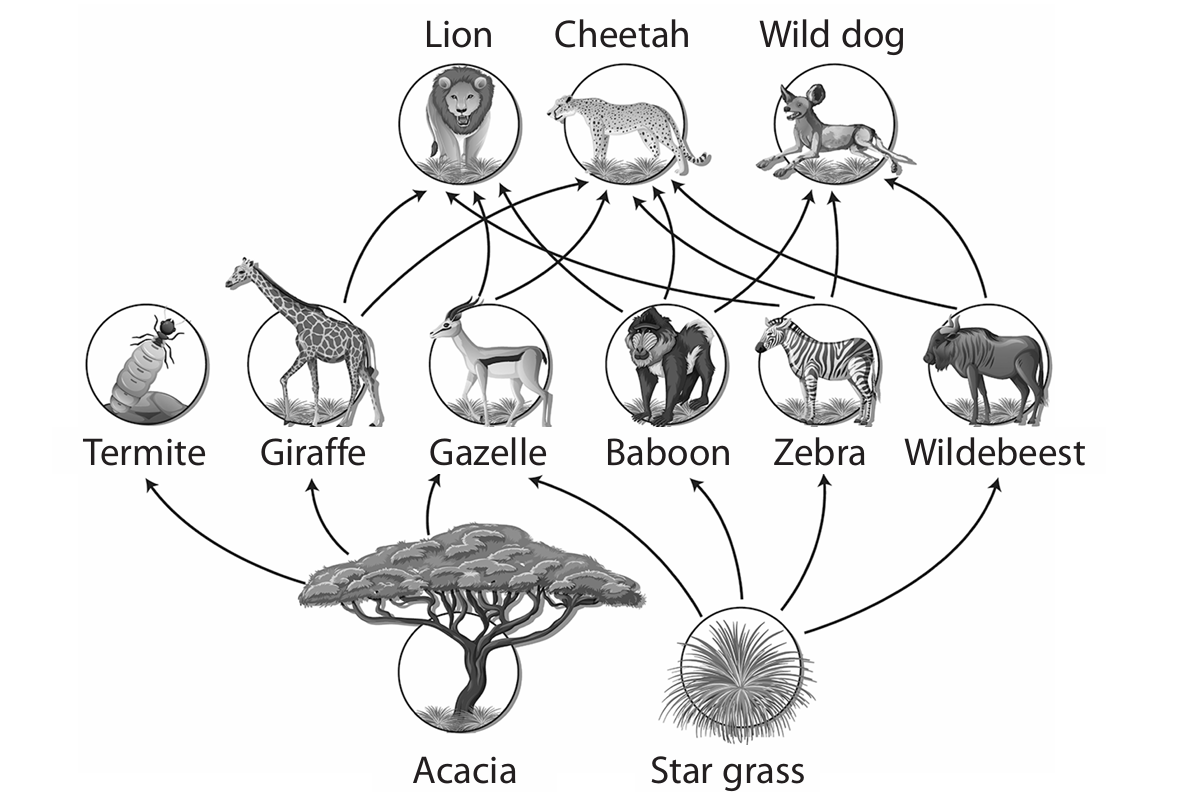
(a)(i) D (zebra)
Explanation: Primary consumers are herbivores that eat producers (plants). In this food web, the zebra eats star grass, making it a primary consumer. Acacia and star grass are producers, while lion is a secondary or tertiary consumer.
(a)(ii) B (star grass to baboon)
Explanation: Energy transfer from producers to primary consumers is the least efficient transfer in ecosystems. This is because plants utilize a significant portion of the energy they capture for their own respiration, growth, and reproduction, leaving less available for consumers. Additionally, not all plant material is consumed or digestible.
(a)(iii) B (gazelle)
Explanation: The gazelle population is likely to be least affected by an increase in wild dogs. This might be because gazelles are not a primary food source for wild dogs, or they may have adaptations that make them less vulnerable to predation compared to other prey species like baboons, wildebeest, or zebras.
(b)(i) Only a small proportion of energy is transferred between trophic levels due to several factors:
• Not all organisms at one trophic level are consumed by the next level
• Some parts of organisms are not eaten (e.g., bones, fur)
• Not all consumed material is digested and absorbed (lost in feces)
• A significant amount of energy is used for respiration, movement, and other metabolic processes
• Energy is lost as heat during these metabolic processes
Explanation: Energy flows through ecosystems with decreasing efficiency at each trophic level. Typically, only about 10% of the energy from one trophic level is transferred to the next. This limits the length of food chains and explains why top predators are often less abundant than their prey.
(b)(ii) To compare star grass population sizes in two areas, a scientist could:
1. Use quadrats (square frames of known area) placed randomly in each area
2. Count the number of star grass plants within each quadrat
3. Repeat this process multiple times in each area to get a representative sample
4. Calculate the average number of plants per quadrat for each area
5. Scale up these averages to estimate the total population in each area
6. Use statistical tests to determine if any difference between the two areas is significant
Explanation: This method ensures a systematic and unbiased approach to population estimation. Random sampling prevents selection bias, while multiple samples increase reliability. The quadrat method is particularly suitable for plants that don’t move and are distributed somewhat evenly.
(c) Wild dogs hunting weak and sick animals benefits the prey species in several ways:
• It removes individuals that are less likely to survive and reproduce successfully
• It prevents the spread of diseases within the prey population
• It strengthens the genetic pool by allowing healthier individuals to reproduce
• It may prevent overpopulation and subsequent resource depletion
Explanation: This predatory behavior acts as a natural selection mechanism. By preying on the weakest individuals, wild dogs indirectly improve the overall health and fitness of the prey population. This is an example of how predation can benefit prey species in the long term, despite the immediate harm to individual organisms.

▶️ Answer/Explanation
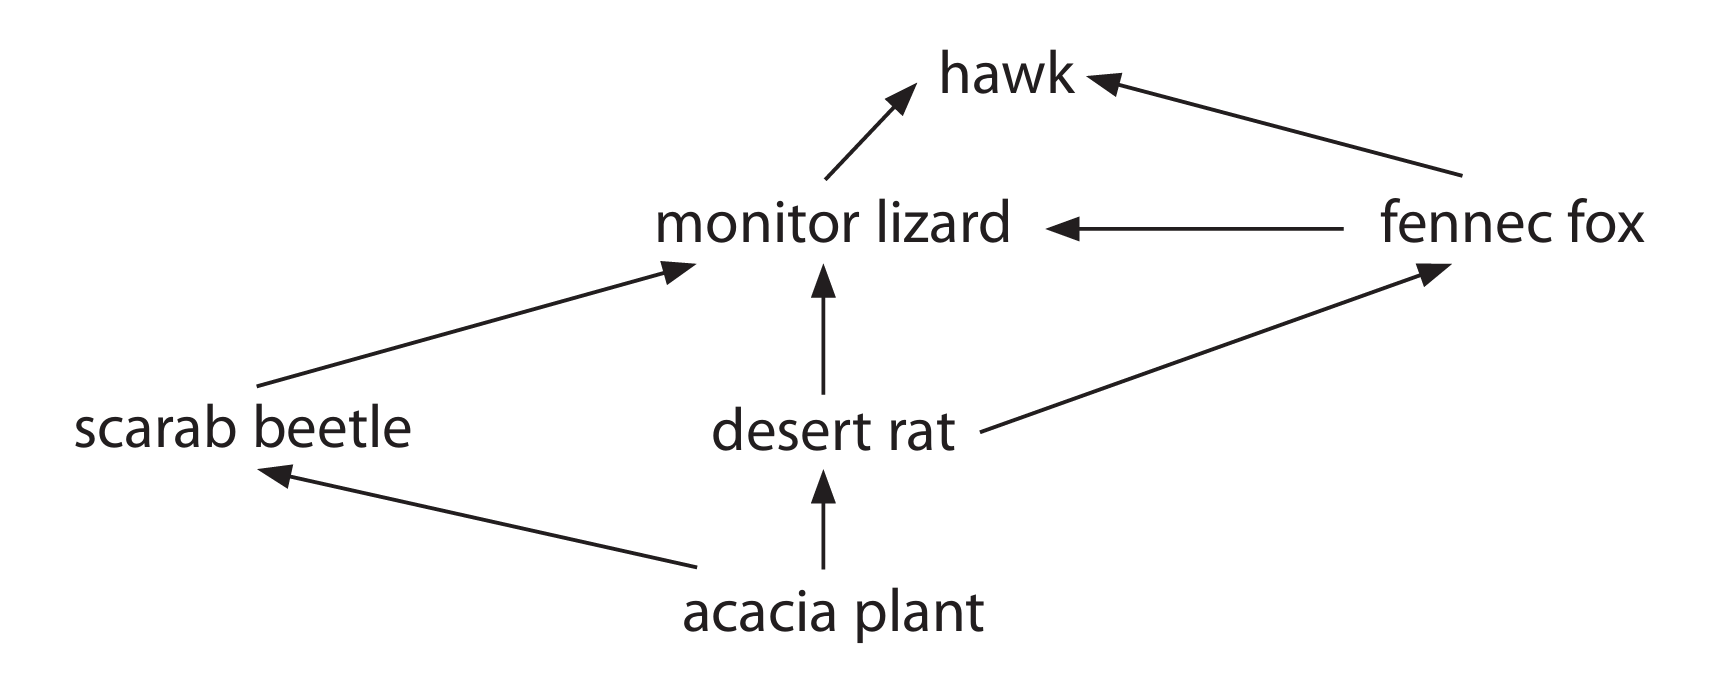
(a)(i) A – 2
Explanation: Secondary consumers are organisms that feed on primary consumers. In this food web, the fennec fox feeds on the desert rat (a primary consumer), and the monitor lizard feeds on the fennec fox (another primary consumer). Therefore, there are two secondary consumers: the fennec fox and the monitor lizard.
(a)(ii) Acacia plant → desert rat → fennec fox → monitor lizard → hawk
Explanation: This is the longest chain because it includes all the trophic levels from the producer (acacia plant) to the top predator (hawk), involving four transfers of energy.
(a)(iii) Most of the energy from the producers is not transferred to the hawk due to energy losses at each trophic level. These losses occur because:
- Energy is lost through indigestible parts of food that are egested as feces and not absorbed.
- Energy is used for metabolic processes like respiration, movement, and active transport, and is lost as heat.
- Energy is excreted in waste products such as urine.
- Not all parts of organisms are consumed; some may die and decompose without being eaten.
As a result, only about 10% of the energy is transferred from one trophic level to the next, so very little energy from the producers reaches the top consumer.
(b) The body shape of the fennec fox, including its large ears and thin body, has evolved through natural selection:
- Initially, genetic variation existed in the fox population due to random mutations, resulting in some individuals having larger ears and thinner bodies.
- In the hot desert environment, these features provided advantages: large ears have a large surface area for losing excess body heat, helping to keep the fox cool, and a thin body reduces heat retention.
- Individuals with these advantageous traits were more likely to survive in the harsh desert conditions.
- These survivors reproduced and passed on the alleles for these traits to their offspring.
- Over many generations, the frequency of these alleles increased, leading to the evolution of the fennec fox’s current body shape.


▶️ Answer/Explanation
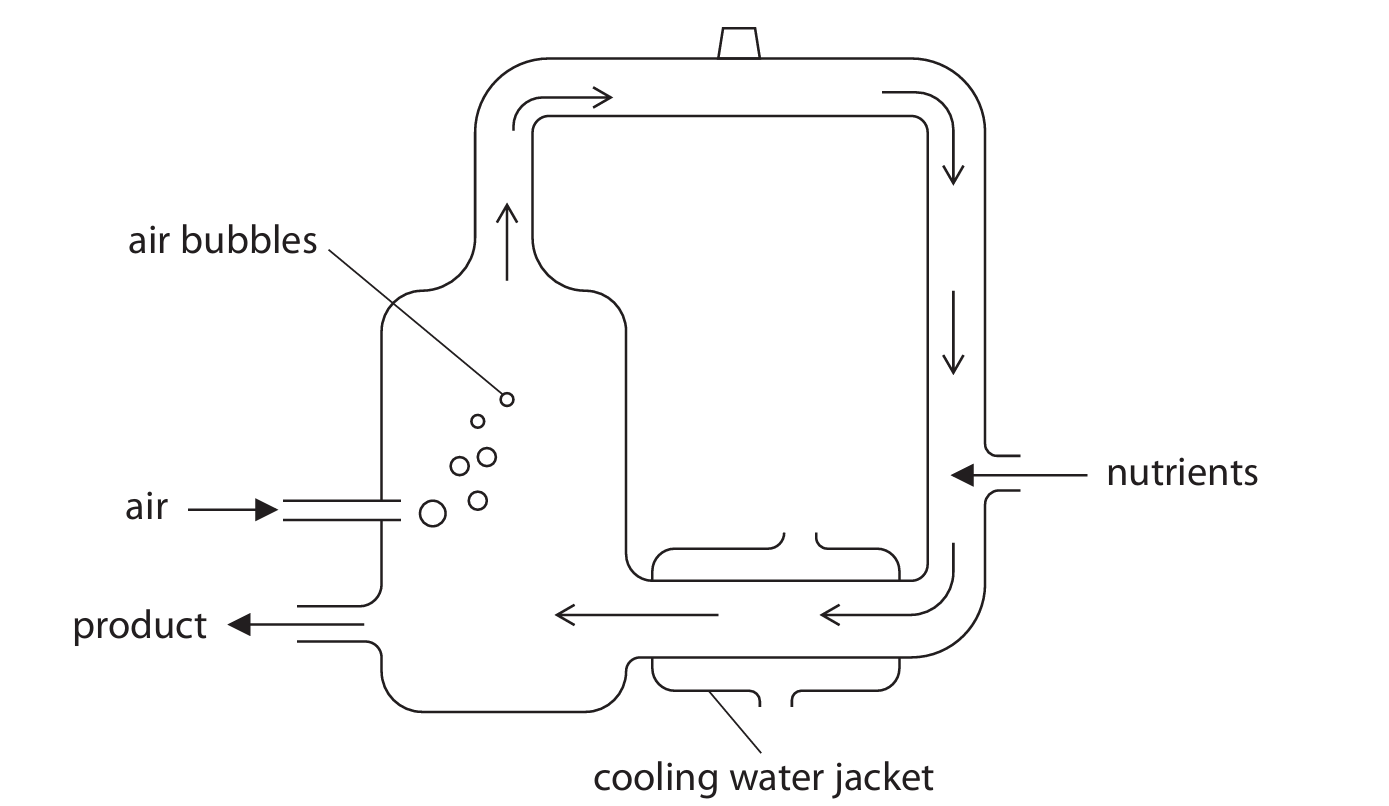
(a)(i) Air is bubbled into the fermenter to provide oxygen. The oxygen is required by the fungus for aerobic respiration. Aerobic respiration is the process that breaks down glucose to release energy, which the fungus needs for growth and to produce mycoprotein. Without a sufficient oxygen supply, the fungus might resort to less efficient anaerobic respiration, which would slow down its growth and reduce the yield of mycoprotein.
(a)(ii) The fermenter is cleaned with steam to sterilize it. Steam cleaning kills any pathogens or other unwanted microorganisms that might be present. This is crucial to prevent contamination of the culture. If other microorganisms were present, they could compete with the fungus for nutrients, potentially produce harmful toxins, or spoil the mycoprotein product, affecting its safety and quality. Steam is used because it is an effective sterilizing agent that, after condensing to water, does not leave behind chemical residues that could affect the product.
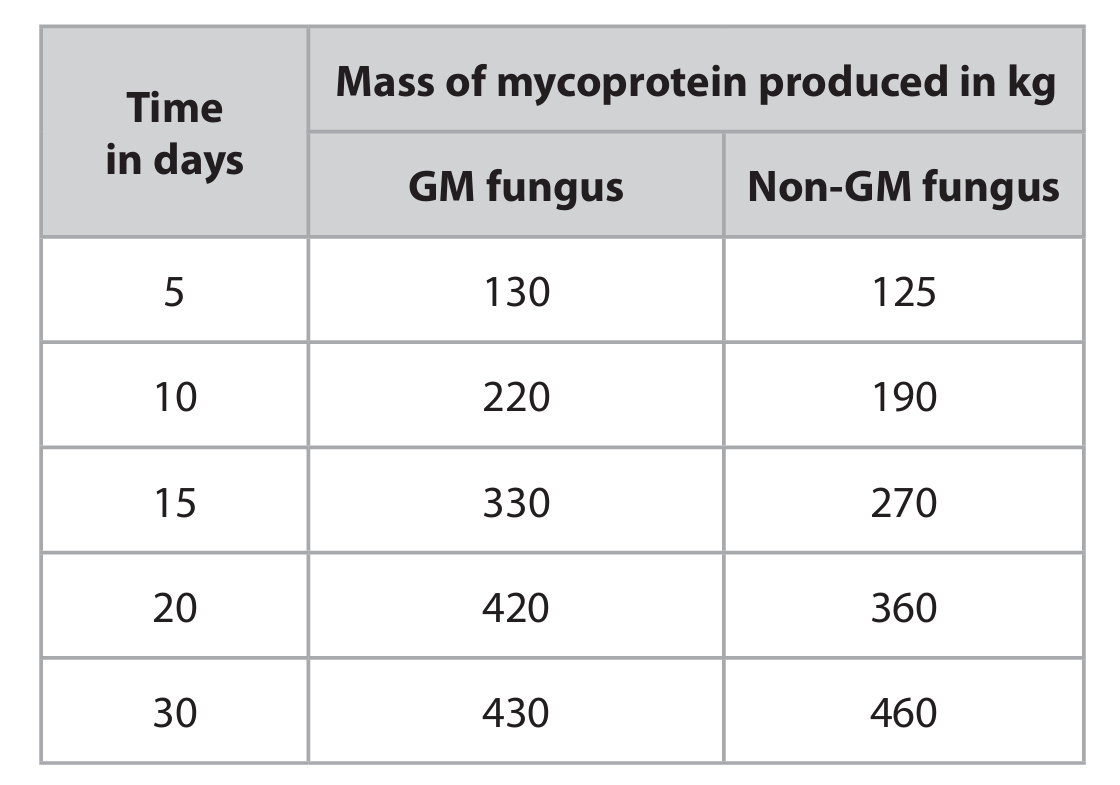
(b)(i) A line graph should be plotted with ‘Time (days)’ on the x-axis and ‘Mass of mycoprotein produced (kg)’ on the y-axis. Two lines should be drawn: one for the GM fungus and one for the non-GM fungus. The points for the GM fungus are (5,130), (10,220), (15,330), (20,420), (30,430). The points for the non-GM fungus are (5,125), (10,190), (15,270), (20,360), (30,460). These points should be joined with straight lines. A key must be included to distinguish between the two lines.
(b)(ii) The scientist’s claim is only partially supported by the data. The GM fungus does grow faster and produce more mycoprotein in the first 20 days (420 kg vs 360 kg), which could be advantageous for large-scale production if a quick yield is desired. However, by day 30, the non-GM fungus has produced a higher final yield (460 kg vs 430 kg). Furthermore, the GM fungus’s production appears to be leveling off or slowing down significantly after day 20, while the non-GM fungus is still increasing. Therefore, whether the GM fungus is “better” depends on the specific production goals: it is better for a shorter, faster production cycle, but the non-GM fungus is better for maximizing the total yield over a longer period.
(b)(iii) Whether mycoprotein is healthier than lamb for a growing human involves a trade-off between different nutritional components.
Arguments for mycoprotein being healthier:
- Mycoprotein contains significantly less fat (3.0g vs 25.5g per 100g) and no cholesterol (0.0g vs 0.1g). A diet lower in saturated fats and cholesterol is associated with a reduced risk of obesity and heart disease.
- Mycoprotein contains much more fibre (6.0g vs 0.7g). Fibre is essential for healthy digestion, preventing constipation, and may help reduce the risk of bowel cancer.
- Mycoprotein contains more calcium (0.048g vs 0.010g). Calcium is vital for the development of strong bones and teeth in a growing human.
Arguments against mycoprotein being healthier:
- Lamb contains almost twice as much protein (20.2g vs 10.5g). Protein is crucial for growth, muscle development, and repair of tissues, which are all very important for a growing individual.
- Lamb contains significantly more iron (0.0025g vs 0.00039g). Iron is essential for producing haemoglobin and preventing anaemia, which can cause fatigue and impair development.
Conclusion: Mycoprotein offers advantages for long-term cardiovascular and digestive health due to its low fat and high fibre content. However, for a growing human who has high requirements for protein and iron to support rapid growth and development, lamb provides these key nutrients in much greater quantities. Therefore, a balanced diet incorporating both sources might be most beneficial, or mycoprotein would need to be consumed in much larger quantities or fortified to meet the protein and iron needs of a growing human.
▶️ Answer/Explanation
Investigation Design:
To investigate whether light intensity affects the speed at which woodlice move, I would set up the following experiment:
Apparatus: I would need a choice chamber with two compartments, a lamp to create different light intensities, a ruler, a stopwatch, woodlice of the same species and similar size, and materials to control other variables like humidity.
Method:
- I would place several woodlice (e.g., 10) in the choice chamber and allow them to acclimatize for 5 minutes.
- I would set up the lamp at different distances (e.g., 10 cm, 20 cm, 30 cm) from one side of the chamber to create varying light intensities, while keeping the other side dark.
- For each light intensity, I would measure how quickly the woodlice move from one point to another. I could do this by marking a start line and finish line in the chamber and timing how long it takes each woodlouse to cross a certain distance (e.g., 10 cm).
- I would repeat each test at least three times to ensure reliability and calculate mean speeds.
- I would control other variables by maintaining constant temperature, humidity, and using woodlice of the same species and size.
- I would record my results in a table showing light intensity (distance from lamp) and average speed of movement.
Expected Analysis: If light intensity affects movement speed, I would expect to see faster movement in darker conditions (as woodlice prefer dark environments) and slower movement in brighter light. I could plot a graph of light intensity vs. speed to visualize any relationship.
Safety Considerations: I would handle the woodlice gently to avoid harming them and ensure the lamp doesn’t overheat the chamber.
▶️ Answer/Explanation
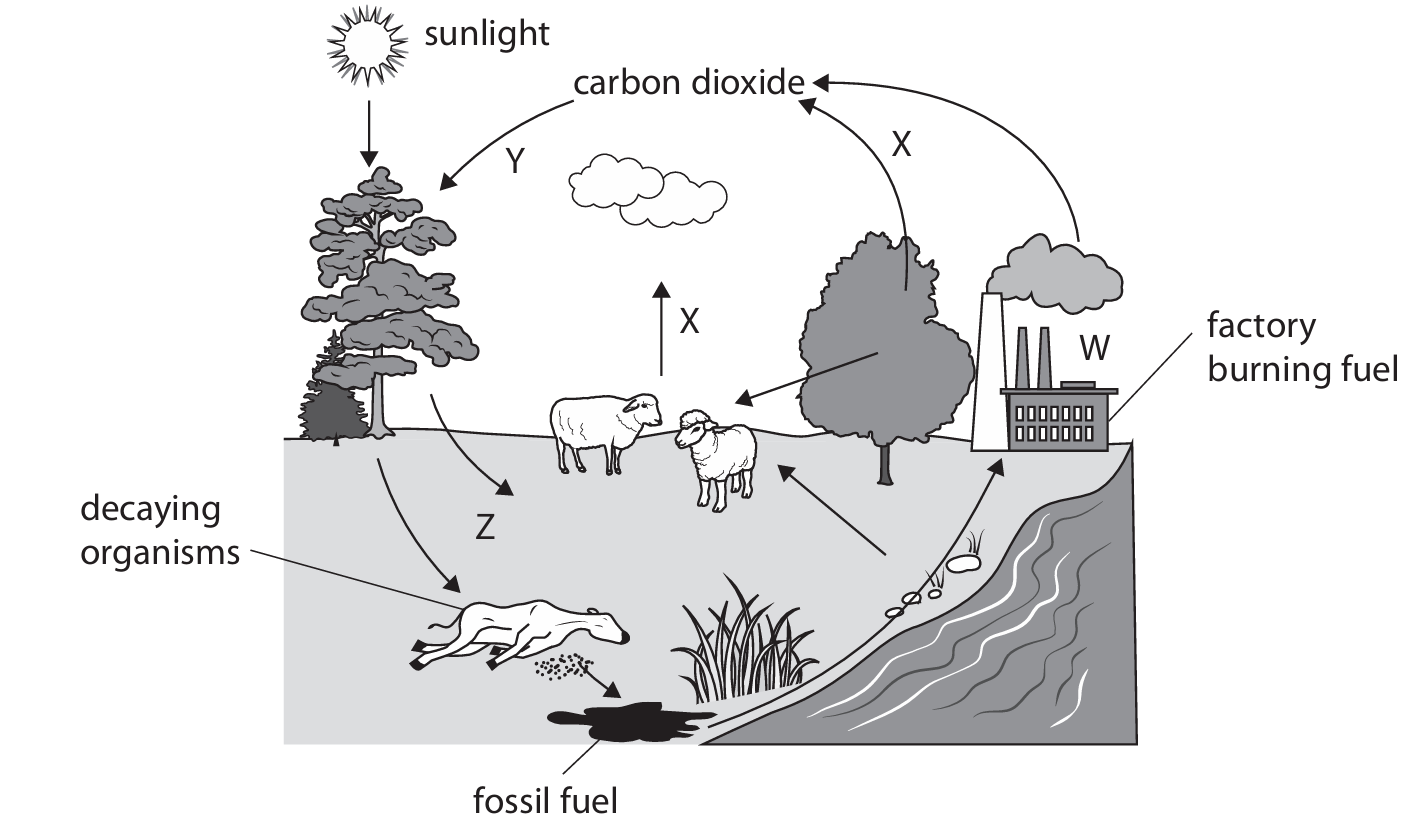
(a) Carbon cycle.
Explanation: The diagram depicts the movement of carbon between the atmosphere, organisms, and the Earth, which is the fundamental process of the carbon cycle. Carbon is exchanged between reservoirs such as the atmosphere (as CO2), living organisms, fossil fuels, and decomposing matter.
(b)(i) A (combustion)
Explanation: The letter W points to the process where a factory is burning fuel. This is a classic representation of combustion, a process where organic material (like fossil fuels) is burned, reacting with oxygen to release carbon dioxide back into the atmosphere.
(b)(ii) D (respiration)
Explanation: The letter X is likely pointing from the decaying organisms or the general biosphere to the CO2 in the atmosphere. This represents respiration, the process by which living organisms (including decomposers) break down organic molecules to release energy, producing carbon dioxide as a waste product.
(c) Bacteria or Fungi.
Explanation: Decomposition is primarily carried out by saprophytic organisms. The two main groups responsible are bacteria (microscopic prokaryotes) and fungi (like mushrooms and moulds). These organisms secrete enzymes that break down complex organic matter in dead plants and animals into simpler substances.
(d) Investigation Design:
Hypothesis: Changing the pH of organic material will affect the rate of decomposition.
Variables:
- Independent Variable: The pH of the organic material environment. This will be changed by adding different buffers, acids, or alkalis to separate samples.
- Dependent Variable: The rate of decomposition. This can be measured by the change in mass of the organic material over a fixed period (e.g., one week) or by the volume of carbon dioxide produced.
- Control Variables (to be kept constant):
- Type and mass of organic material: Use the same plant material (e.g., 10g of chopped lettuce leaves) for all samples.
- Temperature: Incubate all samples in an incubator or water bath at a constant temperature (e.g., 25°C).
- Moisture level: Ensure all samples have the same amount of water.
- Oxygen availability: Use containers that allow air exchange or seal them if investigating anaerobic decomposition.
- Time: Measure the change after the same duration for all samples.
- Microorganism population: Ideally, add a standardised amount of decomposer inoculum (e.g., soil extract) to each sample to ensure a similar starting population of bacteria/fungi.
Method:
- Prepare several identical containers (e.g., conical flasks).
- Add equal masses of the same organic material to each container.
- Prepare solutions at different pH values (e.g., pH 3, pH 5, pH 7 (neutral control), pH 9, pH 11) using buffers.
- Add the same volume of a different pH solution to each container, ensuring the organic material is moistened.
- Add a standard amount of decomposer inoculum (e.g., 1 cm³ of soil suspension) to each container.
- Seal the containers with a bung holding a tube leading to a gas syringe (to measure CO2) or use cotton wool plugs to allow air exchange if measuring mass loss.
- Place all containers in the same constant temperature environment.
- If measuring mass loss, weigh each container at the start and then after a fixed period (e.g., 7 days). Calculate the percentage mass loss for each pH. If measuring CO2, record the volume in the gas syringe at regular intervals.
- Repeat the entire experiment to ensure reliability.
Expected Analysis: Plot a graph of rate of decomposition (mass loss or CO2 production) against pH. This will show if there is an optimal pH for decomposition (likely near neutral for most soil bacteria) and how acidic or alkaline conditions slow it down.


▶️ Answer/Explanation
(a) C it is specific
Explanation: Biological control uses natural predators or parasites to target specific pests, unlike broad-spectrum chemical pesticides that can harm beneficial insects and other non-target organisms. This specificity reduces environmental impact and helps maintain ecological balance in the farming ecosystem.
(b)(i)
1. Sucrose/sugars
2. Amino acids
Explanation: Aphids feed directly on the phloem sap, which is rich in sugars (like sucrose) produced during photosynthesis, and amino acids, which are the building blocks of proteins. These compounds are transported throughout the plant via the phloem to support growth and storage.
(b)(ii)
Explanation: When aphids feed on phloem sap, they directly remove vital nutrients—sugars and amino acids—that the plant needs for energy and growth. This loss reduces the plant’s ability to perform essential functions. With less sugar available, respiration (the process of releasing energy) is compromised, leading to reduced ATP production. This energy deficit hinders active transport, limiting the plant’s uptake of minerals from the soil. Consequently, the plant experiences stunted growth, produces smaller leaves, tubers, fruits, or grains, and may store less starch and protein. In severe cases, the loss of nutrients can even reduce the rate of photosynthesis itself. Additionally, aphid feeding can weaken the plant and make it more susceptible to diseases, further reducing crop yield.
(c)
Explanation: The scientists’ conclusion that hoverflies are the most effective biological control agent is supported by the graph data, which shows that hoverfly larvae consume more aphids per day than silverfly larvae at all three temperatures tested (12°C, 15°C, and 18°C). This higher consumption rate means fewer hoverflies would be needed to control an aphid population, making them a potentially more efficient option. The difference in consumption is most pronounced at the lowest temperature (12°C), where hoverflies eat roughly three times more aphids, suggesting they might be particularly useful in cooler conditions.
However, the conclusion may not be entirely conclusive due to limitations in the method. The experiment used only a single larva per container, which is a very small sample size. To improve reliability, the experiment should be repeated with many more larvae to calculate a more robust average and account for individual variation. Furthermore, the controlled laboratory environment does not fully replicate field conditions, where factors like wind, rain, predators of the control agents themselves, and the spatial distribution of aphids could significantly influence feeding behavior. The study also only compared two species; other effective natural predators of aphids, like ladybugs or lacewings, were not included in the comparison. Therefore, while the data suggests hoverflies are promising, more extensive field trials and comparisons with other agents are needed to firmly establish them as the most effective option.


▶️ Answer/Explanation
(a)(i) A (beaver)
Explanation: Primary consumers are organisms that eat producers (plants). In this food web, grass and aspen trees are producers. The beaver eats these plants, making it a primary consumer. Coyotes and wolves are secondary or tertiary consumers as they eat other animals.
(a)(ii) An ecosystem refers to a community of living organisms (biotic factors) interacting with each other and their physical environment (abiotic factors).
Explanation: An ecosystem isn’t just about the organisms living in an area; it also includes all the non-living components like soil, water, air, and sunlight that they interact with. These interactions create a functional unit where energy flows and nutrients cycle.
(b) The extinction of wolves damaged the ecosystem because it disrupted the natural balance of predator-prey relationships.
Detailed Discussion: Wolves are apex predators that play a crucial role in regulating prey populations. When wolves were removed:
- The elk population likely increased dramatically since their main predator was gone.
- With more elk, there was increased grazing pressure on plants like aspen trees and grass.
- This overgrazing reduced plant populations, which in turn affected other species that depend on these plants for food and habitat.
- Beaver populations decreased because their food sources (trees) were reduced by elk overgrazing.
- With fewer beavers, there were fewer dams and wetland habitats that many species depend on.
- Mouse populations decreased due to reduced plant food sources and possibly increased predation from coyotes (who may have switched prey when wolves disappeared).
- Hawk populations decreased because their prey (mice) became less abundant.
This demonstrates how the removal of a keystone species like the wolf can cause cascading effects throughout an entire ecosystem.
(c)(i) Percentage change = 260%
Calculation:
Population in 1996 ≈ 50 wolves
Population in 2004 ≈ 180 wolves
Change = 180 – 50 = 130 wolves
Percentage change = (130 ÷ 50) × 100 = 260%
This shows the wolf population increased by 260% over this 8-year period following reintroduction.
(c)(ii) The wolf population likely changed between 2004 and 2012 due to factors like limited food availability, disease, competition, or habitat constraints.
Explanation: After the initial rapid growth, the population likely reached carrying capacity – the maximum number of wolves the ecosystem can support. Factors that may have caused fluctuations include:
- Prey populations (elk, etc.) decreasing due to predation pressure
- Disease outbreaks that spread through the wolf population
- Increased competition for territory and resources as the population grew
- Human activities like hunting or habitat disturbance
These factors typically cause predator populations to stabilize or fluctuate after an initial colonization period.
(c)(iii) The population size of a plant species could be determined using quadrat sampling.
Method Description:
- Place quadrats (square frames of known area) randomly throughout the study area
- Count the number of individuals of the target plant species within each quadrat
- Calculate the average number of plants per quadrat
- Multiply this average by the total number of quadrats that would fit in the entire study area to estimate the total population
- Repeat the process multiple times to improve accuracy
This method provides a reliable estimate of plant population size without having to count every individual plant across large areas.


▶️ Answer/Explanation
(a) (i)
1 light (intensity)
2 water volume
Explanation: The student controls several abiotic (non-living) factors to ensure a fair test. The lamp provides a controlled light intensity, which is crucial for photosynthesis. The student also controls the volume of water added each day, ensuring that water availability, another key factor for plant growth, is consistent and not a variable affecting the results.
(a) (ii)
Explanation: Using dry mass is important because the water content in living seedlings can vary significantly. If fresh (wet) mass were measured, some seedlings might be heavier simply because they absorbed more water, not because they have more actual plant biomass (the organic matter like cellulose, proteins, and starch). Drying the seedlings in an oven removes all the water, leaving only the dry biomass. This allows for a valid and fair comparison of the true growth (increase in organic material) between the seedlings grown with and without fertiliser.
(b) (i)
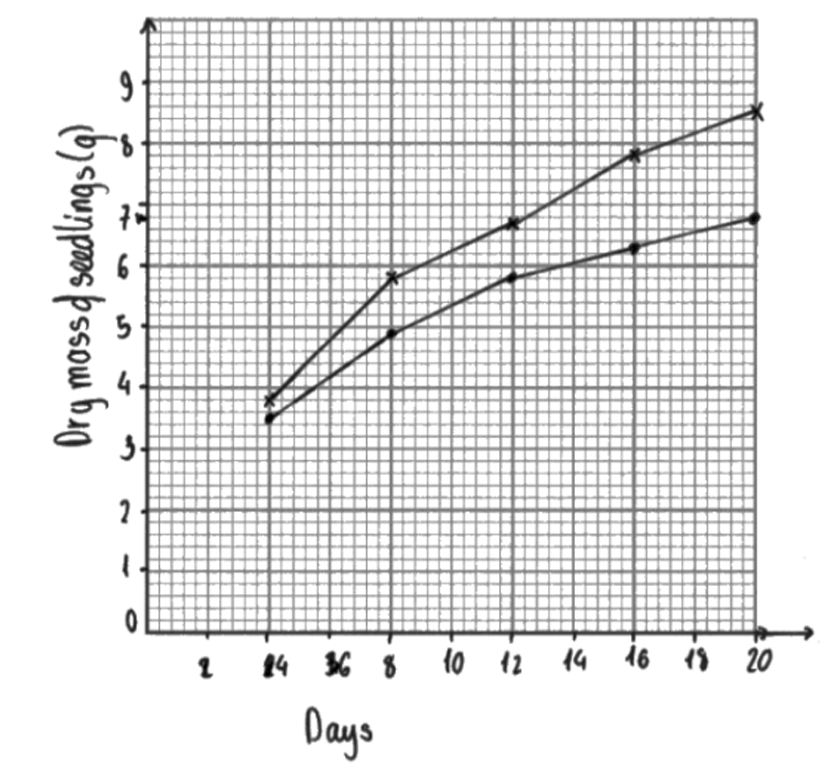
- Axes: The x-axis should be labelled “Day” and the y-axis “Dry mass (g)”.
- Scales: The scales should be linear and use at least half the grid provided.
- Points: Two sets of points should be plotted accurately using the data from the table.
- Lines: Straight lines should be drawn with a ruler to connect the points for each data set (with fertiliser and without fertiliser).
- Key: A key should be included to identify which line represents “With fertiliser” and which represents “Without fertiliser”.
Explanation: The graph would visually demonstrate that the dry mass increases over time for both sets of seedlings, but the increase is consistently greater for the seedlings that received fertiliser. The lines would show a positive correlation between time and dry mass, with the line for ‘with fertiliser’ having a steeper gradient, indicating a faster growth rate.
(b) (ii)
Explanation: The magnesium ions (\( \text{Mg}^{2+} \)) and nitrate ions (\( \text{NO}_3^{-} \)) in the fertiliser are essential mineral ions that significantly promote plant growth.
Magnesium ions are a key component of the chlorophyll molecule. Chlorophyll is the green pigment found in chloroplasts that absorbs light energy. By providing more magnesium, the plant can produce more chlorophyll. This leads to a higher rate of photosynthesis, the process where plants use light energy to make carbohydrates (like glucose) from carbon dioxide and water. These carbohydrates provide the energy and building materials for growth.
Nitrate ions are absorbed by the plant roots and are used to synthesise amino acids. Amino acids are the building blocks of proteins. Proteins are vital for growth as they are used to make new cytoplasm and enzymes. Enzymes control all the metabolic reactions in the plant, including the reactions of photosynthesis and respiration, further fuelling growth. Therefore, the presence of nitrates directly supports the production of new plant tissue.
In summary, magnesium boosts the energy-capturing process (photosynthesis), while nitrates provide the raw materials for building new structures (proteins), together resulting in the increased dry mass observed in the seedlings treated with fertiliser.
▶️ Answer/Explanation
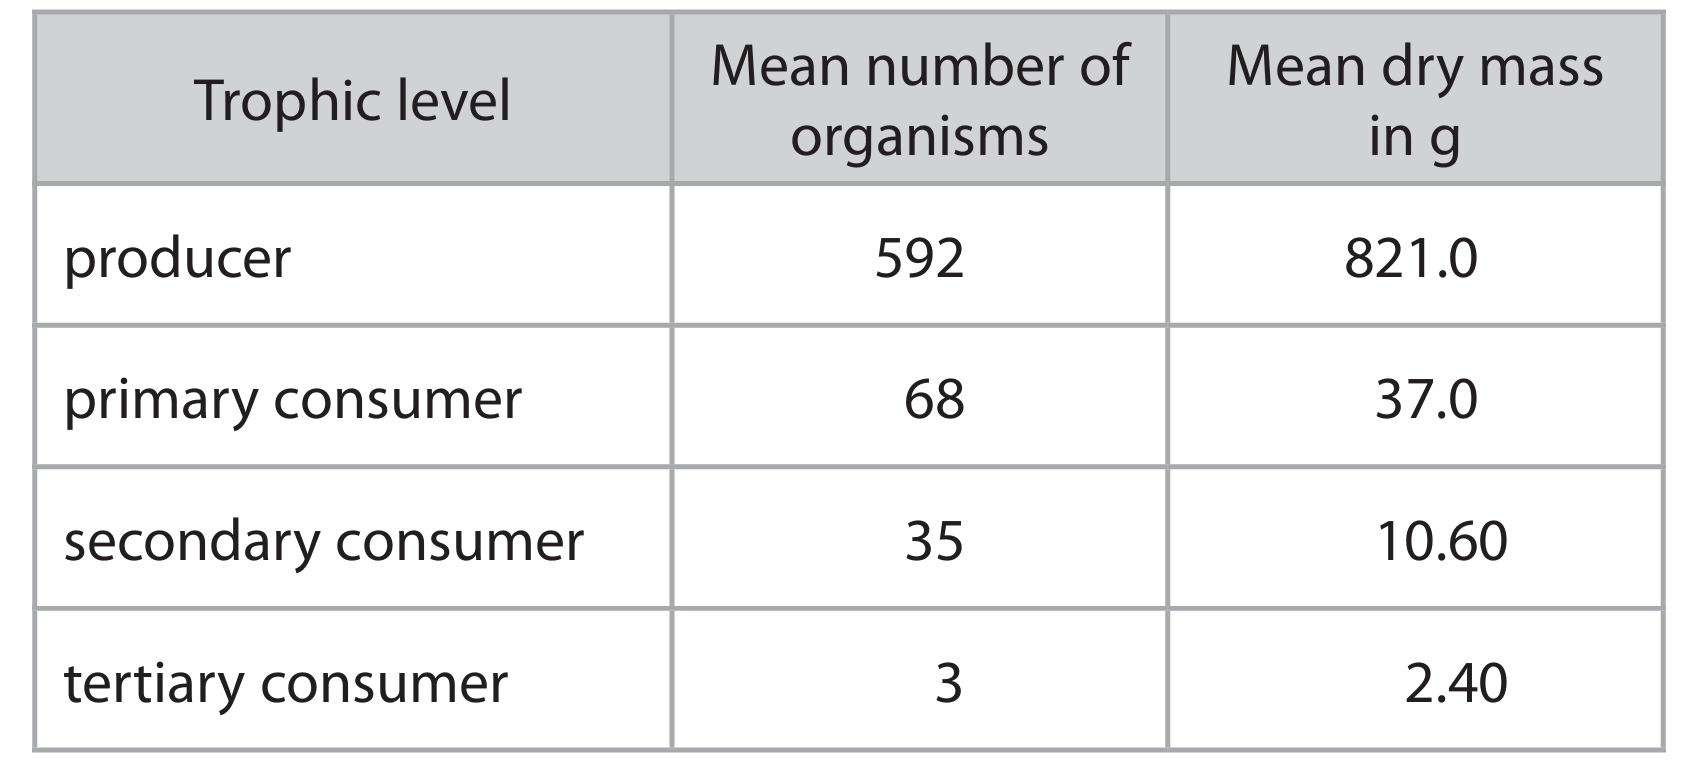
(a)(i)
The pyramid of numbers should have the correct order of trophic levels from bottom to top: producer, primary consumer, secondary consumer, tertiary consumer. The shape should be a pyramid, with the widest bar at the bottom (producers) and the narrowest at the top (tertiary consumers).
Explanation: A pyramid of numbers represents the number of organisms at each trophic level. In this grassland ecosystem, there are 592 producers, 68 primary consumers, 35 secondary consumers, and 3 tertiary consumers per square meter. When drawn, this creates a classic pyramid shape, showing a large base of producers supporting fewer consumers at each successive level.
(a)(ii)
To collect this data, you would:
- Use a quadrat (a square grid) placed randomly in the ecosystem
- Count all the plants (producers) within the quadrat
- Repeat this process multiple times in different random locations
- Calculate the mean number of producers per square meter by adding all the counts and dividing by the number of quadrats used
Explanation: Using a quadrat ensures you’re sampling a consistent area each time. Random placement helps avoid bias in where you sample. Repeating the process multiple times gives you more reliable data. By counting all plants within each quadrat and then calculating the average, you can determine the mean number of producers per square meter in the entire ecosystem.
(b)(i)
Calculation: \( \frac{2.40}{10.60} \times 100 = 22.6\% \)
Explanation: To find the percentage of biomass transferred from secondary to tertiary consumers, we divide the biomass of tertiary consumers (2.40 g) by the biomass of secondary consumers (10.60 g) and multiply by 100. This gives us 22.6%, meaning about 22.6% of the biomass from secondary consumers is transferred to tertiary consumers.
(b)(ii)
The energy transfers in this ecosystem show several important patterns:
- There are fewer organisms and less biomass at higher trophic levels
- Energy is lost at each transfer between trophic levels
- The largest energy loss occurs between producers and primary consumers (only 4.5% transferred)
- Energy is lost through various processes including:
- Respiration and heat production
- Undigested material (e.g., cellulose in plant cell walls)
- Organisms that aren’t eaten
- Excretion
- Death and decomposition
Explanation: Energy transfers in ecosystems are inefficient. Only a small percentage of energy moves from one trophic level to the next. The data shows this clearly – while there are 592 producers with 821.0 g of biomass, this supports only 68 primary consumers with 37.0 g of biomass, representing just 4.5% transfer. The transfer from secondary to tertiary consumers is higher at 22.6%, but the absolute amounts are much smaller. These energy losses occur because organisms use most of the energy they consume for their own life processes like movement, growth, and reproduction, with only a small portion being stored as biomass available to the next trophic level.

▶️ Answer/Explanation
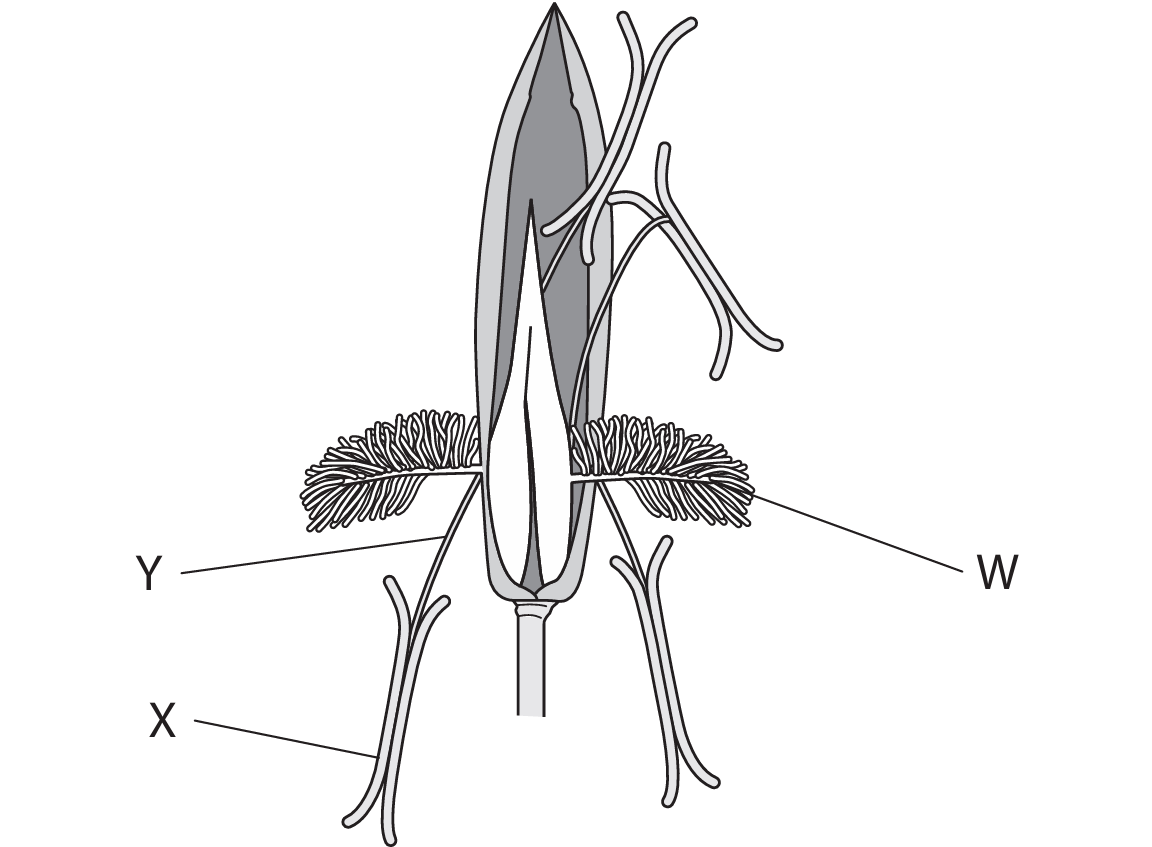
(a)(i)
Answer:
- W or stigma / feathery / large surface area / W stigma outside flower / exposed (to catch pollen)
- X or anther outside flower / exposed (to disperse pollen)
- Y or filament long / hinged / not rigid / can move (to disperse pollen)
Explanation: Wind-pollinated flowers have specific adaptations to ensure successful pollination without relying on insects. Structure W is the stigma, which is feathery and has a large surface area to effectively catch pollen grains floating in the air. It is positioned outside the flower to maximize exposure to wind-borne pollen. Structure X is the anther, which is also exposed outside the flower to allow pollen to be easily released and carried away by the wind. Structure Y is the filament, which is long and often hinged or flexible, allowing the anther to move freely in the wind, thereby enhancing pollen dispersal.
(a)(ii)
Answer: Two differences could be:
- Wind-pollinated flowers have smaller / dull / green flowers / petals / no petals
- Wind-pollinated flowers have no nectar / nectary
- Wind-pollinated flowers have no scent
- Wind-pollinated flowers have smaller / lighter / smooth pollen grains / more pollen produced
Explanation: Wind-pollinated flowers and insect-pollinated flowers have evolved different strategies. Wind-pollinated flowers typically have smaller, duller, often green petals, or may even lack petals altogether since they don’t need to attract insects visually. They do not produce nectar because there are no insects to reward, and they lack scent as aroma is unnecessary for attracting pollinators. Their pollen grains are smaller, lighter, and smooth to be easily carried by wind currents, and they produce pollen in much larger quantities to increase the chance of some grains reaching another flower.
(b)
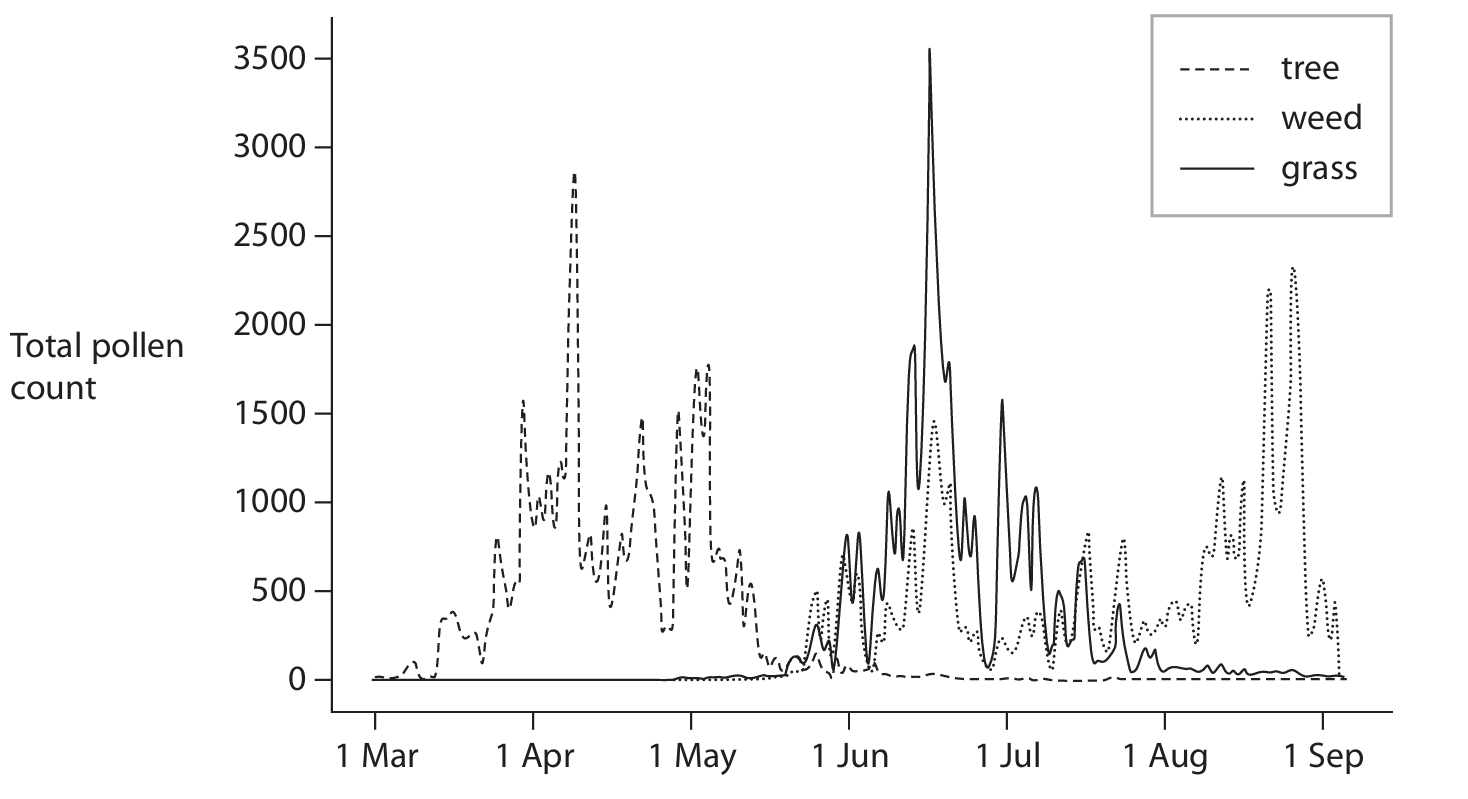
Answer: The discussion should include references such as:
- Link between pollen number and symptoms
- Person A allergic to tree pollen (only)
- Person B allergic to (mainly) grass pollen
- Person B some / mild allergy to tree and weed
- Person C allergic to all pollen / tree and grass and weed
- Person D no pollen allergy
- Person E allergic to (mainly) grass and weed
- Person E some / mild allergy to tree
- No species level data
- Only one year of data
Explanation: By correlating the pollen count graph with the symptom diaries, we can identify likely pollen allergies for each person. Person A experiences severe symptoms in April and May, which coincides with high tree pollen counts, suggesting a specific allergy to tree pollen. Person B has severe symptoms in June and July when grass pollen is highest, indicating a primary allergy to grass pollen, with mild symptoms in other months possibly due to lower levels of tree and weed pollen. Person C suffers from April to September, covering the peaks of all three pollen types, suggesting allergies to tree, grass, and weed pollen. Person D reports no symptoms, indicating no pollen allergies. Person E has severe symptoms from June to September, aligning with high grass and weed pollen, and mild symptoms earlier in the year possibly due to tree pollen. It’s important to note that this data is from only one year and doesn’t identify specific plant species, so conclusions should be considered preliminary.
(c)
Answer: An explanation that includes:
- Response to antigens / pathogen / allergen / bacteria / virus
- By white blood cells / phagocytes / lymphocytes
- Antibodies produced / phagocytosis / engulf
Explanation: An immune response is the body’s sophisticated defense mechanism against foreign substances called antigens, which can include pathogens like bacteria and viruses, or allergens like pollen. This process is primarily carried out by specialized white blood cells. Phagocytes are cells that engulf and destroy foreign particles through a process called phagocytosis. Lymphocytes are another type of white blood cell that produces antibodies – specific proteins that recognize and bind to particular antigens, marking them for destruction. In the case of hay fever, the immune system mistakenly identifies harmless pollen as a threat, triggering this response and causing the uncomfortable symptoms associated with allergies.
▶️ Answer/Explanation
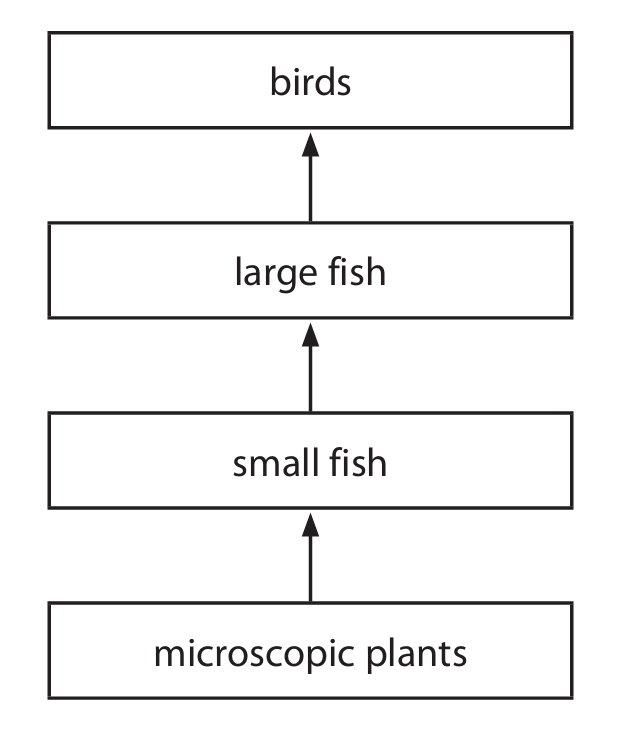
(a) Small fish
Explanation: In a food chain, the primary consumer is the organism that eats the producer. The microscopic plants are the producers in this chain, as they make their own food. The small fish eat these plants, making them the primary consumers.
(b)(i) Photosynthesis
Explanation: The process that converts light energy into chemical energy is called photosynthesis. This occurs in the chloroplasts of plant cells, which contain chlorophyll, a green pigment that absorbs light energy. The plant uses this energy, along with carbon dioxide and water, to produce glucose (a form of chemical energy) and oxygen. The chemical equation for this process is: \[ 6CO_2 + 6H_2O \xrightarrow{\text{light energy}} C_6H_{12}O_6 + 6O_2 \] The glucose produced can then be stored as starch or used for the plant’s energy needs.
(b)(ii)
Explanation: Not all the energy stored in the microscopic plants is transferred to the small fish that eat them. There are several reasons for this. Firstly, a significant amount of energy is used by the plants themselves for their own life processes, such as respiration, which releases energy as heat. Secondly, not all parts of the plant may be eaten or digested by the fish; some material might be egested (passed out as waste). Additionally, some plants may die and decompose without being consumed, and the energy within them is transferred to decomposers instead of the small fish.
(c)
Explanation: Since birds lack teeth, they cannot mechanically break down food in their mouths. The gizzard, a muscular part of their digestive system, acts like a pair of teeth by grinding and crushing the fish. This mechanical breakdown significantly increases the surface area of the food. A larger surface area allows digestive enzymes to work more effectively, speeding up the chemical digestion of proteins and other nutrients in the fish, making them easier to absorb.
▶️ Answer/Explanation
(a)

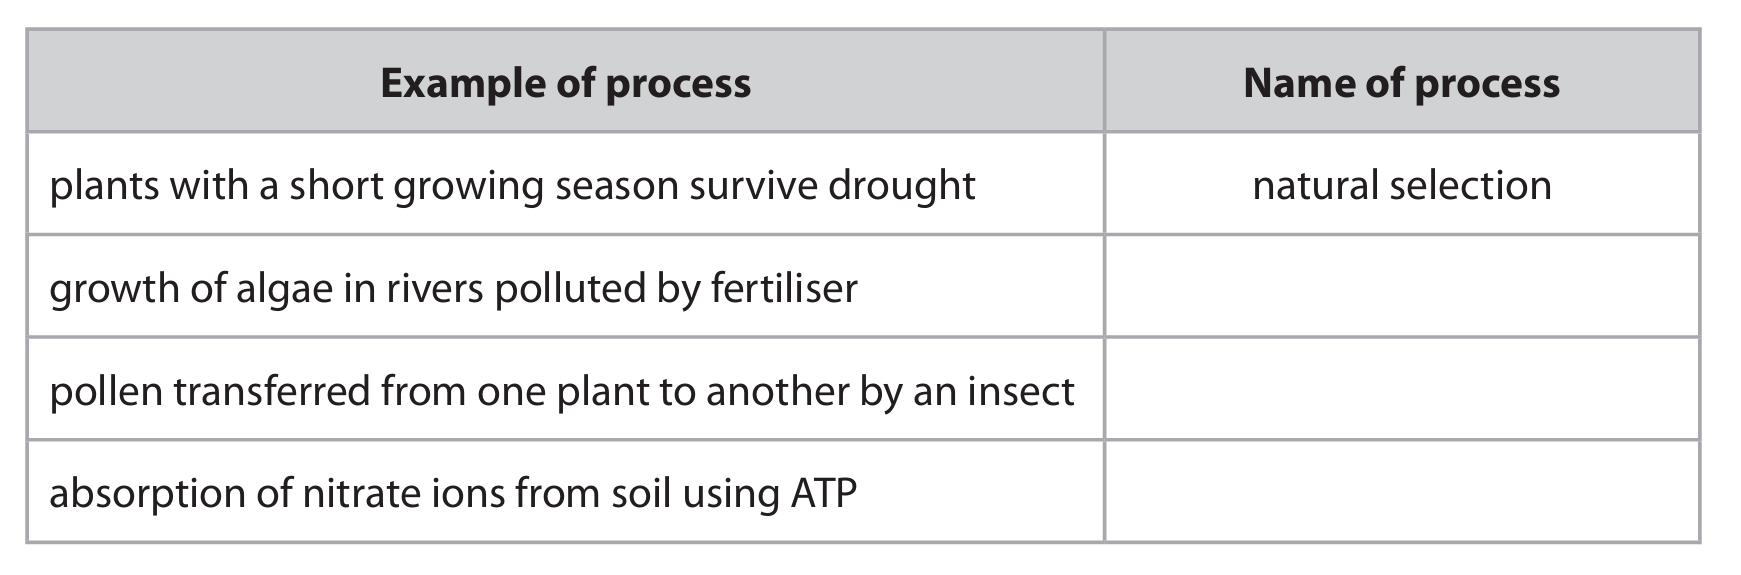
Explanation:
Eutrophication is the process where water bodies become enriched with nutrients (like fertilisers), leading to excessive growth of algae and other aquatic plants. This depletes oxygen in the water, harming other aquatic life.
Insect pollination occurs when insects transfer pollen from the anther of one flower to the stigma of another, facilitating fertilization in plants.
Active transport is the movement of ions or molecules across a cell membrane from a region of lower concentration to a region of higher concentration, requiring energy in the form of ATP.
(b)(i)
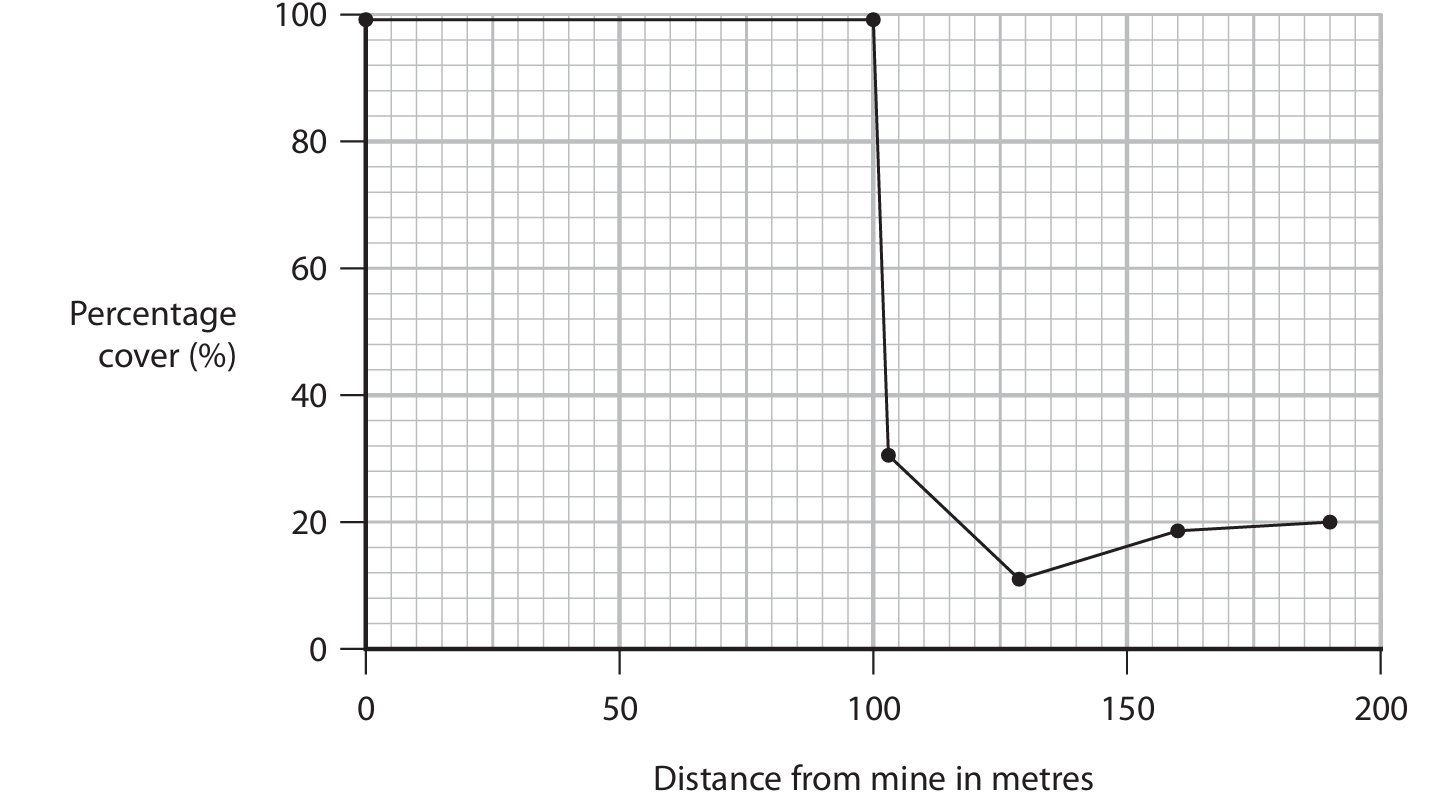
Explanation: Natural selection could explain the pattern seen in the graph between 0-100 meters from the mine through the following mechanism:
Initially, the high zinc concentration near the mine would be toxic to most individual grass plants. However, within the population, there might be genetic variation due to random mutations. A few individual grass plants might possess alleles that make them resistant to zinc toxicity. These resistant individuals would be more likely to survive and reproduce in the zinc-contaminated soil near the mine. They would pass these advantageous resistant alleles to their offspring. Over generations, the proportion of zinc-resistant grass plants in the population near the mine would increase. This results in a population that is better adapted to the high zinc levels, allowing the grass species to have a higher percentage cover closer to the mine (0-100m) than might be initially expected, as seen in the graph. The process involves variation, selection pressure (zinc), survival of the fittest (resistant plants), and inheritance of the resistant trait.
(b)(ii)
Explanation: To compare the population size of the grass species at 50m and 100m from the mine, the scientist could use a systematic sampling method like a belt transect or random quadrat sampling along a line.
First, a measuring tape would be laid out running perpendicular from the mine edge, passing through both the 50m and 100m points. For a belt transect, quadrats (e.g., 1m x 1m squares) would be placed contiguously along the tape between, for example, 45m-55m and 95m-105m to cover each area. Alternatively, for random sampling, multiple random coordinates within a 10m band centered on 50m and another band centered on 100m could be generated, and a quadrat placed at each coordinate.
Within each quadrat, the scientist would estimate the percentage cover of the specific grass species. This is a measure of how much of the ground within the quadrat is occupied by the vertical projection of its leaves and stems. This process would be repeated multiple times (e.g., 10-20 quadrats) at each distance to obtain a representative sample and calculate a mean percentage cover. The mean percentage cover at 50m can then be statistically compared to the mean percentage cover at 100m to determine if there is a significant difference in the population size of the grass species between the two distances.

▶️ Answer/Explanation
(a) An answer that makes reference to the following points:
• Arrows in correct direction (e.g., plants → caterpillars → mice → owls; plants → mice).
• Food web includes all four organisms in correct feeding relationships.
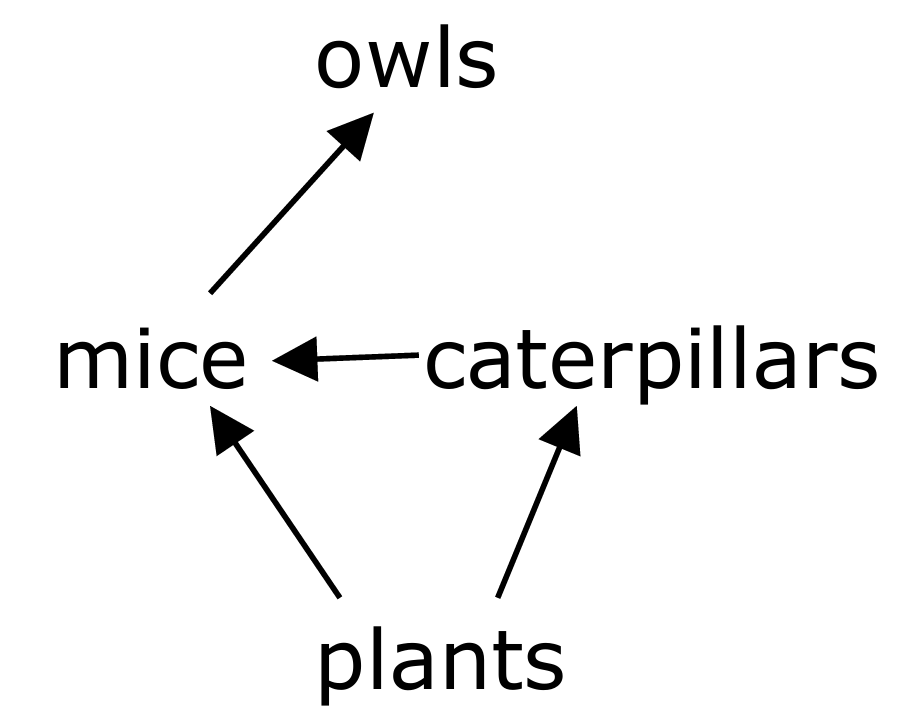
Example web: Plants have arrows to mice and caterpillars. Caterpillars have an arrow to mice. Mice have an arrow to owls.
(b) • Primary consumer / 1° consumer
(c)(i) • \(3 \times 10^3 = 3000\) per \(\text{km}^2\)
• \(3000 \times 5 = 15000\)
Answer: \(15000\) or \(1.5 \times 10^4\) mice.
(c)(ii) An answer that makes reference to three of the following points:
• More food / plants / caterpillars / other sources of food available.
• Warmer weather.
• Fewer other predators / owls ate other species.
• Less disease / infection.
• Higher birth rate than death rate.
(c)(iii) An answer that makes reference to two of the following points:
• Owls feed on other prey (not just mice).
• Insufficient food / energy to maintain more owls (carrying capacity reached).
• Owls have no (or few) predators.
• Birth rate ≈ death rate.
• Owls produce few offspring (so population changes slowly).
(c)(iv) An answer that makes reference to three of the following points:
• Use a trap / use filming / use a sample area / use a quadrat.
• Random sampling.
• Repeat.
• Count number of mice / faeces (in sample area).
• Calculate average.
• Multiply up to total area.

▶️ Answer/Explanation
(a)
Answer: A suitable method involves using quadrats, repeating measurements, and ensuring random sampling.
Detailed Explanation:
To measure the mean number of weeds per square meter, the scientist should follow a systematic sampling approach. First, she should use a quadrat, which is a square frame of a known area (typically 1 m²), to define the sampling area. She should place the quadrat randomly at multiple locations within each field to avoid bias. For example, she could use a random number generator to select coordinates for quadrat placement.
At each location, she should count the number of individual weeds present within the quadrat boundaries. This process should be repeated many times (e.g., 10-20 times per field) to obtain a representative sample of the weed population. The counts from all quadrat placements are then added together to get a total weed count. Finally, to calculate the mean number of weeds per m², she divides the total weed count by the total number of quadrats used. This gives an average value that represents the weed density in the field for that particular month.
(b)
Answer: The conclusion can be discussed by analyzing the data and considering the pros and cons of each method.
Detailed Explanation:
The scientist’s conclusion that biological control is better can be evaluated using the data provided and broader biological principles.
Looking at the data, biological control (BC) shows a more consistent and generally lower mean number of weeds from April onwards (ranging from 3-4 weeds/m²) compared to chemical control (CC), which shows significant fluctuations (e.g., peaks of 20 in May and 18 in July). This suggests that BC provides more stable, long-term suppression. In February, BC started higher (12 vs. 2), but it rapidly decreased and maintained low levels, whereas CC numbers were unpredictable.
Beyond the immediate data, biological control offers several advantages. It is often more sustainable as the introduced insects can reproduce and maintain their population, providing ongoing control without the need for repeated applications. This can be more cost-effective in the long run. Furthermore, biological control is typically more specific, targeting only the weed species and reducing the risk of harming non-target plants, insects, and the wider food web. It also avoids the environmental pollution associated with herbicides, such as chemical runoff into water systems, and reduces the risk of weeds developing herbicide resistance.
However, there are also potential drawbacks to biological control. The introduced insects could potentially become pests themselves if they lack natural predators or start feeding on non-target plant species. The initial establishment of the control agent can also be slower than the immediate action of a herbicide.
In contrast, chemical control, while often acting faster, requires repeated applications, which increases cost and labor. It carries risks of environmental damage, bioaccumulation of toxic chemicals in the food chain, and can lead to the evolution of resistant weed strains.
Therefore, based on the data showing BC’s consistent low weed counts after an initial period and the long-term ecological benefits, the scientist’s conclusion that biological control is a better method is well-supported, particularly for sustainable agriculture.

▶️ Answer/Explanation
(a) C – the organisms of all species in a habitat.
Explanation: A community in ecology refers specifically to all the populations of different species that live and interact together in a particular area or habitat. Option A describes an ecosystem, option B describes a habitat, and option D describes a population.
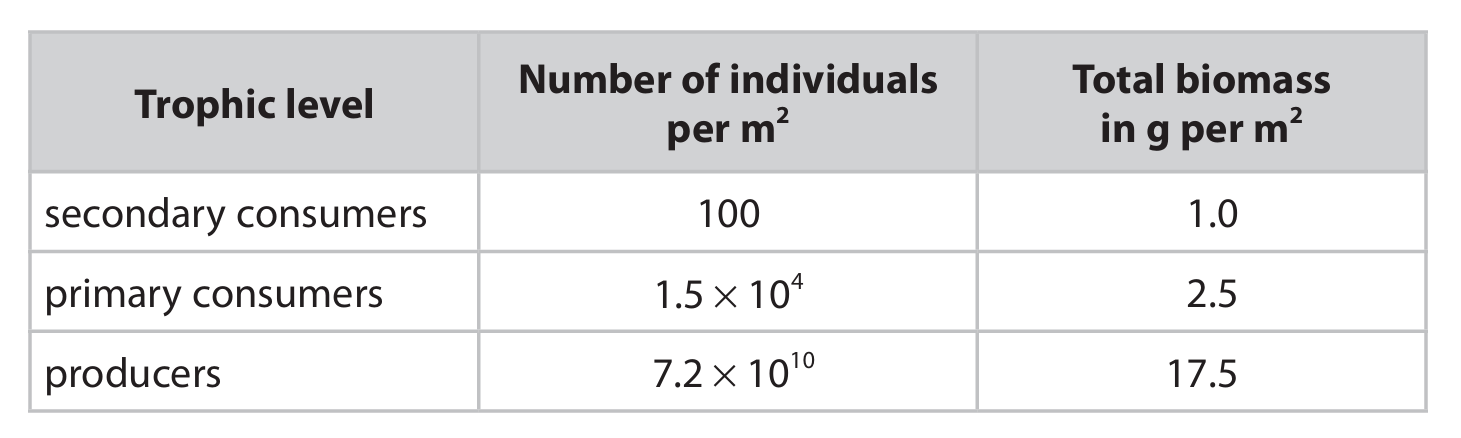
(b)(i) Mean mass = \(1.67 \times 10^{-4}\) g
Explanation: To find the mean mass of a single primary consumer, we divide the total biomass by the total number of individuals. The total biomass for primary consumers is 2.5 g/m², and the number of individuals is \(1.5 \times 10^4\), which is 15,000. The calculation is therefore \(2.5 \div 15,000 = 0.0001667\) g. Converting this to standard form gives \(1.667 \times 10^{-4}\) g. This very small mass makes sense as many primary consumers in a pond, like small aquatic insects or zooplankton, are tiny.
(b)(ii)
Explanation: A pyramid of biomass represents the total dry mass of living organisms at each trophic level. For this pond community, the pyramid should have three horizontal bars, each representing a trophic level. The widest bar at the bottom represents the producers (17.5 g/m²), a narrower bar above represents the primary consumers (2.5 g/m²), and the narrowest bar at the top represents the secondary consumers (1.0 g/m²). This typical pyramid shape shows that biomass decreases at higher trophic levels because energy is lost as it moves up the food chain.
(c)(i)
Explanation: Egestion is the process where undigested food material is expelled from the body as faeces. This undigested material still contains chemical energy that was present in the consumed food. Since this energy is not absorbed and assimilated by the consumer, it is lost from the food chain and is not available to be transferred to the next trophic level. For example, if a primary consumer eats a plant but cannot digest all the cellulose, the energy in that undigested cellulose is egested and lost.
(c)(ii)
1. Respiration. A significant portion of the energy that is assimilated by an organism is used for respiration to fuel life processes like movement, maintaining body temperature, and pumping ions. This energy is converted to heat and lost to the environment, making it unavailable for the next consumer.
2. Excretion. Energy is also lost through the waste products of metabolism, such as urine. These excretory products contain chemical energy that the organism has not utilized.
Other valid reasons include: Uneaten parts (organisms not fully consumed die and decompose), or Death (organisms that die without being eaten).