
Most-appropriate topic codes (Edexcel IGCSE Biology):
- 2(e): Nutrition – Flowering plants — parts (a), (b), (c)
- 2(d): Movement of substances into and out of cells — part (d)
- 2(f): Respiration — parts (b), (d)
- 3(h): Transport – Flowering plants — parts (c), (d)
- Appendix 5: Suggested practical investigations — part (b)
▶️ Answer/Explanation
(a) Energy conversion during photosynthesis:
from light/solar energy to chemical energy
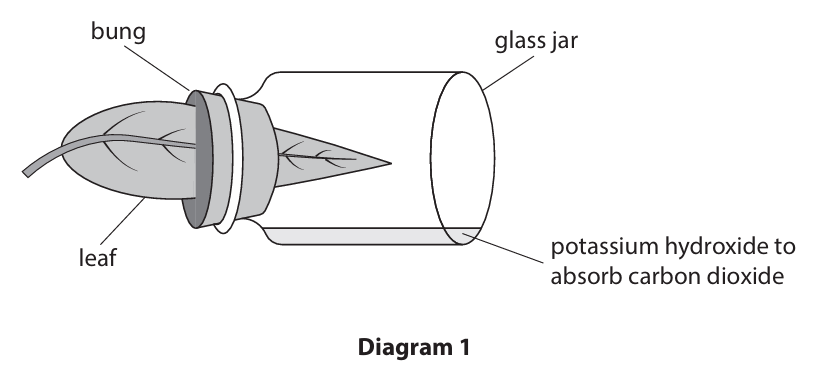
(b)(i) To remove all starch from the plant’s leaves:
• Keep the plant in darkness for 12/24/48 hours
• This allows all starch to be used up in respiration
(b)(ii) Diagram 2 results:
• Left side (outside flask): black/blue/starch present
• Right side (inside flask): yellow/orange/brown/no starch
The part exposed to carbon dioxide (outside flask) tests positive for starch, while the part without carbon dioxide (inside flask) tests negative.
(c) Functions of two named mineral ions:
Nitrate ions: needed for amino acids/proteins/enzymes/DNA
Magnesium ions: needed for chlorophyll/chloroplasts/photosynthesis
Other acceptable pairs:
• Iron: for chlorophyll/chloroplasts/photosynthesis/respiration
• Phosphate: for DNA/ATP/cell membranes
• Calcium: for cell walls/cell membranes
• Potassium: for water balance/enzymes/photosynthesis/respiration
(d) Why plants in waterlogged soil cannot absorb mineral ions:
• Mineral ions are absorbed by active transport
• Waterlogged soil has no/less oxygen
• Therefore, there is no/less respiration
• Resulting in no/less energy/ATP for active transport
Most-appropriate topic codes (Edexcel IGCSE Biology):
- 3(h): Transport — part (a)
- 6(a): Food production — parts (b)(i), (b)(ii)
- 5(d): Human influences on the environment — parts (b)(i), (b)(ii)
- 5(b): Feeding relationships — part (b)(i)
- 2(e): Nutrition — part (a)(ii)
▶️ Answer/Explanation
(a)(i) Two substances carried in the phloem:
1. Sucrose/sugars (1)
2. Amino acids (1)
Marking guidance: ignore glucose; allow water/plant hormones/named plant hormone
(a)(ii) Explanation why insects feeding from phloem reduce crop yield:
An explanation that makes reference to three of the following:
- No/less respiration/no/less energy (1)
- No/less protein (1)
- No/less growth/new cells (1)
- Less fruit production/fewer oranges/smaller fruit (1)
Marking guidance: No credit for less sugar amino acid or glucose; Ignore less crops/less yield
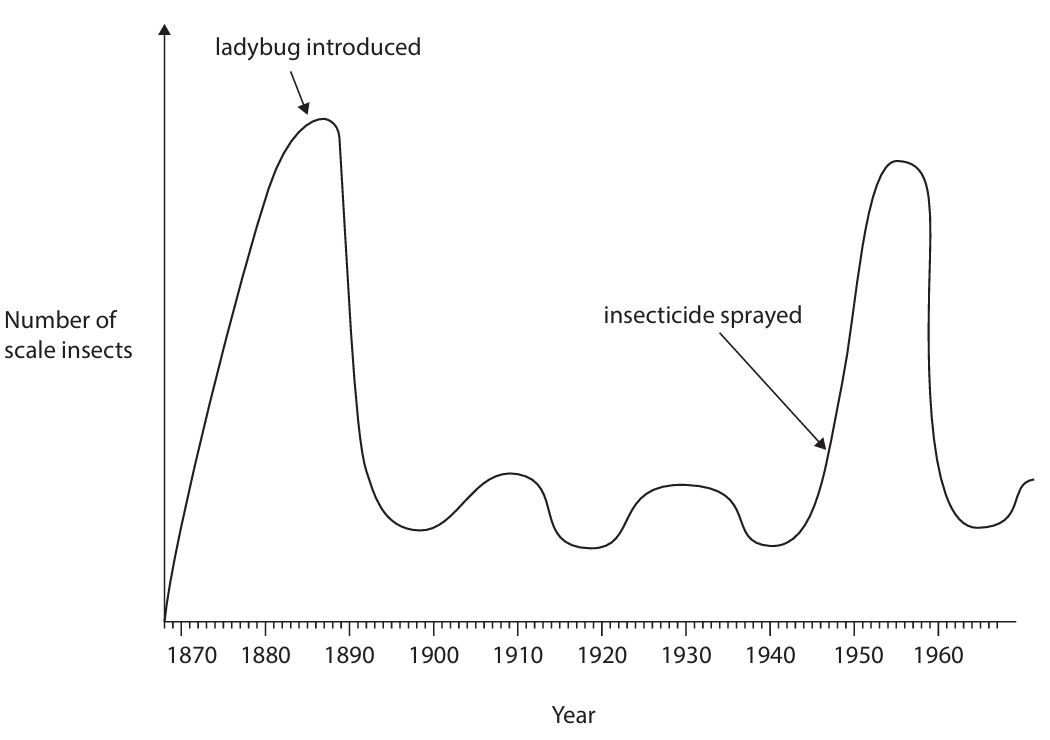
(b)(i) Discussion of effects on scale insect numbers:
An answer that makes reference to five of the following:
- Reduce (quickly/steeply) after ladybug introduced (1)
- As the ladybugs feed on scale/pests (1)
- Scale insects numbers go up and down/fluctuate/oscillate (1)
- Some pests required for ladybugs to feed on/scale insects never completely wiped out (1)
- Insecticide release causes (rapid) increase in scale insects/pests (1)
- As (more) ladybugs killed (than scales/pests) (1)
- Fewer scale insects are eaten/less predation (1)
- Insecticide becomes less effective/disperses/ladybugs recover/ladybugs develop resistance (1)
- Scale insects/pest numbers drop (1)
- Ladybugs/biological control more effective than insecticide/kill more pests (1)
(b)(ii) Three advantages of biological control instead of pesticides:
An explanation that makes reference to four of the following points:
- Lasts longer/does not need reapplication (1)
- Specific/does not affect food chain/other organisms (1)
- No residue on crop/not eaten by humans/does not affect humans (1)
- No bioaccumulation/biomagnification (1)
- Pest does not become resistant (1)
Marking guidance: allow converse; ignore cheaper alone; ignore pollution alone; allow contaminate crops; ignore immune

▶️ Answer/Explanation
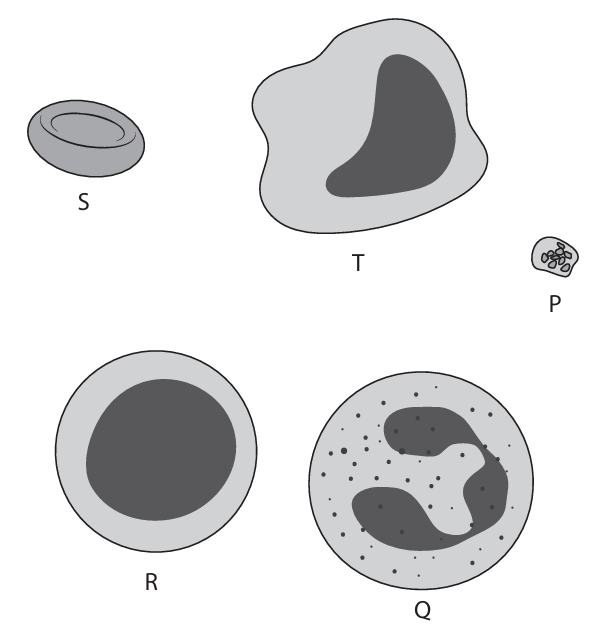
(a)(i) C (S)
A is not the answer as P is a platelet
B is not the answer as Q is a white blood cell
D is not the answer as T is a monocyte
(a)(ii) A (P)
B is not the answer as Q is a white blood cell
C is not the answer as R is a lymphocyte
D is not the answer as T is a monocyte
(a)(iii) C (R)
A is not the answer as P is a platelet
B is not the answer as Q is a white blood cell
D is not the answer as S is red blood cell
(a)(iv) B (iron)
A is not the answer as calcium is not found
C is not the answer as magnesium is not found
D is not the answer as sodium is not found
(b) A description that makes reference to four of the following:
• phagocytes / white blood cells engulf pathogens / bacteria (1)
• phagocytes / white blood cells digest / break down pathogens / bacteria (1)
• lymphocytes / white blood cells produce antibodies (1)
• antibodies are specific to pathogen / antigens / complementary to pathogen (1)
• antibodies attach to pathogens / bacteria / antigens (1)
• (antibodies) cause agglutination / sticking together / bursting (1)
allow ref to memory cells as alternative
(c)(i) Calculation:
\( 5.0 \times 10^{12} \) in one litre / dm³
\( (5.0 \times 10^{12}) \div (1 \times 10^6 \, \text{mm}^3) \)
So \( 5 \times 10^6 \) in 1mm³
and \( 2 \times \text{in } 2 \, \text{mm}^3 \)
\( = 1.0 \times 10^7 \) or \( 1 \times 10^7 \)
(c)(ii) An answer that makes reference to five of the following:
1. no difference in platelets (1)
2. no difference in clotting / scab formation (1)
3. more phagocytes that engulf / digest pathogens / bacteria (1)
4. more lymphocytes that produce antibodies (1)
5. can fight infection / prevent disease / more effective immune system (1)
6. has an infection / bacteria / virus / sepsis (1)
7. too much cell division / mutation / cancer (1)
8. no difference in rbc (1)
9. no difference in oxygen transport / no difference in respiration / not anaemic (1)

▶️ Answer/Explanation
(a)(i) An explanation that makes reference to four of the following points (marked in pairs):
- Artery wall has a thick layer of elastic tissue / more elastic (1) as blood pressure is higher / for the wall to recoil / to expand / to smooth blood flow (1).
- Artery wall has a thick layer of muscle / more muscle (1) to control blood flow (1).
- Artery has no valves (1) as blood pressure is sufficient to prevent backflow (1).
Accept converse statements for veins. Credit thick wall due to high pressure (two marks) if other points are not given.
(a)(ii) An explanation that makes reference to three of the following points:
- The artery in CHD has a blockage / is narrower / has a narrower lumen (1).
- Less blood / less oxygen can flow to the heart muscle (1).
- This leads to less aerobic respiration / more anaerobic respiration (1).
- Less energy / less ATP is produced (1).
- Therefore, the heart is unable to beat faster / contract as effectively during exercise (1).
(b)(i) An answer that makes reference to one of the following:
- High cholesterol / high-fat diet (1)
- Lack of exercise (1)
- Stress (1)
- High salt diet (1)
- High BMI / obesity (1)
- Diabetes (1)
- Age (1)
- Sex (1)
- High blood pressure (1)
Ignore “diet”, “bad diet”, “unbalanced diet” without specific link.
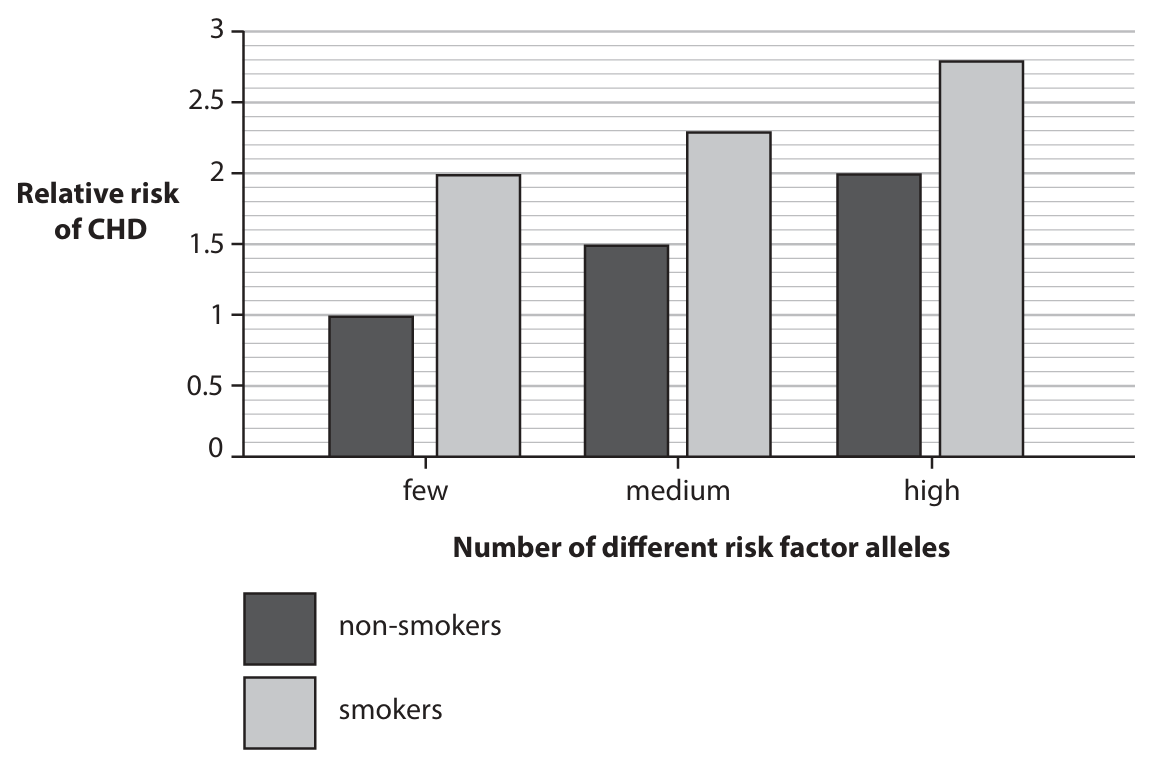
(b)(ii) An answer that makes reference to five of the following points:
- Smoking increases the risk of CHD for all allele groups (1).
- Having more risk factor alleles increases the risk of CHD (1).
- The highest risk is for smokers with a high number of alleles / The lowest risk is for non-smokers with few alleles (1).
- The biggest increase in risk from smoking is seen in those with few risk alleles / The increase from smoking is lower for the medium or high allele groups (1).
- Smokers with few alleles have a similar risk to non-smokers with many alleles (1).
- Credit use of data, e.g., smoking increases risk by approximately 1 for the low allele group (1).
- Carbon monoxide in cigarette smoke contributes to CHD (1).
- Smoking causes plaque / cholesterol build-up / blocks the coronary artery (1).
- Limitation: group size / sample size may be small (1).
- Limitation: other factors like age, sex, diet, frequency of smoking were not considered (1).
Accept: The increase in risk from smoking is similar for medium and high allele groups.

▶️ Answer/Explanation
(a)(i) • limewater / hydrogen carbonate indicator / sodium hydrogen carbonate / sodium bicarbonate / bicarbonate indicator / eq
Explanation: Limewater (calcium hydroxide solution) is a standard test for carbon dioxide, turning cloudy/milky. Hydrogen carbonate indicator is also commonly used, changing color based on \(CO_2\) concentration (e.g., from red to yellow with high \(CO_2\)).
(a)(ii) An explanation that makes reference to three of the following:
• Tube A (inhaled air) stays clear / shows no (significant) change / eq (1)
• Tube B (exhaled air) goes cloudy / milky / turns yellow (if using hydrogen carbonate indicator) / eq (1)
• Because exhaled air has a much higher concentration of carbon dioxide / \(CO_2\) / eq (1)
• The carbon dioxide reacts with the limewater to form insoluble calcium carbonate (which causes the cloudiness) / eq (1)
Explanation: Inhaled air contains approximately 0.04% \(CO_2\), while exhaled air contains about 4% \(CO_2\). The higher \(CO_2\) in exhaled air produces a visible reaction with the indicator solution.
(a)(iii) • (exhaled air is) warmer / has less oxygen / has more water vapour / eq (1)
Explanation: During respiration in the body, energy is released as heat, warming the exhaled air. Also, oxygen is used up, and the air is saturated with water vapour from the moist lining of the respiratory system.
(b)(i) • duration (of exercise) / time / eq (1)
Explanation: The independent variable is the one that is deliberately changed or manipulated by the investigator. Here, it’s the duration of exercise in seconds.
(b)(ii) A line graph that scores marks for:
• Scales linear and covering at least 2 big squares on the y-axis and 3 on the x-axis (1)
• Points correctly plotted within a small square tolerance (1)
• Straight lines drawn connecting all points in order (1)
• Axes correct way round: Duration (s) on x-axis, Breathing rate (breaths/min) on y-axis (1)
• Both axes labelled with correct quantity and unit (1)
Note: A sketch would show a generally increasing trend from 0s to 180s, peaking at 42 breaths/min, then a slight dip and plateau from 210s to 240s at 40 breaths/min.
(b)(iii) A description that includes two of the following:
• Breathing rate increases (with duration) until 180 seconds / up to 42 breaths per minute / eq (1)
• (After 180 seconds) it decreases slightly / from 42 to 40 breaths per minute (between 180 and 210 seconds) / eq (1)
• (After 210 seconds) it then levels out / becomes constant / plateaus at 40 breaths per minute / eq (1)
Explanation: The initial increase is due to the body’s demand for more oxygen and removal of \(CO_2\) during exercise. The slight decrease and plateau may indicate the body reaching a steady state or the subject tiring.
(b)(iv) • repeat (the investigation) / use more students / people / take more readings / eq (1)
Explanation: Repeating the investigation and calculating a mean, or using more subjects, improves reliability by reducing the effect of random errors or individual variation.
▶️ Answer/Explanation
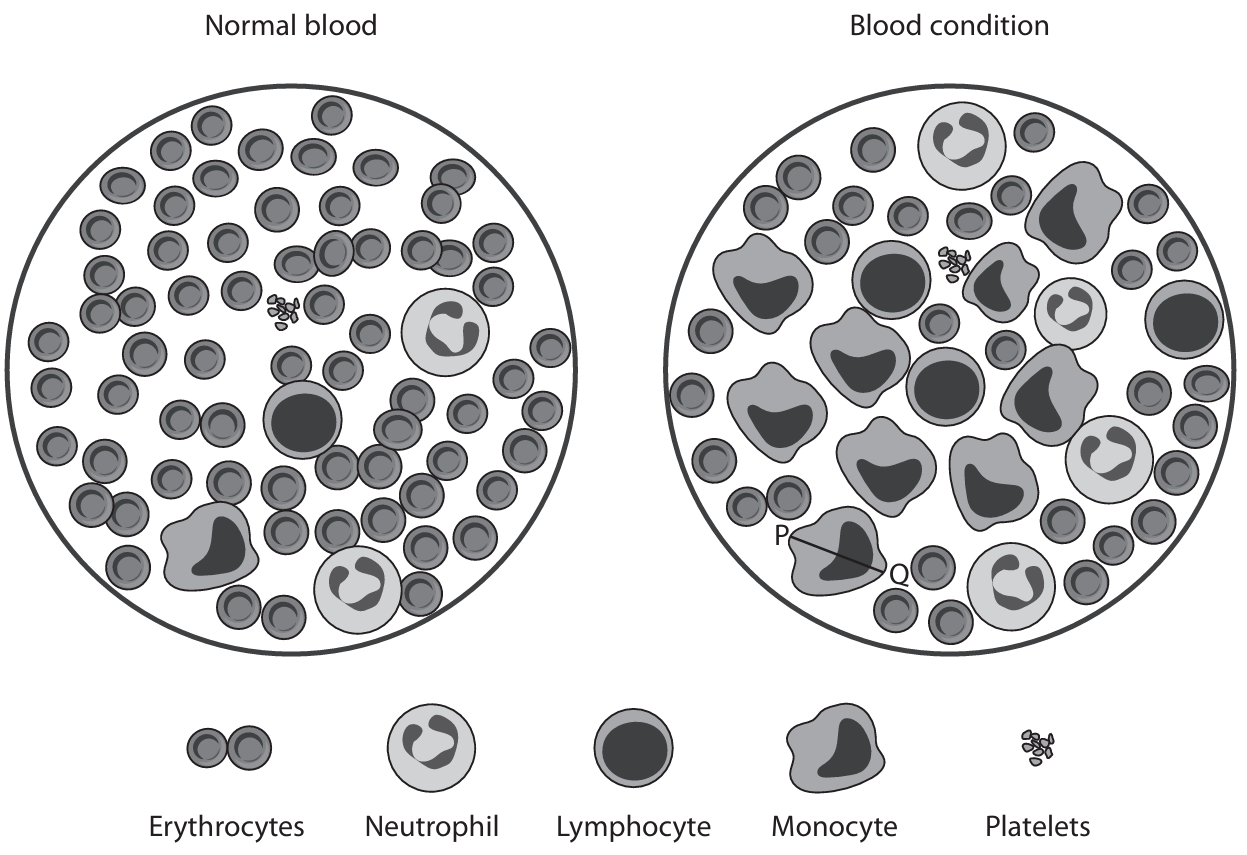
(a) An answer that makes reference to two of the following:
• More red cells / erythrocytes in the blood condition (1).
• Fewer lymphocytes in the blood condition (1).
• Fewer monocytes in the blood condition (1).
• Fewer neutrophils in the blood condition (1).
If no reference to a named white blood cell, allow “fewer white blood cells” for 1 mark.
(b)
• Measure the line P-Q from the diagram (e.g., 14 mm) (1).
• Convert actual length to mm: \( 25 \; \mu m = 25 / 1000 = 0.025 \; mm \).
• Magnification = Image size / Actual size = \( \frac{14}{0.025} \).
• Magnification = \( \times 560 \) (allow range 520–600) (1).
Full working required for full marks.
(c)
• Volume of blood in \( cm^3 \): \( 5.0 \; dm^3 = 5.0 \times 1000 = 5000 \; cm^3 \).
• Number of red blood cells = \( (5.0 \times 10^9) \times 5000 \).
• \( = 2.5 \times 10^{13} \) (2).
Answer must be in standard form.
(d) An answer that makes reference to four of the following logical points, showing cause and effect:
1. Condition shows more red cells, but they may contain less haemoglobin (e.g., in some anaemias) (1).
2. This leads to less oxygen transport (1).
3. Resulting in less energy / ATP production via respiration (1).
4. Causing symptoms like tiredness, shortness of breath, or lactic acid buildup (1).
5. Diagram shows fewer white blood cells (lymphocytes, monocytes, neutrophils), which could mean a reduced immune response (1).
6. Leading to fewer antibodies produced or less phagocytosis (1).
7. Therefore, the patient may be more susceptible to infections (1).
Answers should link the observed differences to physiological effects on the patient.

▶️ Answer/Explanation
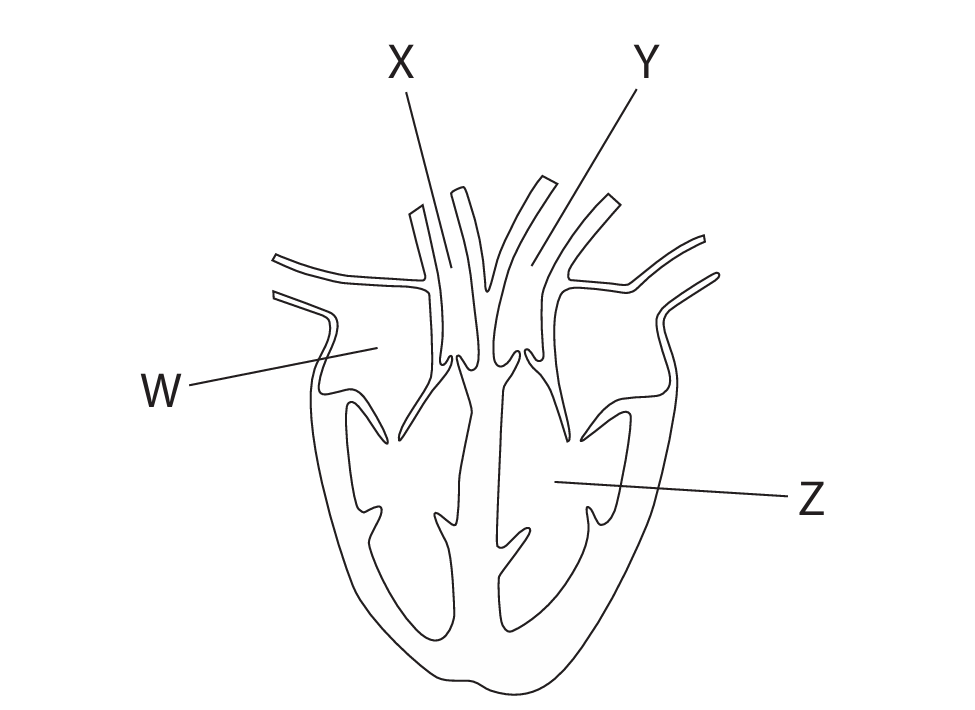
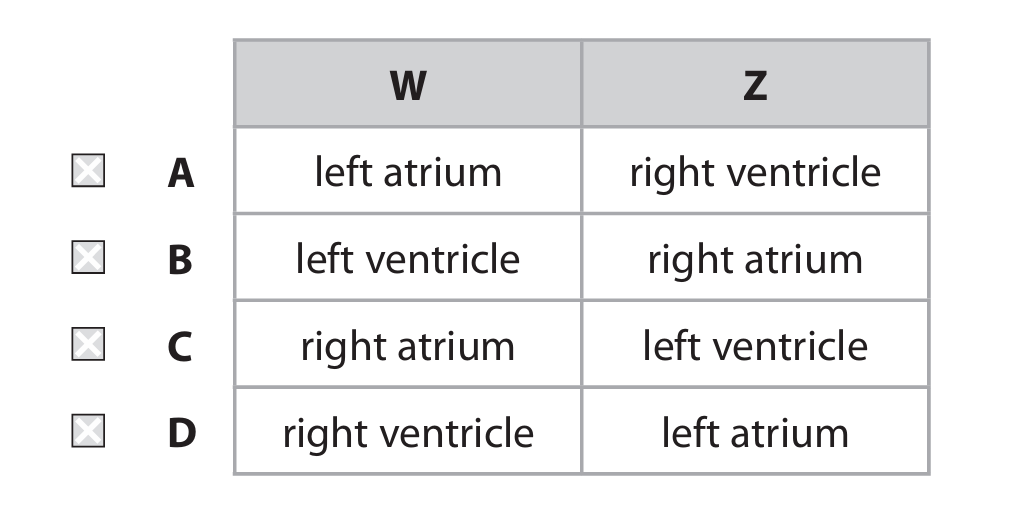
(a)(i) C
Explanation: Chamber W is the right atrium (receives deoxygenated blood from the body via the vena cava) and chamber Z is the left ventricle (pumps oxygenated blood to the body via the aorta). Option A is incorrect because W is not the left atrium. Option B is incorrect because W is not a ventricle. Option D is incorrect because W is not a ventricle.
(a)(ii)
Explanation: Two differences between the blood in vessel X (pulmonary artery) and vessel Y (aorta) are:
- The blood in X (pulmonary artery) is deoxygenated / has a lower oxygen concentration, whereas the blood in Y (aorta) is oxygenated / has a higher oxygen concentration.
- The blood in X (pulmonary artery) has a higher carbon dioxide concentration, whereas the blood in Y (aorta) has a lower carbon dioxide concentration.
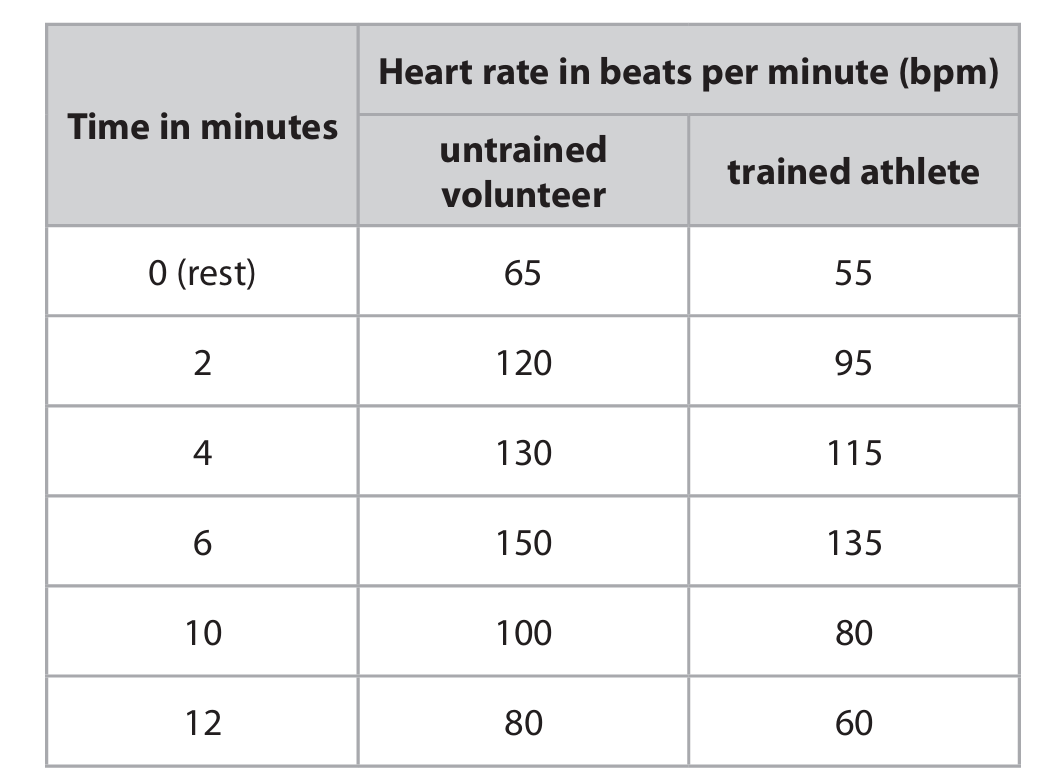
(b)(i) 89 cm³ (to 2 significant figures)
Explanation: The formula given is cardiac output = stroke volume × heart rate. We need to find the stroke volume for the trained athlete at rest. From the table, the trained athlete’s heart rate at rest (0 minutes) is 55 bpm. The cardiac output is given as 4900 cm³ per minute.
Rearranging the formula: stroke volume = cardiac output ÷ heart rate.
So, stroke volume = 4900 cm³/min ÷ 55 beats/min ≈ 89.0909 cm³/beat.
Rounded to two significant figures, the stroke volume is 89 cm³.
(b)(ii)
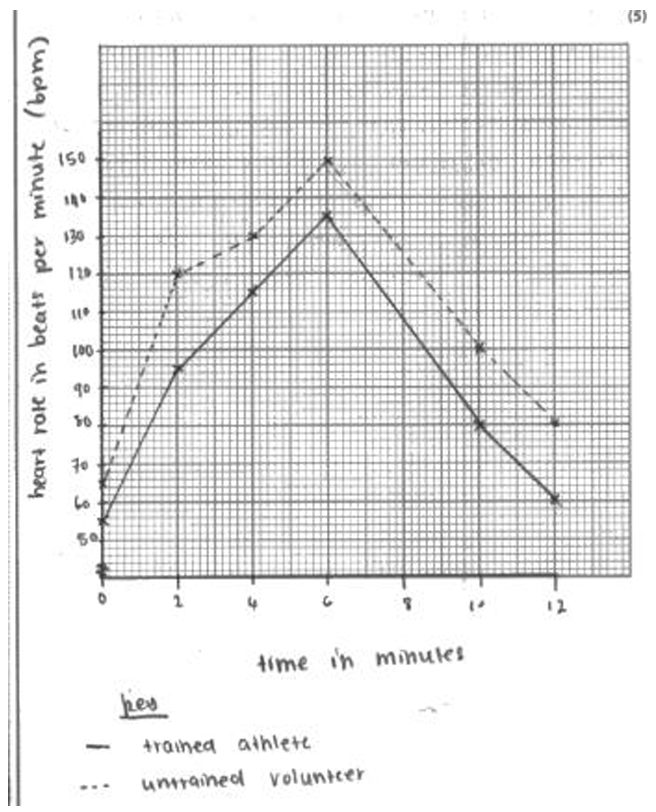
Explanation: A line graph should be drawn with Time (minutes) on the x-axis and Heart Rate (bpm) on the y-axis. Two lines should be plotted: one for the untrained volunteer and one for the trained athlete, using the data points from the table. The points should be joined with straight lines using a ruler. A key must be included to distinguish between the two lines. The scales should be linear and use at least half the grid. Both axes should be fully labelled (“Time (minutes)” and “Heart rate (bpm)”).
(b)(iii)
Explanation: The trained athlete can run faster due to several physiological advantages evident from the data:
1. Lower Resting and Recovery Heart Rate: The athlete has a lower heart rate at rest (55 bpm vs 65 bpm) and after exercise (e.g., 60 bpm at 12 mins vs 80 bpm). This indicates a larger and stronger heart muscle (hypertrophy) which results in a greater stroke volume (as calculated in part (i)). A larger stroke volume means more blood (and therefore more oxygen and glucose) is pumped to the muscles with each beat.
2. Efficient Oxygen Delivery: During exercise, the athlete’s heart rate increases less dramatically (peaks at 135 bpm vs 150 bpm) to achieve the same cardiac output. This efficient system allows for faster and more sustained delivery of oxygen and nutrients to respiring muscles, facilitating more aerobic respiration and ATP production.
3. Reduced Oxygen Debt and Lactic Acid Build-up: The quicker return to resting heart rate after exercise suggests the athlete incurs less oxygen debt and produces less lactic acid through anaerobic respiration. This reduces fatigue and allows for faster, longer-lasting muscle contractions.
In summary, the athlete’s cardiovascular system is more efficient at delivering oxygen and removing waste products, allowing for greater energy production and faster running speeds.

▶️ Answer/Explanation
(a)
1 Plasma
2 Platelets
Explanation: Blood is composed of several components. Red and white blood cells are the cellular components. The other two major components are plasma, which is the liquid matrix that carries the cells, nutrients, hormones, and waste products, and platelets, which are cell fragments crucial for blood clotting.
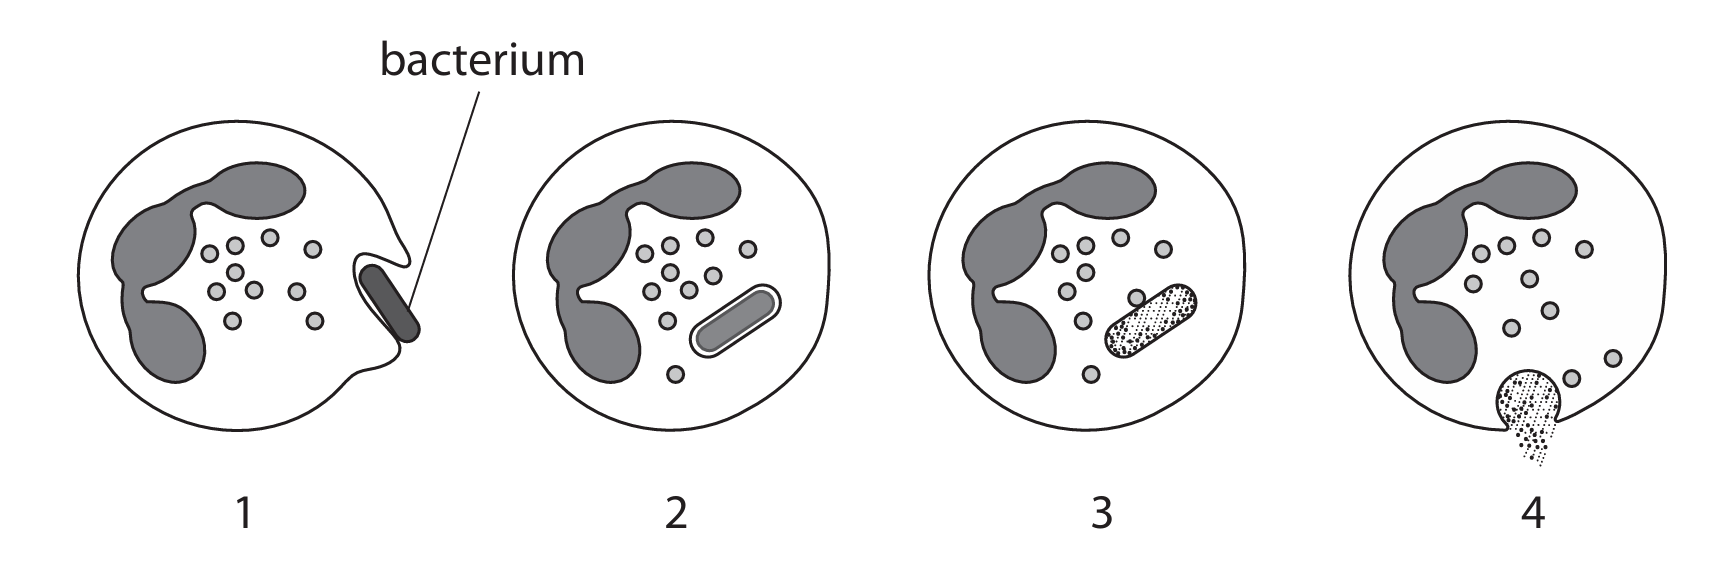
(b)
Stage 1: The white blood cell (a phagocyte) identifies the bacterium as a foreign pathogen and begins to move towards it.
Stage 2: The white blood cell engulfs the bacterium by extending its cell membrane around it, a process called phagocytosis. The bacterium becomes enclosed within a vesicle inside the cell called a phagosome.
Stage 3: A lysosome, containing digestive enzymes, fuses with the phagosome. The enzymes break down and digest the bacterium.
Stage 4: The waste products from the digested bacterium are expelled from the white blood cell through a process of exocytosis.
Explanation: This describes the process of phagocytosis, which is a key defense mechanism of the innate immune system. Specific types of white blood cells, like neutrophils and macrophages, use this method to ingest and destroy harmful microorganisms.
(c)(i)
magnification = 7000 (Accept answers in the range 6800–7300)
Explanation: To calculate magnification, you use the formula:
Magnification = Image Size / Actual Size
First, measure the diameter of the red blood cell in the picture. Let’s assume it measures approximately 5.7 cm (57 mm). Convert this to micrometres (μm) to match the units of the actual size: 57 mm × 1000 = 57,000 μm.
The actual size is given as 8.1 μm.
Therefore, Magnification = 57,000 μm / 8.1 μm ≈ 7037. This can be rounded to 7000 when considering significant figures and acceptable range.
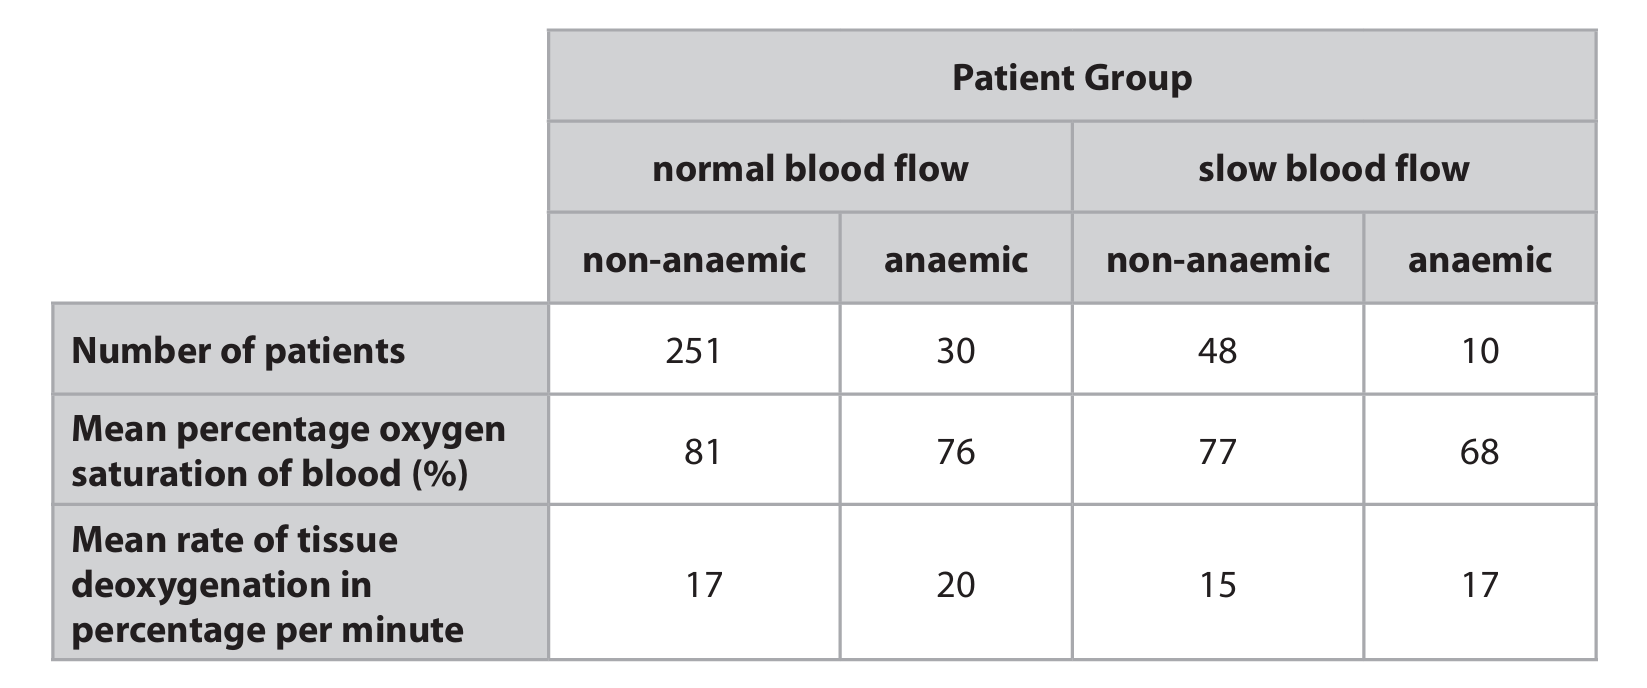
(c)(ii)
Discussion:
- Anaemia and Oxygen Saturation: For both blood flow groups, the mean percentage oxygen saturation is lower in anaemic patients (76% vs. 81% for normal flow; 68% vs. 77% for slow flow). This is because anaemia means fewer red blood cells and less haemoglobin, reducing the blood’s overall capacity to carry oxygen.
- Blood Flow and Oxygen Saturation: For both patient types (anaemic and non-anaemic), oxygen saturation is lower in the slow blood flow groups. Slower flow may allow more time for oxygen to be unloaded to tissues, leaving less oxygen bound in the blood vessels being measured.
- Rate of Tissue Deoxygenation: Under normal blood flow, the rate of deoxygenation is higher in anaemic patients (20%/min vs. 17%/min). This suggests that tissues are extracting oxygen from the blood more rapidly, possibly to compensate for the lower oxygen-carrying capacity. The difference is less pronounced in the slow blood flow group (17%/min vs. 15%/min), likely because the slower flow already allows for more complete oxygen extraction regardless of red blood cell count.
- Combined Effect: The lowest oxygen saturation (68%) is seen in anaemic patients with slow blood flow, showing these factors have a combined negative effect. Interestingly, their deoxygenation rate (17%/min) is the same as non-anaemic patients with normal flow, suggesting a complex compensatory relationship.
- Data Reliability: It’s important to note the much smaller sample sizes for the anaemic groups, especially the anaemic slow flow group (n=10), which might make these results less reliable than those from the larger non-anaemic normal flow group (n=251). Other factors like patient diet, activity levels, or overall health could also influence these results.

▶️ Answer/Explanation
(a) B (6 and 12)
Explanation: Pollen grains are gametes, which are produced by meiosis. Meiosis halves the chromosome number, so a pollen grain nucleus (male gamete) from a plant with a diploid number of 12 would have a haploid number of 6 chromosomes. A root cell is a somatic (body) cell and is produced by mitosis, which maintains the chromosome number. Therefore, a root cell nucleus would have the full diploid number of 12 chromosomes.
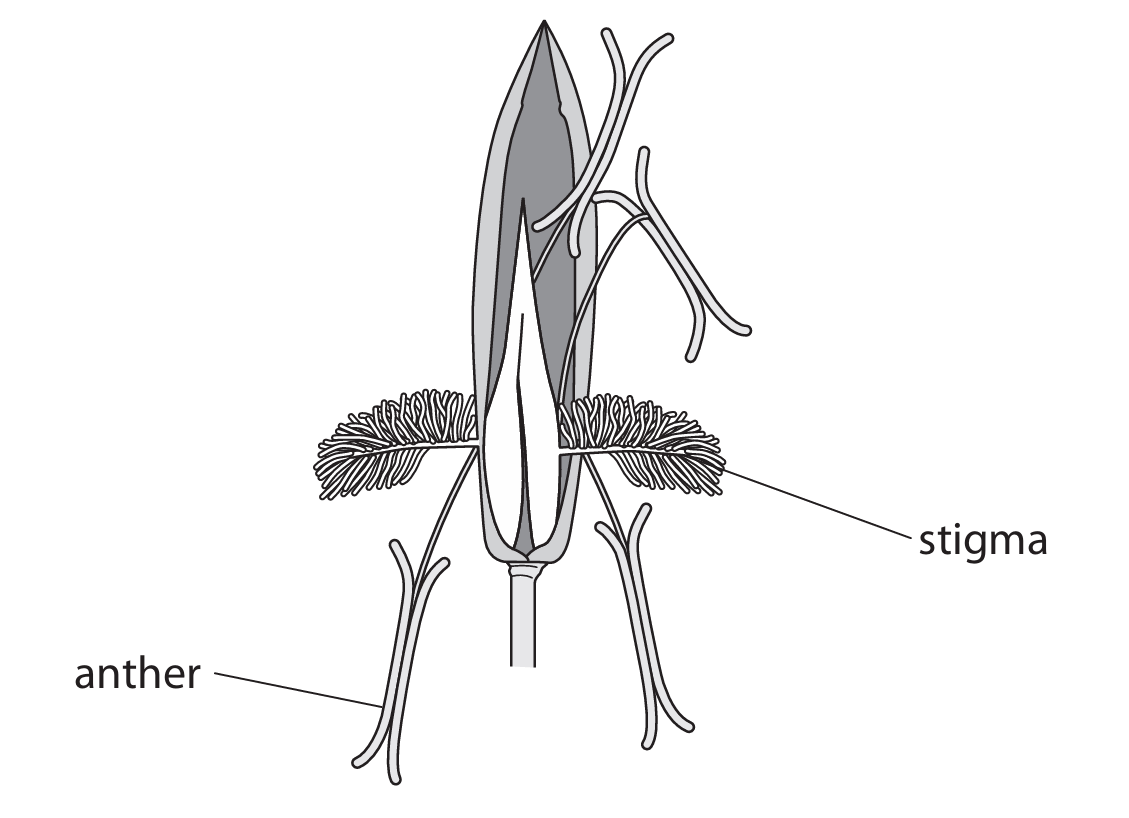
(b) An explanation of two adaptations, each with its function:
Explanation: Wind-pollinated flowers, like those of grasses, have specific adaptations to facilitate pollen transfer by wind rather than insects. Two key adaptations are:
- Exposed Anthers: The anthers are often hanging on long, flexible filaments outside the flower. This positioning allows the wind to easily catch and blow the pollen away from the plant.
- Feathery Stigma: The stigma is often large, feathery, and hangs outside the flower. This structure provides a large surface area to effectively catch pollen grains that are drifting in the air.
Other possible adaptations include producing large quantities of light, smooth pollen grains and having small, inconspicuous petals with no nectar or scent, as they do not need to attract insects.
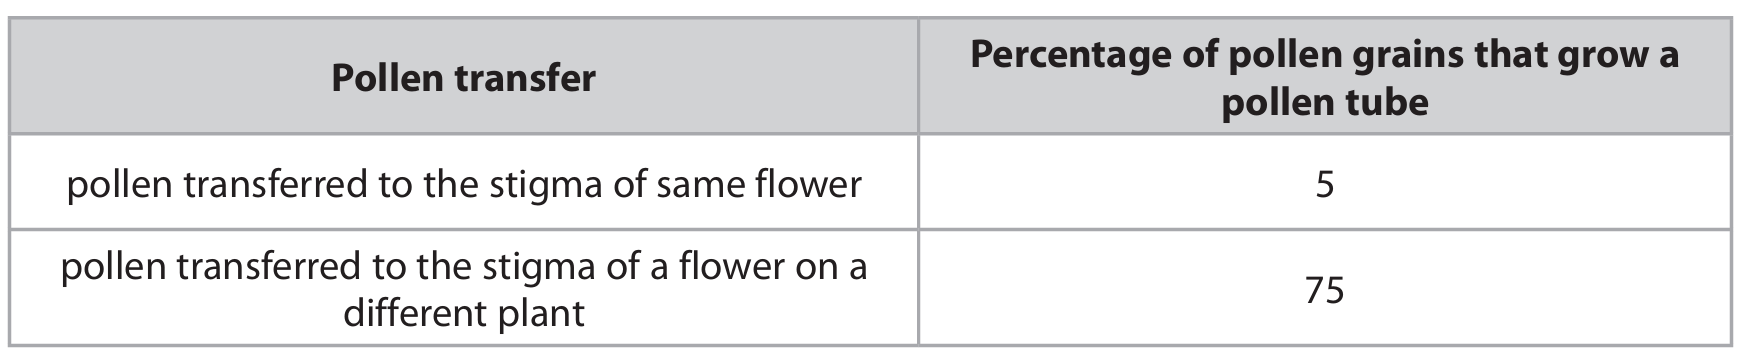
(c)(i) The percentage (or proportion/number) of pollen grains that grow a pollen tube.
Explanation: The dependent variable is what is measured in the experiment. In this case, the scientists are changing where the pollen is placed (the independent variable) and then measuring the effect this has on the success of pollen tube growth.
(c)(ii) An explanation linking cross-pollination to genetic variation and survival:
Explanation: The results show a much higher success rate for cross-pollination (75%) compared to self-pollination (5%). Cross-pollination involves the fusion of gametes from two different parent plants. This combines their different alleles, leading to greater genetic variation in the offspring. In a changing environment, this variation is crucial. Some individuals within the population are likely to possess combinations of alleles that make them better adapted to the new conditions (e.g., more resistant to a new disease or better suited to a changed climate). These individuals are more likely to survive and reproduce, passing on their advantageous alleles to the next generation. This process, natural selection, allows the species to evolve and survive over time. Self-pollination leads to less genetic variation, making the population more vulnerable if the environment changes, as seen by the low success rate.
(d)(i) Mitosis
Explanation: Asexual reproduction involves the production of genetically identical offspring from one parent. This is achieved through mitosis, a type of cell division that results in two daughter cells each having the same number and kind of chromosomes as the parent nucleus.
(d)(ii) An description of two advantages for commercial growers:
Explanation: Asexual reproduction is advantageous for commercial growers because it allows for the production of uniform crops. Since mitosis produces genetically identical clones, all the new plants will have the same desirable characteristics as the parent plant (e.g., high yield, specific fruit size, disease resistance). This ensures consistency and predictability in the harvest. Furthermore, it can be a faster method of propagation than growing from seed, allowing growers to produce large numbers of plants quickly to meet demand.
▶️ Answer/Explanation
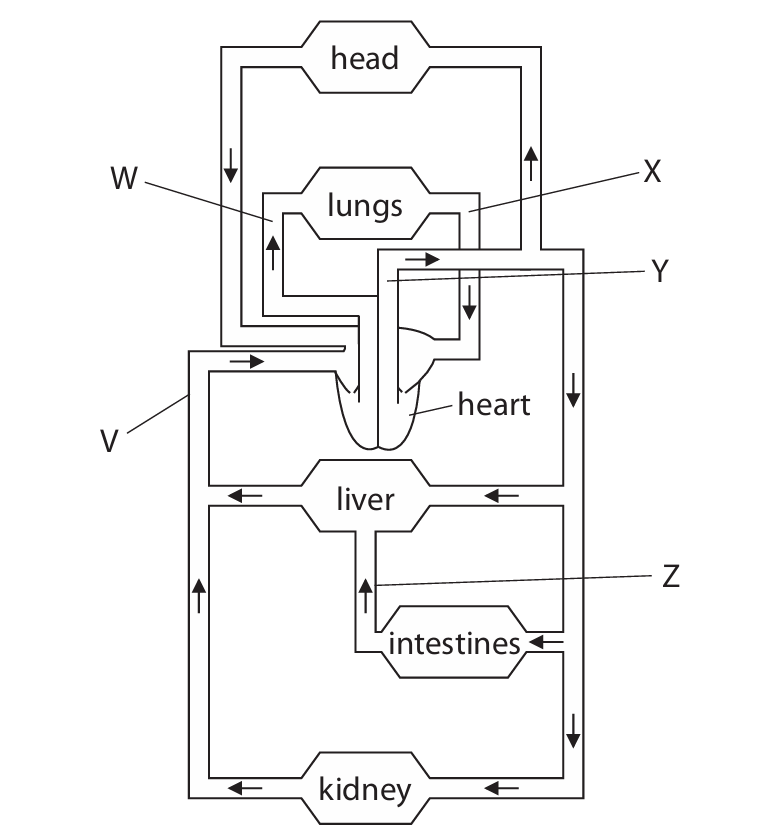
(a)(i) Hepatic portal vein
Explanation: Blood vessel Z is identified as the hepatic portal vein. This is a major vein that carries blood rich in digested nutrients from the intestines and spleen to the liver for processing. The liver then metabolizes these nutrients before the blood re-enters the general circulation via the hepatic vein.
(a)(ii) B (X)
Explanation: Blood vessel X contains blood with the lowest concentration of carbon dioxide. Vessel X is the pulmonary vein, which carries oxygenated blood from the lungs back to the heart. Since gas exchange occurs in the lungs, carbon dioxide is diffused out and oxygen is diffused in, resulting in blood that is high in oxygen and low in carbon dioxide entering the pulmonary vein.
Option A (W) is the pulmonary artery, which carries deoxygenated blood high in CO₂ to the lungs. Option C (Y) is the aorta, which carries oxygenated blood but has a higher CO₂ concentration than pulmonary vein blood because it has delivered oxygen to tissues. Option D (Z) is the hepatic portal vein, which carries blood from the gut that may have varying CO₂ levels but is not the lowest.
(b)
1. V (vein) has a thinner wall, while Y (artery) has a thicker wall.
2. V (vein) has valves present to prevent backflow of blood, while Y (artery) does not have valves.
Explanation: V is a vein (likely the vena cava) and Y is an artery (the aorta). Veins have thinner walls composed of less muscle and elastic tissue compared to arteries because they carry blood at a lower pressure back to the heart. The thick, muscular, and elastic walls of arteries like the aorta are necessary to withstand the high pressure of blood being pumped from the heart. Furthermore, veins contain valves to ensure blood flows in one direction against gravity, whereas the high pressure in arteries maintains flow without needing valves.
Other acceptable differences include: Veins have a wider lumen (internal space) compared to arteries. Arteries have more elastic fibers to allow for stretch and recoil.
(c)(i)
1. Smoking
2. High cholesterol diet / Obesity / Diabetes / Lack of exercise / High stress / Family history (genetics) / Age
Explanation: Coronary heart disease (CHD) is caused by the buildup of fatty plaques (atheroma) in the coronary arteries, reducing blood flow to the heart muscle. Many lifestyle and genetic factors increase this risk. Smoking damages the lining of arteries and promotes atherosclerosis. A diet high in saturated fats and cholesterol can lead to high blood cholesterol levels, contributing to plaque formation. Other significant risk factors include obesity, diabetes, physical inactivity, chronic stress, a family history of heart disease, and increasing age.
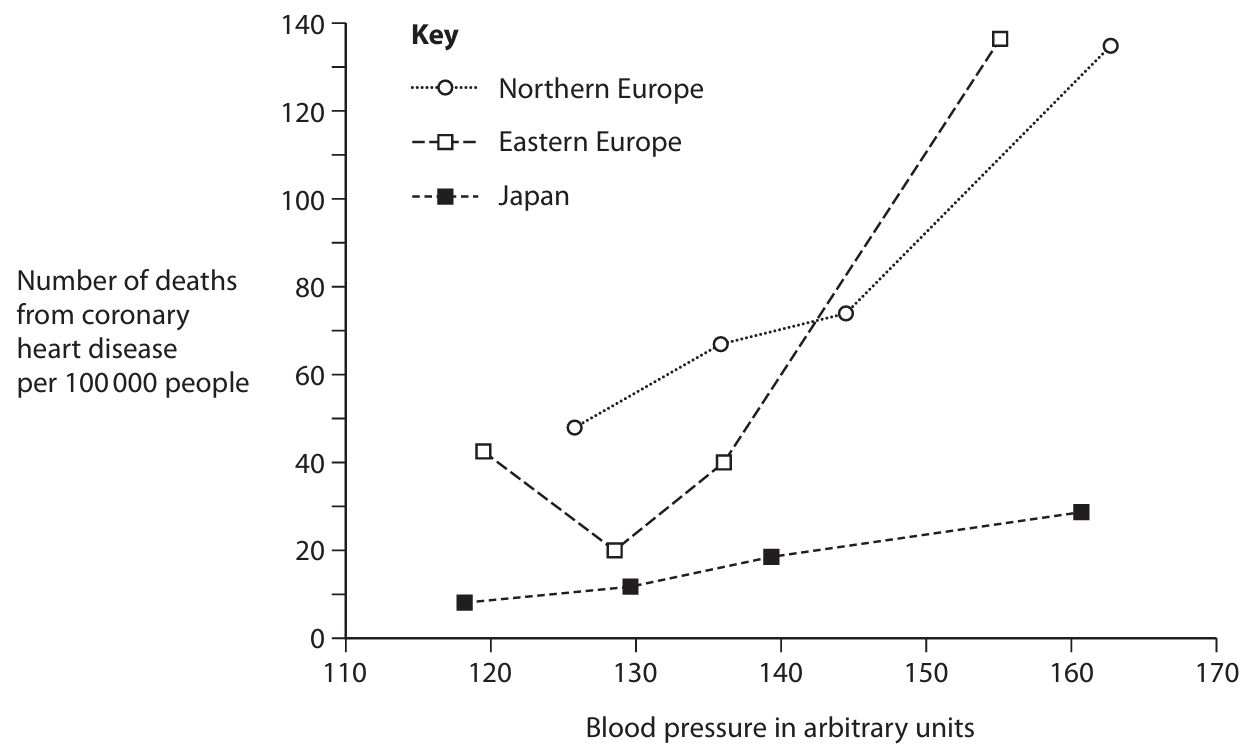
(c)(ii) Comments based on the graph and knowledge:
General Trend: The graph shows a positive correlation between blood pressure and the number of deaths from coronary heart disease (CHD) for all three regions. As blood pressure increases, so does the mortality rate from CHD. This is biologically expected because high blood pressure (hypertension) damages the inner lining of arteries, making them more susceptible to atherosclerosis, which is the primary cause of CHD.
Regional Comparisons:
- Japan: Japan consistently has the lowest number of deaths from CHD across all blood pressure levels shown on the graph. Even at higher blood pressures, the death rate in Japan is significantly lower than in European regions at similar pressures. This suggests that factors other than blood pressure are very effective at mitigating CHD risk in Japan. These factors likely include a traditional diet low in saturated fats (e.g., rich in fish, rice, vegetables), high consumption of omega-3 fatty acids, potentially lower obesity rates, and other genetic or lifestyle factors that protect cardiovascular health.
- Northern and Eastern Europe: Both European regions show higher death rates from CHD compared to Japan at equivalent blood pressures. Northern Europe generally has higher death rates than Eastern Europe at the highest blood pressures, though Eastern Europe may show a steeper increase or different pattern. The higher rates in Europe could be linked to diets higher in saturated fats and processed foods, higher rates of smoking and alcohol consumption, or other lifestyle factors that exacerbate the risks associated with high blood pressure.
Conclusion: While high blood pressure is a significant risk factor for CHD globally, the graph clearly indicates that its impact is modulated by other regional factors. Japan’s population seems to have protective elements in their diet, lifestyle, or genetics that reduce the overall risk and mortality from CHD, even in the presence of hypertension. In contrast, populations in Northern and Eastern Europe may have additional risk factors that compound the dangers of high blood pressure, leading to higher mortality rates. This highlights that CHD is a multifactorial disease, and public health strategies must address multiple risk factors simultaneously.

▶️ Answer/Explanation
(a) (i)
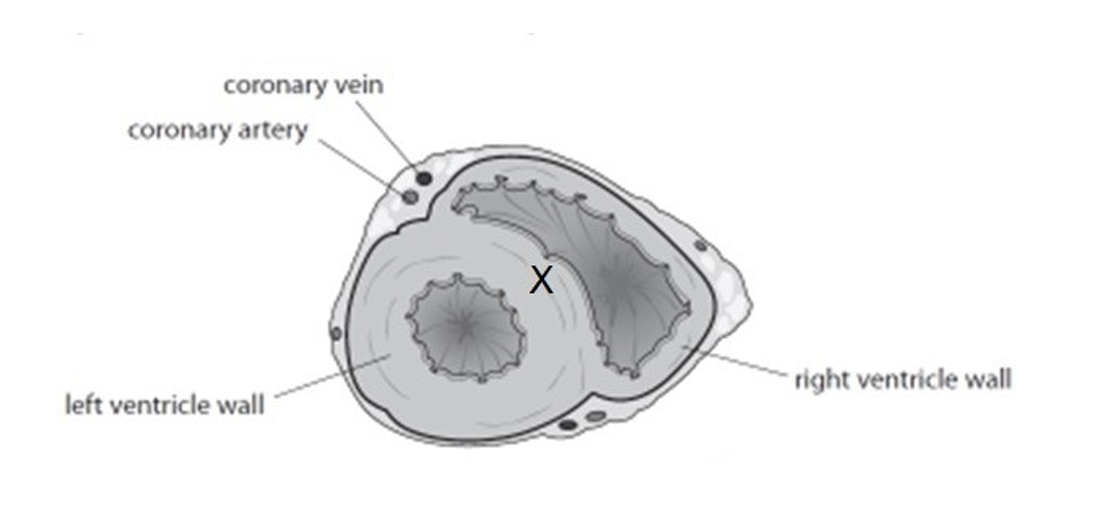
Answer: The X should be drawn on the vertical wall separating the left and right ventricles.
Explanation: The septum is the muscular wall that divides the left and right sides of the heart, specifically the ventricles. Its primary function is to prevent the mixing of oxygenated and deoxygenated blood. On a transverse section diagram, it appears as a thick, central wall between the two ventricles.
(a) (ii)
Answer:
1. The coronary artery contains oxygenated blood / has a high concentration of oxygen, whereas the coronary vein contains deoxygenated blood / has a low concentration of oxygen.
2. The coronary artery contains a low concentration of carbon dioxide, whereas the coronary vein contains a high concentration of carbon dioxide.
Explanation: The coronary artery is a branch of the aorta and carries oxygen-rich blood away from the heart to the heart muscle itself. After the heart muscle has used the oxygen for respiration, the now deoxygenated blood, which also contains a higher concentration of the waste product carbon dioxide, is collected by the coronary veins to be returned to the right atrium.
(a) (iii)
Answer: The wall of the left ventricle is much thicker and more muscular than the wall of the right ventricle.
Explanation: This structural difference is due to their different functions. The right ventricle only needs to pump deoxygenated blood a short distance to the lungs at relatively low pressure. In contrast, the left ventricle must generate enough force to pump oxygenated blood out through the aorta to the entire body against the high pressure of the systemic circulation. The thicker muscle in the left ventricle wall allows it to contract more powerfully to create this higher pressure.
(b)
Answer: Factors such as genetics, high blood pressure, a high-fat diet, smoking, stress, lack of exercise, and obesity can increase the risk of coronary heart disease.
Explanation: These factors contribute to the development of atherosclerosis, where fatty deposits (like cholesterol) build up and harden on the inner walls of the coronary arteries. This process, called atherosclerosis, narrows the arteries, reducing blood flow to the heart muscle.
– Genetics: Some individuals inherit genes that predispose them to high cholesterol levels or high blood pressure.
– High Blood Pressure: This puts extra strain on the artery walls, making them more susceptible to damage and the accumulation of fatty deposits.
– High-Fat Diet: A diet rich in saturated fats can lead to high levels of LDL cholesterol (‘bad’ cholesterol) in the blood, which is a key component of the fatty plaques.
– Smoking: Chemicals in tobacco can damage the lining of the arteries, encouraging plaque formation. Smoking also increases blood pressure and the risk of blood clots.
– Lack of Exercise: Regular exercise helps maintain healthy blood pressure, weight, and cholesterol levels. Without it, these risk factors can increase.
– Obesity: Being overweight increases the strain on the heart and is often linked to high blood pressure, high cholesterol, and diabetes.
The narrowed arteries can lead to angina (chest pain) or, if a clot forms and completely blocks an artery, a myocardial infarction (heart attack).
▶️ Answer/Explanation
(a) (i)
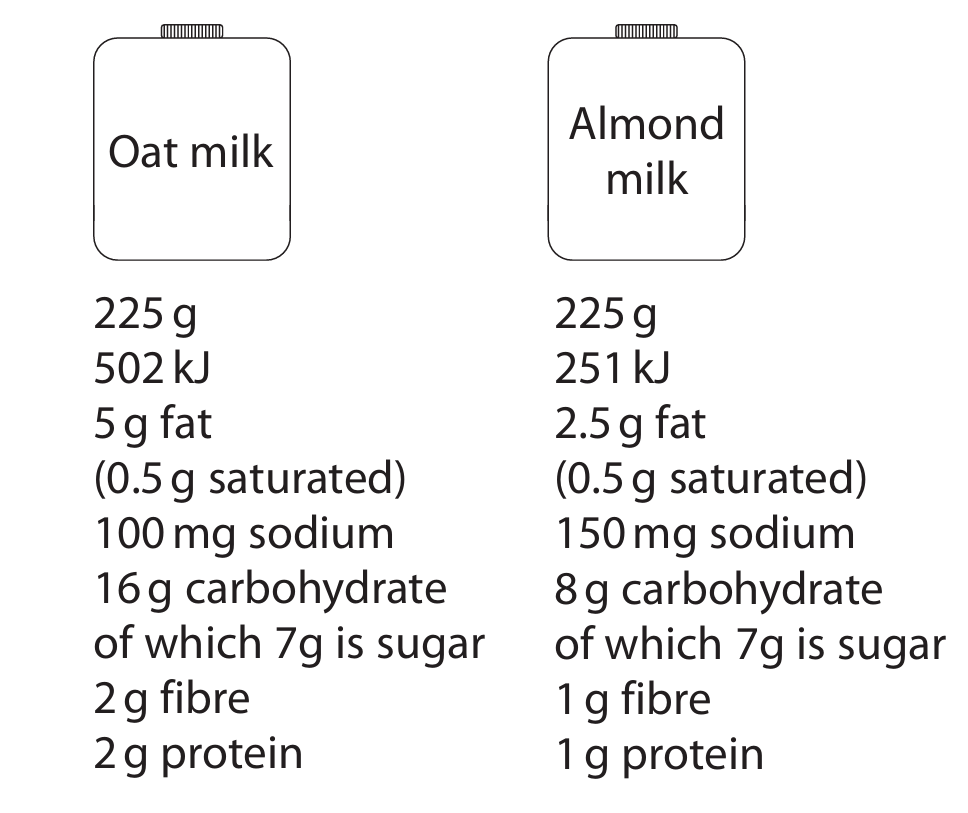
Almond milk would be the most suitable for a person trying to lose weight.
Explanation: Weight loss fundamentally depends on achieving a negative energy balance, where energy expenditure exceeds energy intake. When comparing the two milks per 225g serving, almond milk provides only 251 kJ of energy, which is half the energy content of oat milk (502 kJ). Consuming fewer calories from beverages can significantly contribute to an overall calorie deficit without requiring drastic changes to solid food intake.
Furthermore, almond milk contains only 2.5g of total fat, compared to 5g in oat milk. While the saturated fat content is the same (0.5g), a lower overall fat intake can be beneficial for weight management as fats are energy-dense. Almond milk also has half the carbohydrate content (8g vs. 16g) and half the protein content (1g vs. 2g). Although protein is important for satiety (feeling full), the difference of 1g is minimal in the context of an entire diet. The significantly lower energy (calorie) content of almond milk is the most decisive factor for weight loss. It is also important to note that both milks contain the same amount of sugar (7g), so there is no advantage for either on that point. A successful weight loss strategy involves the entire diet and exercise regimen, but choosing lower-calorie alternatives like almond milk can be a simple and effective step.
(a) (ii)
Explanation: A person might choose non-dairy milk like oat or almond milk over cow’s milk for several reasons. A very common reason is lactose intolerance, where an individual lacks sufficient amounts of the enzyme lactase needed to digest the lactose sugar found in cow’s milk, leading to digestive discomfort. Others may have a genuine milk allergy (an immune response to milk proteins). People following a vegan lifestyle abstain from all animal products, including cow’s milk. Some may also choose plant-based milks due to personal preferences, such as a desire to reduce saturated fat intake (though many plant milks are low in sat fat) or due to concerns about animal welfare in the dairy industry.
(b)
Explanation: To test a milk sample for glucose, a student could perform the Benedict’s test. First, they would place a sample of the milk in a clean test tube. It is often advisable to dilute the milk or filter it to reduce its opacity, which can make colour changes easier to see. Then, they would add an equal volume of Benedict’s reagent (a blue solution containing copper sulfate) to the test tube. The test tube would be placed in a water bath and heated at about 70-80°C for 5 minutes. If glucose (a reducing sugar) is present, the blue Benedict’s reagent will change colour. The final colour indicates the approximate concentration: green for a low concentration, yellow/orange for a medium concentration, and a brick-red precipitate for a high concentration of reducing sugar. The appearance of any colour other than blue indicates a positive test for reducing sugars like glucose.
(c)
Explanation: The special proteins in human breast milk that provide immunity are antibodies, specifically a type called IgA. These antibodies help protect the baby through a process called passive immunity. The mother’s body produces these antibodies in response to pathogens (like bacteria and viruses) she has encountered. The antibodies are then secreted into her breast milk. When the baby consumes the milk, these antibodies line the baby’s digestive and respiratory tracts. They work by recognizing and binding to specific antigens on the surface of pathogens. This binding can neutralize the pathogens, preventing them from infecting the baby’s cells, or it can clump them together (agglutination) making it easier for the baby’s immune cells to identify and destroy them. This provides crucial protection for the newborn while its own immune system is still developing and is not yet fully capable of fighting off infections on its own.


▶️ Answer/Explanation
(a)(i) A red blood cell cannot be used to show a karyotype because it lacks a nucleus. The nucleus is the organelle that contains the chromosomes. Since red blood cells in mammals are anucleated (they lose their nucleus during development to make more space for hemoglobin), they do not contain any chromosomal material that can be photographed and arranged into a karyotype.
(a)(ii) The type of cell division that occurs in white blood cells is mitosis. Mitosis is the process of nuclear division in eukaryotic cells that results in two daughter cells each having the same number and kind of chromosomes as the parent nucleus. It is the division responsible for general growth and repair in the body.
(a)(iii) The karyotype in Diagram 1 can be identified as male because the 23rd pair of chromosomes consists of one X chromosome and one Y chromosome. In humans, females have two X chromosomes (XX), while males have one X and one Y chromosome (XY). The presence of the Y chromosome is the definitive indicator of a male karyotype.
(b)(i) The key difference between the two karyotypes is the number of chromosomes. Diagram 1 (the male) shows the normal human diploid number of 46 chromosomes. Diagram 2 (the female with Turner syndrome) shows only 45 chromosomes; specifically, there is only one sex chromosome present (a single X chromosome), denoted as 45,X.
The effects of Turner syndrome on the person are significant. Due to the missing X chromosome and the resulting hormonal deficiencies (particularly oestrogen), the individual will likely not undergo normal puberty. This leads to a lack of development of secondary sexual characteristics (such as breast development). Furthermore, the ovaries are typically underdeveloped (streak ovaries) and do not produce viable eggs, making the person infertile. There can also be other health implications, such as short stature and potential heart defects.
(b)(ii) The chromosomal difference in Turner syndrome (45,X) is most commonly produced by a process called non-disjunction. This is an error that can occur during the formation of the gametes (eggs or sperm) in one of the parents. Specifically, during meiosis, the paired sex chromosomes (X and X in a female, or X and Y in a male) fail to separate properly. If an egg or sperm that lacks a sex chromosome (is nullisomic) fuses with a normal gamete containing one X chromosome, the resulting zygote will have only one X chromosome, leading to Turner syndrome.
▶️ Answer/Explanation
(a) (i) The condition causes the left ventricle wall to be less elastic. This means the heart chamber cannot fill with as much blood or pump blood out as effectively with each beat (reduced stroke volume). Consequently, less oxygenated blood is pumped to the muscles during running. The muscles therefore receive less oxygen for aerobic respiration, which is needed to release the large amounts of energy required for fast movement, making the cat unable to run quickly.
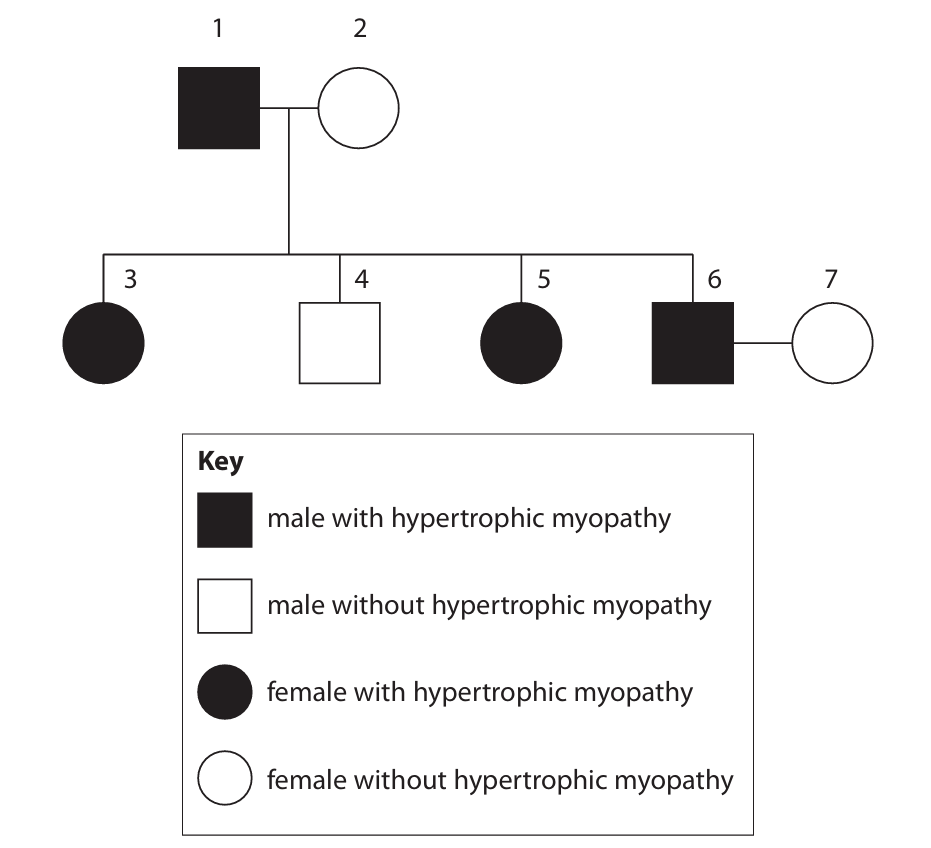
(a) (ii) A dominant allele is an allele that will always be expressed in the phenotype, even if only one copy is present (i.e., in a heterozygous individual).
(a) (iii)
Genetic Diagram:
Parental Phenotypes: Individual 6 (Unaffected) x Individual 7 (Unaffected)
Parental Genotypes: hh x hh (Both must be homozygous recessive to be unaffected, as the condition is dominant)
Gametes: All gametes from both parents are h.
Offspring Genotypes: All offspring are hh.
Offspring Phenotypes: All offspring are unaffected (normal heart development).
Explanation: Since the condition is caused by a dominant allele (H), any cat without the condition must have the genotype hh. Both parents (6 and 7) are unaffected, so they must both be hh. When two homozygous recessive individuals cross, all of their offspring will also be homozygous recessive (hh) and thus unaffected.
(a) (iv) The probability is 0.
Explanation: As shown in the genetic diagram, all possible offspring from parents 6 and 7 will have the genotype hh and will not have hypertrophic myopathy. Therefore, the probability of having an offspring with the condition is zero. Since the question asks for the probability of an offspring that is both male and has the condition, and the condition probability is zero, the overall probability is also zero. The probability of being male is 0.5, but 0.5 multiplied by 0 is still 0.
(b) It is more difficult to remove harmful recessive alleles than harmful dominant alleles because recessive alleles can be “hidden” from selection in heterozygous individuals (carriers). A harmful dominant allele is always expressed in the phenotype, so individuals with it can be easily identified and prevented from breeding, thus removing the allele from the population. However, a harmful recessive allele is not expressed in heterozygous carriers (who have the genotype Hh but are phenotypically normal). These carriers can breed and pass the harmful recessive allele to their offspring without breeders knowing, making it very difficult to identify and eliminate all carriers from a breeding population.


▶️ Answer/Explanation
(a) C it is specific
Explanation: Biological control uses natural predators or parasites to target specific pests, unlike broad-spectrum chemical pesticides that can harm beneficial insects and other non-target organisms. This specificity reduces environmental impact and helps maintain ecological balance in the farming ecosystem.
(b)(i)
1. Sucrose/sugars
2. Amino acids
Explanation: Aphids feed directly on the phloem sap, which is rich in sugars (like sucrose) produced during photosynthesis, and amino acids, which are the building blocks of proteins. These compounds are transported throughout the plant via the phloem to support growth and storage.
(b)(ii)
Explanation: When aphids feed on phloem sap, they directly remove vital nutrients—sugars and amino acids—that the plant needs for energy and growth. This loss reduces the plant’s ability to perform essential functions. With less sugar available, respiration (the process of releasing energy) is compromised, leading to reduced ATP production. This energy deficit hinders active transport, limiting the plant’s uptake of minerals from the soil. Consequently, the plant experiences stunted growth, produces smaller leaves, tubers, fruits, or grains, and may store less starch and protein. In severe cases, the loss of nutrients can even reduce the rate of photosynthesis itself. Additionally, aphid feeding can weaken the plant and make it more susceptible to diseases, further reducing crop yield.
(c)
Explanation: The scientists’ conclusion that hoverflies are the most effective biological control agent is supported by the graph data, which shows that hoverfly larvae consume more aphids per day than silverfly larvae at all three temperatures tested (12°C, 15°C, and 18°C). This higher consumption rate means fewer hoverflies would be needed to control an aphid population, making them a potentially more efficient option. The difference in consumption is most pronounced at the lowest temperature (12°C), where hoverflies eat roughly three times more aphids, suggesting they might be particularly useful in cooler conditions.
However, the conclusion may not be entirely conclusive due to limitations in the method. The experiment used only a single larva per container, which is a very small sample size. To improve reliability, the experiment should be repeated with many more larvae to calculate a more robust average and account for individual variation. Furthermore, the controlled laboratory environment does not fully replicate field conditions, where factors like wind, rain, predators of the control agents themselves, and the spatial distribution of aphids could significantly influence feeding behavior. The study also only compared two species; other effective natural predators of aphids, like ladybugs or lacewings, were not included in the comparison. Therefore, while the data suggests hoverflies are promising, more extensive field trials and comparisons with other agents are needed to firmly establish them as the most effective option.
▶️ Answer/Explanation
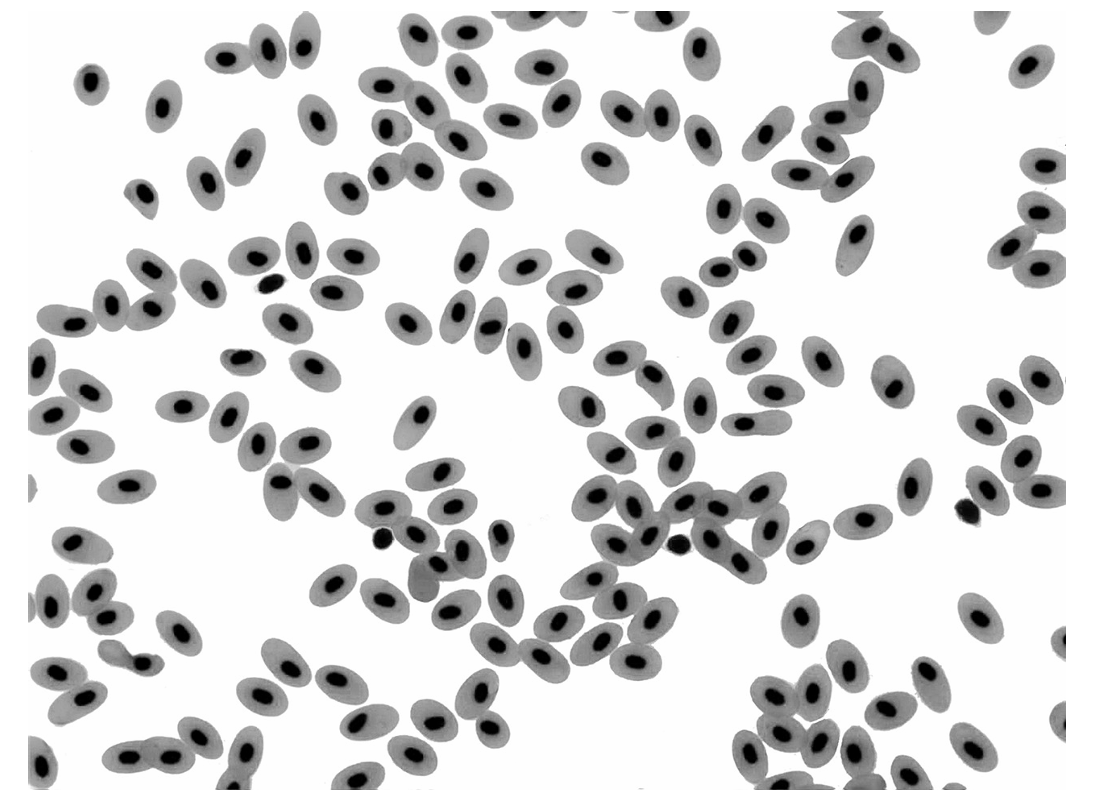
(a)(i) Nucleus (present)
Explanation: Human red blood cells are unique among mammalian cells in that they lose their nucleus during development, a process called enucleation. This creates more space for hemoglobin, the oxygen-carrying protein. In contrast, fish red blood cells retain their nucleus throughout their lifespan, which takes up valuable space that could otherwise be used for oxygen transport.
(a)(ii)
Explanation: Fish red blood cells transport oxygen less efficiently due to two main structural differences. First, their spherical shape gives them a lower surface area to volume ratio compared to the biconcave disc shape of human red blood cells. A larger surface area allows for faster diffusion of oxygen into and out of the cell. Second, the presence of a nucleus in fish red blood cells reduces the available volume inside the cell for hemoglobin. With less hemoglobin, each fish red blood cell can carry less oxygen than a human red blood cell, making the transport process less efficient overall.
(b)
Explanation: Llamas evolved their efficient oxygen transport through the process of natural selection. Initially, there would have been genetic variation in the llama population regarding hemoglobin or red blood cell characteristics. Some individuals may have had mutations that resulted in hemoglobin with a higher affinity for oxygen or red blood cells that could carry more oxygen. At high altitudes where oxygen is scarce, these individuals with better oxygen-carrying capacity would have had a survival advantage. They would be more likely to survive, reproduce, and pass on these advantageous genes to their offspring. Over many generations, this natural selection process led to the entire llama population developing red blood cells that can absorb more oxygen, making them well-adapted to high-altitude environments.
(c)
Explanation: Phagocytes play a crucial role in the body’s immune defense system as part of the non-specific immune response. Their primary function is to engulf and destroy pathogens such as bacteria, viruses, and other foreign particles that enter the body. When phagocytes encounter these invaders, they extend their cell membrane around them, a process called phagocytosis, effectively “eating” the pathogen. Once inside the phagocyte, the pathogen is contained within a vesicle called a phagosome. This vesicle then fuses with lysosomes containing powerful digestive enzymes, which break down and destroy the captured pathogen, thus preventing infection and disease.
▶️ Answer/Explanation
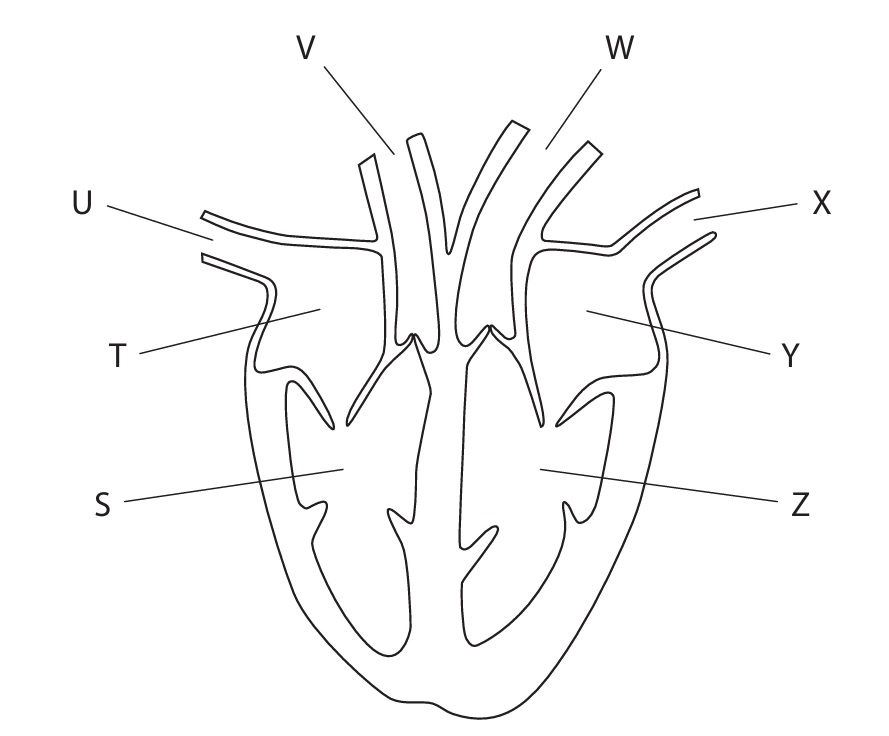
(a)(i) A U
Explanation: Blood vessel U is the vena cava, which brings deoxygenated blood from the body back to the right atrium of the heart. This is a fundamental part of the circulatory system where deoxygenated blood returns to the heart to be pumped to the lungs for oxygenation.
(a)(ii) D Z
Explanation: Chamber Z is the left ventricle, which is responsible for pumping oxygenated blood out of the heart to the rest of the body through the aorta. The left ventricle has the thickest muscular wall of all the heart chambers because it needs to generate enough pressure to circulate blood throughout the entire body.
(a)(iii)
Explanation: Chamber S (right ventricle) has a thinner wall compared to chamber Z (left ventricle). This difference exists because the right ventricle only needs to pump blood a short distance to the lungs, which requires less pressure. In contrast, the left ventricle must generate much higher pressure to pump blood throughout the entire body. The thicker, more muscular wall of the left ventricle enables it to create this greater force. Additionally, the right ventricle pumps deoxygenated blood to the lungs, while the left ventricle pumps oxygenated blood to all body tissues.
(b)
Explanation: Three essential components of a balanced diet and their functions are:
- Carbohydrates: Provide the primary source of energy for the body. They are broken down into glucose, which is used for cellular respiration to produce ATP, the energy currency of cells.
- Proteins: Essential for growth and repair of body tissues. They are used to build and maintain muscles, organs, skin, and hair. Proteins also form enzymes that catalyze biochemical reactions and antibodies for immune defense.
- Fats/Lipids: Serve as a concentrated energy store and provide insulation to help maintain body temperature. They also protect vital organs and are necessary for the absorption of fat-soluble vitamins (A, D, E, K).
Other important components include minerals like calcium for strong bones and teeth, vitamins like vitamin C for healthy connective tissue and immune function, fiber for proper digestion and bowel function, and water as a solvent for chemical reactions and transport medium.
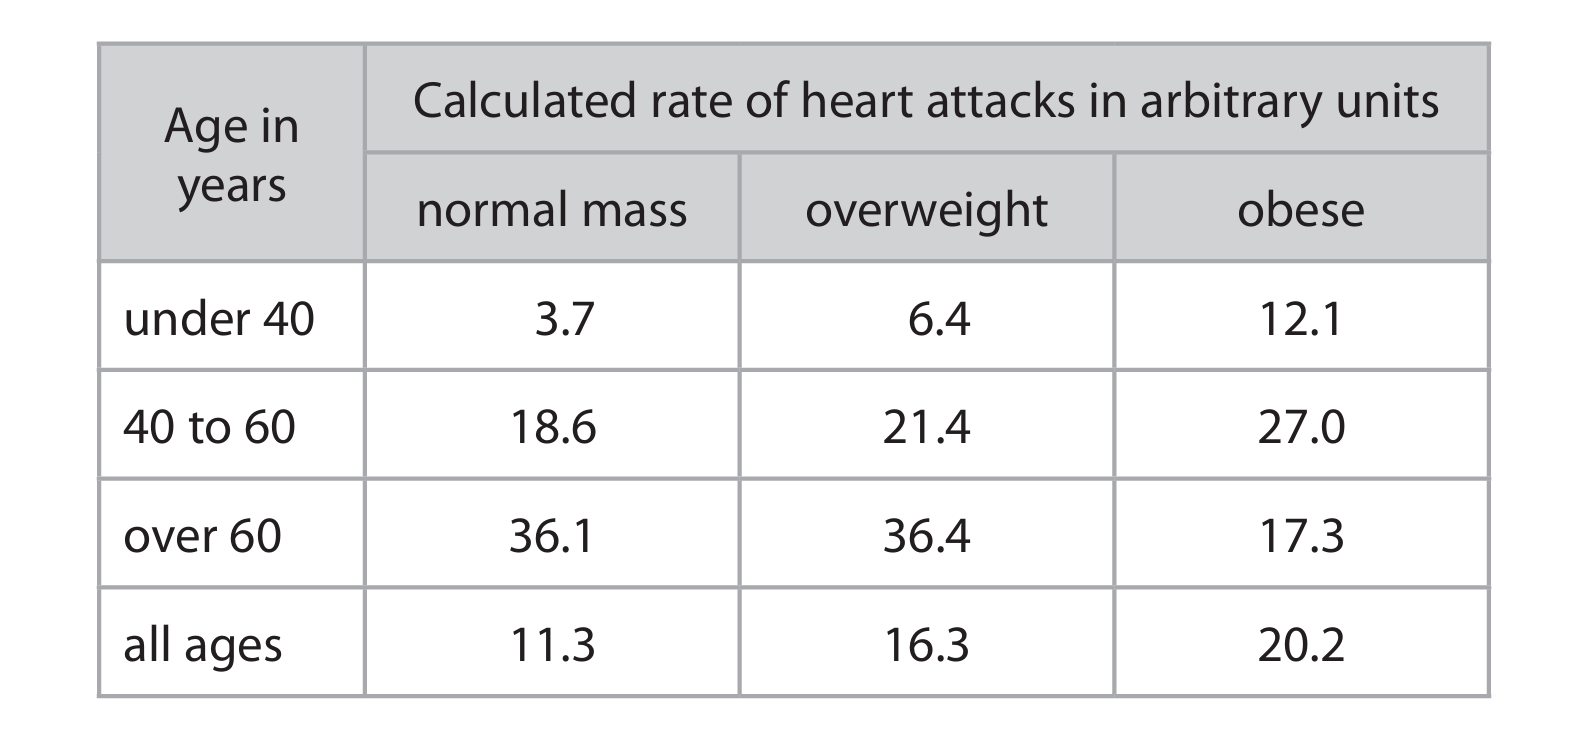
(c)
Explanation: The data reveals several important relationships between body mass, age, and heart attack risk. The study was large-scale (850 people) and long-term (20 years), which increases its reliability. Across all age groups combined, there’s a clear trend showing that as body mass increases from normal to overweight to obese, the rate of heart attacks also increases (11.3 → 16.3 → 20.2 arbitrary units).
However, when examining specific age groups, more nuanced patterns emerge. For people under 40, obesity is associated with a substantially higher heart attack rate (12.1) compared to normal mass (3.7) – more than three times the risk. In the 40-60 age group, the trend continues with obese individuals having the highest rates. Interestingly, for people over 60, the pattern reverses – obese individuals actually have the lowest heart attack rate (17.3) compared to normal mass (36.1) and overweight (36.4) individuals.
This surprising finding in the over-60 group suggests that other factors beyond body mass may become more important in determining heart attack risk in older age. The study has limitations though – it was conducted only in one Australian population, so the results might not apply universally. Other factors not accounted for in this data, such as smoking habits, exercise levels, genetic predisposition, stress, and specific dietary patterns, could also significantly influence heart attack risk and might explain some of the observed patterns.
▶️ Answer/Explanation
(a) oxygen + glucose → carbon dioxide + water + ATP
Explanation: The complete word equation for aerobic respiration is fundamental to understanding how cells produce energy. Glucose, derived from the food we eat, combines with oxygen we breathe in. Through a series of complex biochemical reactions in the mitochondria, these reactants are broken down to produce carbon dioxide (which we exhale), water, and ATP (adenosine triphosphate), which is the main energy currency used by cells for all their functions.
text
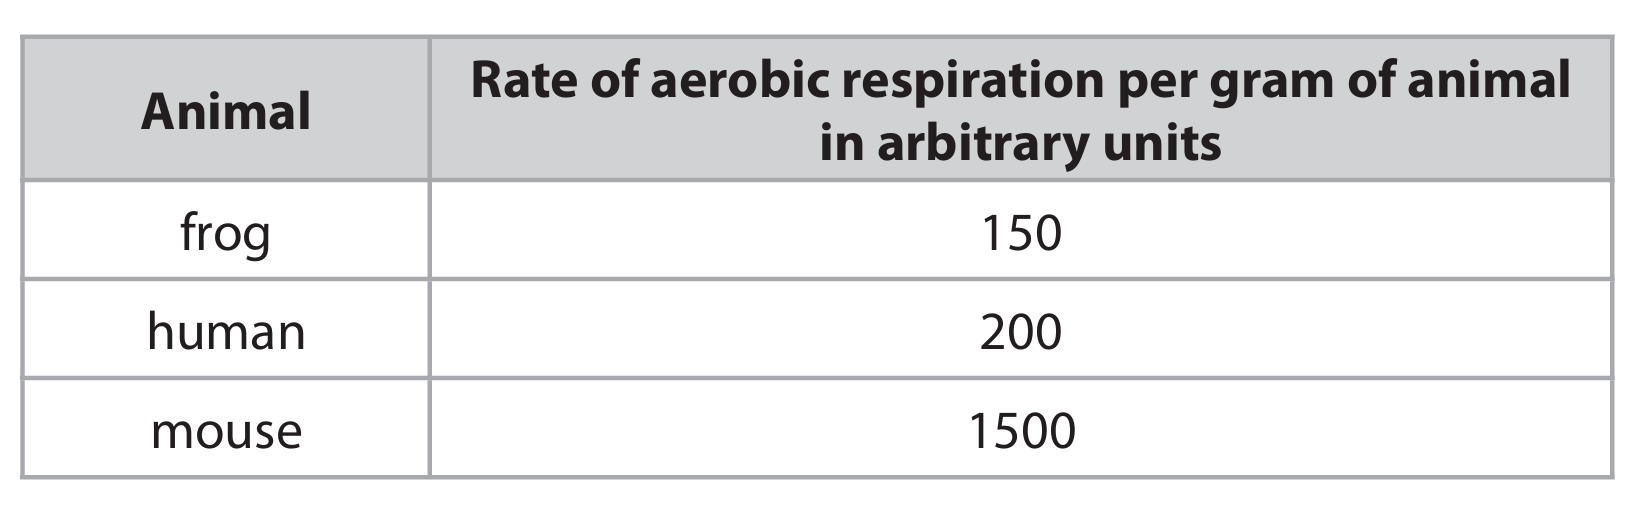
(b) A mouse has a higher metabolic rate and a larger surface area to volume ratio than a human, leading to greater heat loss that must be compensated for by increased respiration.
Explanation: When comparing animals of different sizes, the surface area to volume ratio plays a crucial role in physiological processes. A mouse, being much smaller than a human, has a relatively larger surface area through which it can lose heat to its environment. To maintain a constant body temperature (as both are mammals), the mouse must generate more heat internally. This requires a higher metabolic rate, meaning more cellular respiration occurs per gram of tissue. Since aerobic respiration consumes oxygen, the mouse consequently uses more oxygen per gram of body mass to fuel this increased metabolic activity and heat production.
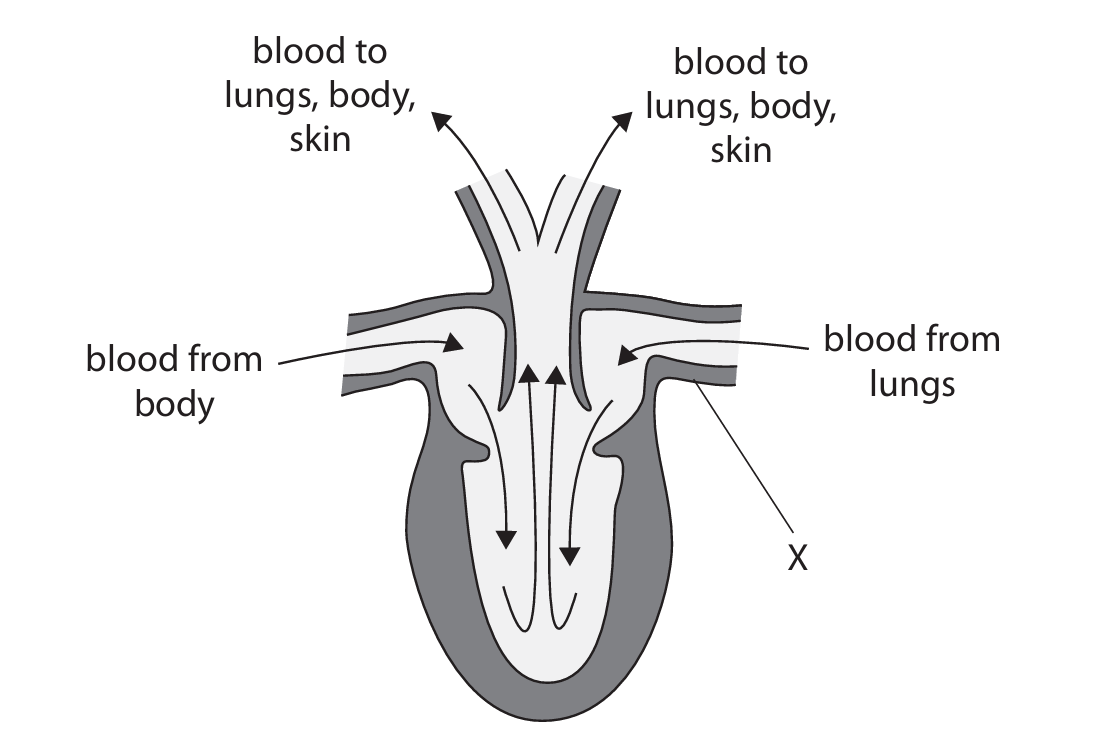
(c)(i) C pulmonary vein
Explanation: In both frog and human circulatory systems, the pulmonary vein is responsible for carrying oxygenated blood from the lungs back to the heart. Looking at the diagram and the direction of blood flow, vessel X is bringing blood from the lungs into the heart chamber, which matches the function of the pulmonary vein.
(c)(ii) A frog heart has three chambers (two atria and one ventricle) while a human heart has four chambers (two atria and two ventricles).
Explanation: This structural difference is significant. The frog’s heart has a single ventricle that receives blood from both atria, whereas the human heart has a complete separation between the right and left ventricles. This separation in humans prevents the mixing of oxygenated and deoxygenated blood, making the circulatory system more efficient.
(c)(iii) The three-chambered heart of a frog causes mixing of oxygenated and deoxygenated blood in the single ventricle, resulting in less efficient oxygen delivery to tissues and limited endurance for sustained activity.
Explanation: The frog’s three-chambered heart presents several limitations for sustained activity. Since there’s only one ventricle, oxygenated blood returning from the lungs and skin mixes with deoxygenated blood returning from the body. This mixture is then pumped out to both the lungs and the body simultaneously. The blood going to the body therefore has a lower oxygen content than what would be delivered by a fully separated four-chambered heart. During exercise, muscles require more oxygen for aerobic respiration to produce ATP. The frog’s circulatory system cannot meet this increased demand effectively. Consequently, frog muscles resort to anaerobic respiration more quickly, leading to lactic acid buildup and fatigue. This explains why frogs are adapted for short bursts of activity (like jumping to escape predators) rather than endurance activities like long-distance running that humans are capable of.
▶️ Answer/Explanation
(a) Plasma transports substances such as glucose from the intestine or liver to body cells, amino acids from the ileum or liver to body cells, fatty acids, vitamins, and minerals from the intestine to cells, hormones from endocrine glands to target organs, urea from the liver to the kidneys, carbon dioxide from cells to the lungs, antibodies to infection sites, and clotting proteins like fibrinogen to wounds.
Explanation: Plasma, the liquid component of blood, acts as a transport medium. It carries dissolved nutrients like glucose and amino acids from the digestive system to cells throughout the body for energy and growth. It also transports waste products: carbon dioxide from tissues to the lungs for exhalation, and urea from the liver to the kidneys for excretion. Hormones, chemical messengers produced by endocrine glands, travel in plasma to their target organs to regulate bodily functions. Additionally, plasma proteins have specific roles: antibodies help fight infection, and clotting proteins are essential for wound healing.
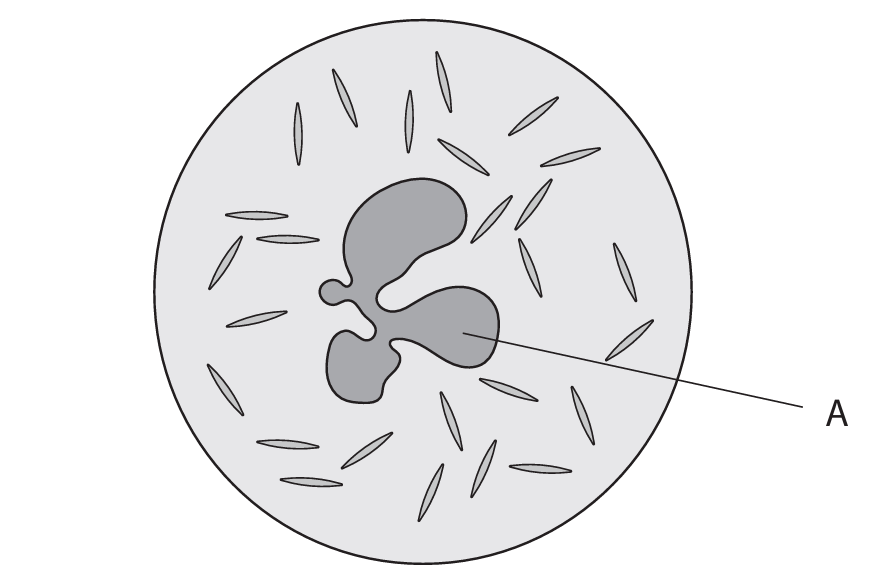
(b)(i) Magnification = approximately 4615
Explanation: To calculate magnification, you divide the measured diameter of the cell in the diagram by its actual diameter. Assuming the diagram’s cell diameter is measured as 60 mm (or 6 cm), the calculation is: Magnification = 60 mm / 0.013 mm ≈ 4615. This means the cell is drawn about 4615 times larger than its actual size. (Note: The exact value depends on the measured diagram diameter, and answers between 4307 and 4616 are typically accepted).
(b)(ii) Nucleus
Explanation: The structure labelled A is the nucleus. In a phagocyte (a type of white blood cell), the nucleus is often lobed or has multiple parts, which helps the cell to squeeze through small gaps in capillary walls to reach sites of infection.
(b)(iii) The phagocyte engulfs pathogens and digests them.
Explanation: Phagocytes defend the body by a process called phagocytosis. They first recognize and move towards foreign invaders like bacteria (a process called chemotaxis). Then, they extend their cell membrane around the pathogen to engulf it, forming a vesicle called a phagosome inside the cell. This phagosome then fuses with a lysosome, which contains powerful digestive enzymes. These enzymes break down and destroy the engulfed pathogen, effectively neutralizing the threat.
(c) Use the Biuret test.
Explanation: To test for the presence of protein in a plasma sample, you would use the Biuret test. This involves adding a solution of sodium hydroxide (NaOH) to the sample to make it alkaline, followed by a few drops of copper(II) sulfate solution. If protein is present, the mixture will change color from blue to a purple or violet hue. A positive Biuret test (the color change) confirms the presence of peptide bonds, which are characteristic of proteins. Alternatively, a test strip like an Albustix could be used, which also changes color in the presence of protein.
▶️ Answer/Explanation
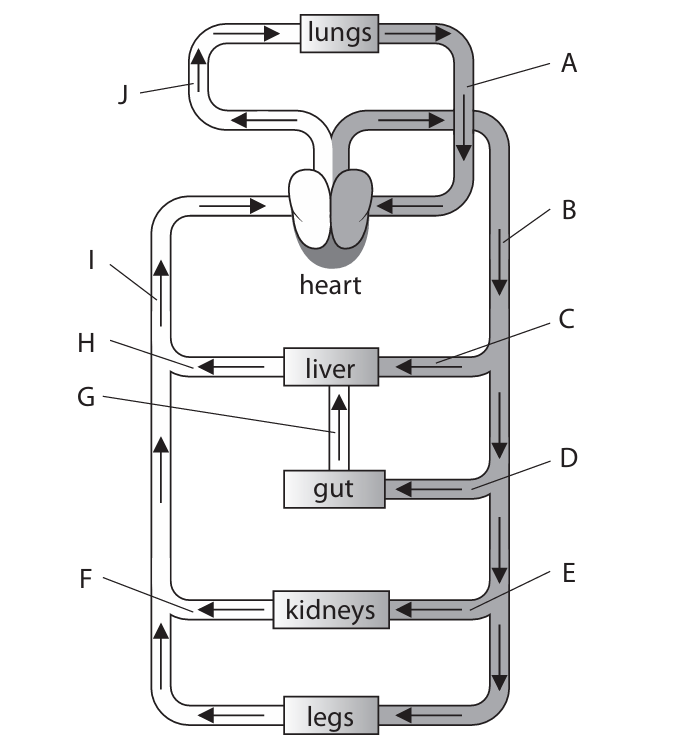
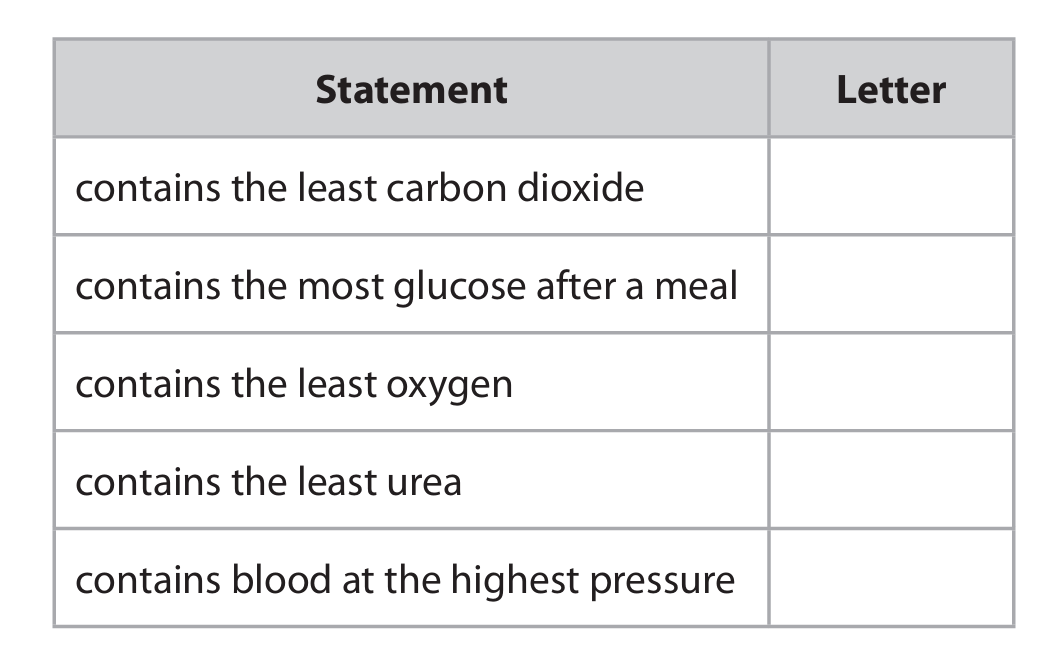
(a)(i)
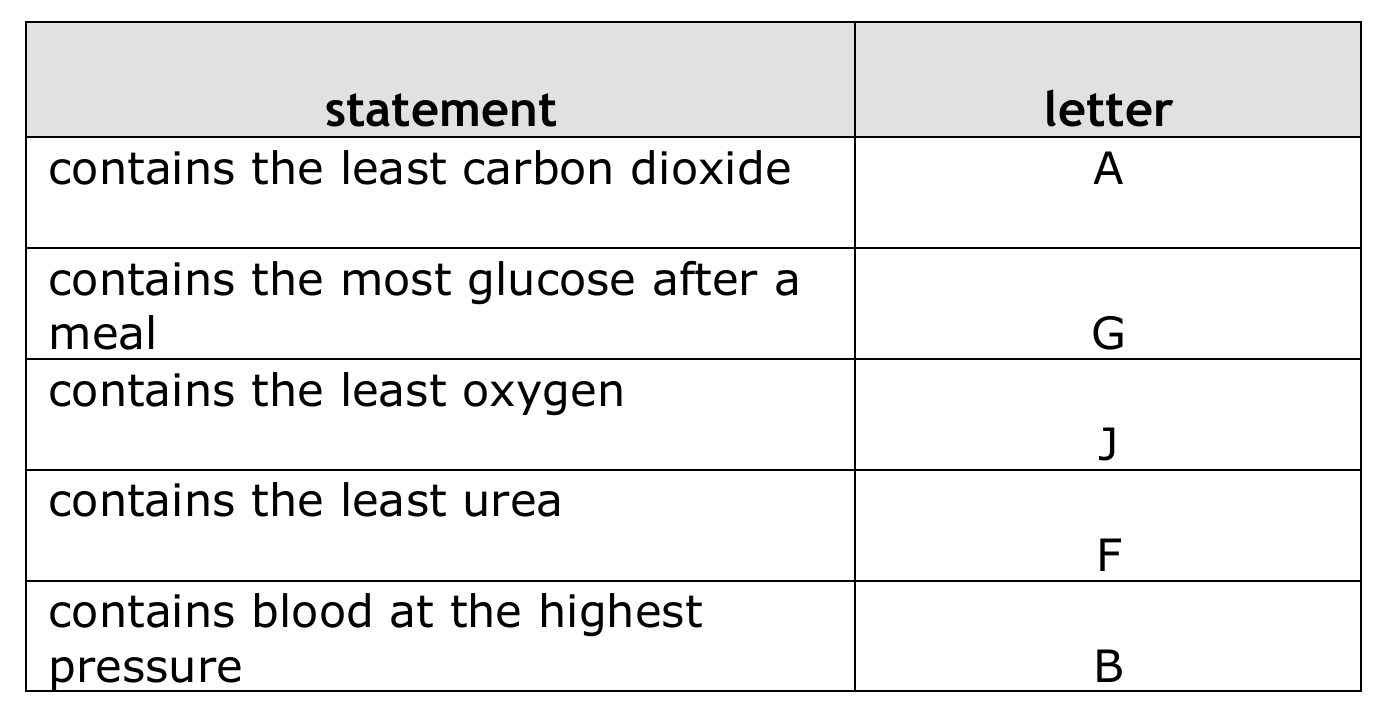
Explanation: To answer this, we need to understand the path of blood flow and the changes that occur in different vessels.
- Least Carbon Dioxide (A): This is likely a pulmonary vein, returning oxygenated blood from the lungs to the heart. It has just exchanged CO₂ for O₂ in the lungs, so its CO₂ content is minimal.
- Most Glucose after a meal (G): After a meal, the hepatic portal vein carries blood rich in absorbed nutrients, like glucose, from the digestive system to the liver.
- Least Oxygen (J): This is likely a pulmonary artery, carrying deoxygenated blood from the heart to the lungs. It has the lowest oxygen saturation.
- Least Urea (F): The renal vein carries blood away from the kidneys. The kidneys have filtered urea out of the blood, so the renal vein has a lower urea concentration than other veins.
- Highest Pressure (B): The aorta is the major artery leaving the heart. It receives blood directly from the left ventricle under high pressure, which is necessary to propel blood throughout the entire systemic circulation.
(a)(ii)
1 Blood vessel A has a thinner wall than blood vessel J.
2 Blood vessel A has a wider lumen than blood vessel J.
Explanation: Based on the roles identified in part (i), vessel A is a vein (e.g., pulmonary vein) and vessel J is an artery (e.g., pulmonary artery). Their structures are adapted to their functions:
- Walls: Arteries (J) have thick, muscular, and elastic walls to withstand high pressure and maintain blood pressure. Veins (A) have thinner walls because blood is under lower pressure.
- Lumen: Veins (A) often have a wider lumen to accommodate the slower flow of blood and facilitate the return of blood to the heart. Arteries (J) have a relatively narrower, more maintained lumen.
Other differences could include the presence of valves in veins (to prevent backflow) and more elastic tissue/muscle in arteries, but the two points listed are the primary structural distinctions.
(b)
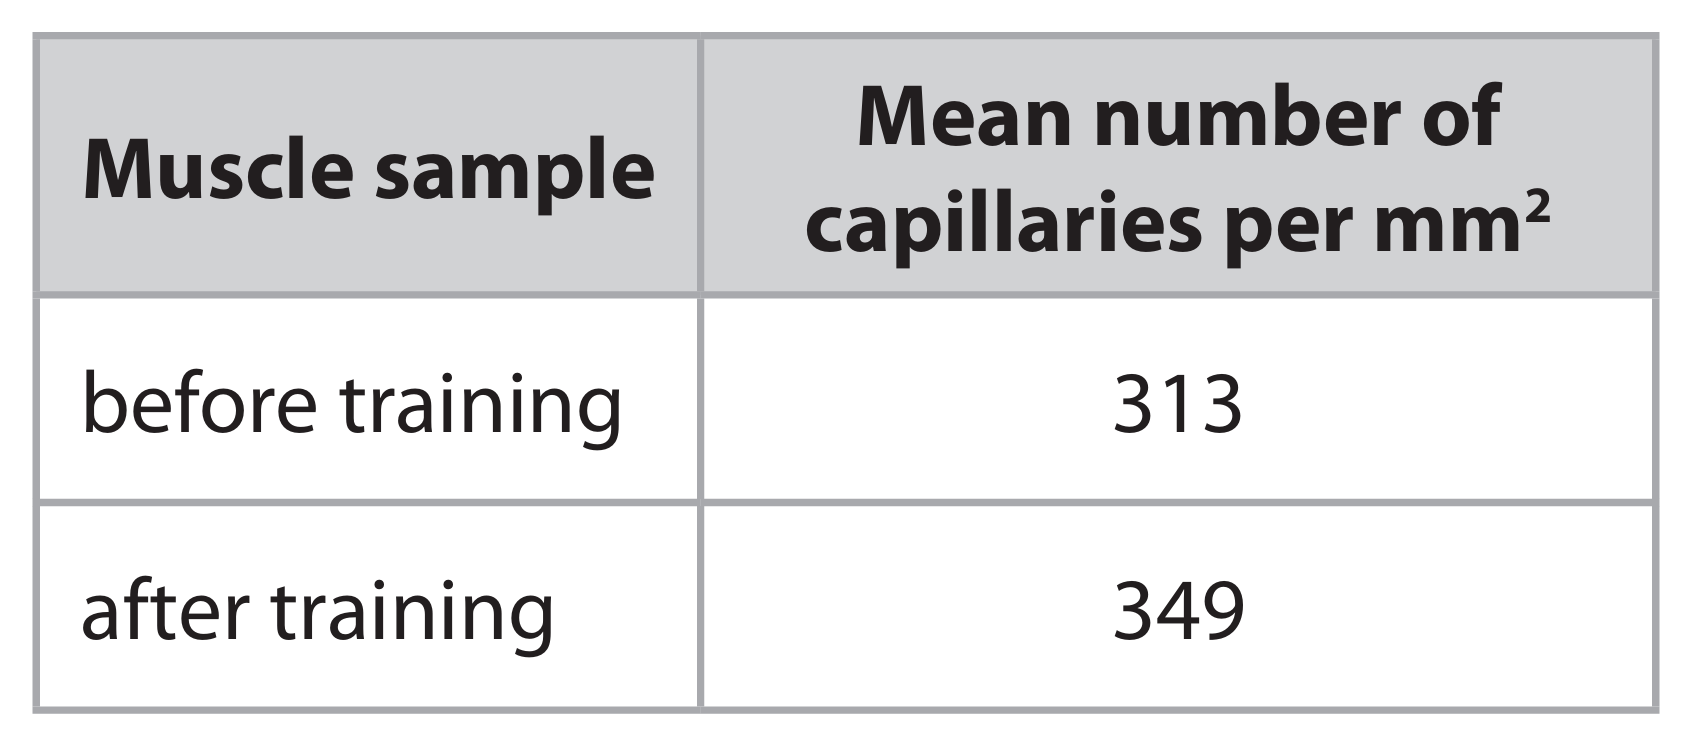
Discussion of the Scientist’s Conclusion:
The scientist’s data shows an increase in the mean number of capillaries per mm² from 313 to 349 after training. This supports the idea that training can induce physiological adaptations. Here is a discussion of the conclusion that this improves athletic performance:
Arguments Supporting the Conclusion:
- Enhanced Oxygen and Glucose Delivery: More capillaries mean a denser network for blood flow within the muscle. This reduces the diffusion distance for oxygen and glucose from the blood to the muscle cells. This is crucial for sustained aerobic respiration during exercise.
- Improved Waste Removal: A richer capillary bed also allows for more efficient removal of waste products like carbon dioxide and lactic acid, potentially reducing fatigue and muscle soreness.
- Increased Aerobic Respiration: With better oxygen and fuel supply, muscles can rely more on efficient aerobic respiration, producing more ATP (energy) and less lactic acid compared to anaerobic respiration.
- Beneficial for Endurance: These adaptations are particularly beneficial for long-distance or endurance athletic events where sustained energy production is key.
Limitations and Other Factors to Consider (Weakening the Conclusion):
- Correlation vs. Causation: The study shows a correlation between training and increased capillaries, but it doesn’t definitively prove that the capillary increase caused improved performance. Other factors changed by training (e.g., stronger heart, more mitochondria, improved lung capacity) also contribute significantly.
- Sample Size: The conclusion is based on data from a single athlete. To be more robust, the study should be repeated with a larger sample size to account for individual variation.
- Type of Performance: The adaptation might not improve all types of athletic performance equally. For short, powerful bursts of activity (e.g., weightlifting, sprinting) that rely on anaerobic respiration, an increased capillary density might be less critical.
- Other Influencing Factors: Athletic performance is complex and influenced by many other factors not measured here, such as diet, motivation, skill, nerve function, and the health of other organs like the heart and lungs.
Overall: While the increase in capillary density is a plausible adaptation that could contribute to improved athletic performance, especially in endurance sports, the scientist’s conclusion is an oversimplification. The evidence supports a positive physiological change, but it does not, on its own, conclusively prove that performance is improved, as many other variables are involved.

▶️ Answer/Explanation
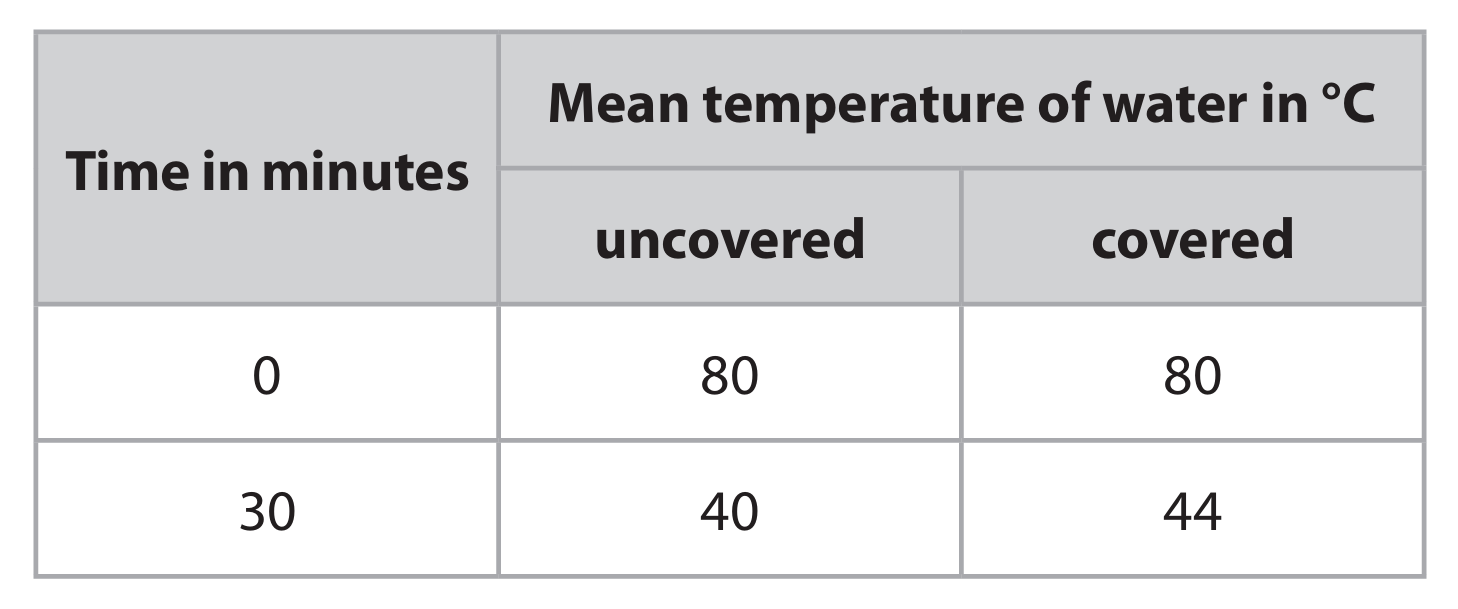
(a) Temperature
Explanation: The dependent variable is what is being measured in the experiment. In this case, the student is measuring how the temperature changes over time in both the covered and uncovered beakers. The temperature depends on whether the beaker is covered or not, making it the dependent variable in this investigation.
(b) To ensure a fair test by keeping the surface area and volume constant.
Explanation: Using the same volume of water (200 cm³) in each beaker ensures that the surface area to volume ratio remains constant. This is important because heat loss is affected by both volume and surface area. If different volumes were used, it wouldn’t be a fair comparison as the rate of heat loss would be influenced by the different volumes rather than just the covering condition.
(c) 5%
Explanation: Let’s calculate this step by step:
For the uncovered beaker:
Temperature decrease = 80°C – 40°C = 40°C
Percentage decrease = (40 ÷ 80) × 100 = 50%
For the covered beaker:
Temperature decrease = 80°C – 44°C = 36°C
Percentage decrease = (36 ÷ 80) × 100 = 45%
Difference = 50% – 45% = 5%
The uncovered beaker lost 5% more heat than the covered beaker over the 30-minute period.
(d) The conclusion has both supporting and limiting factors.
Explanation: While the results show that covering reduces heat loss (with the covered beaker maintaining 4°C higher temperature), suggesting animals might lose less heat indoors, there are several limitations to this conclusion:
- The difference is relatively small (only 5%), which may not be significant in real farming conditions
- This model oversimplifies real animals – animals can move, generate their own heat, and have fur or feathers for insulation
- Climate factors matter – in hot countries, keeping animals outdoors might actually be better to prevent overheating
- Other factors like disease spread (higher indoors), animal welfare, and feeding costs aren’t considered
- Animals kept indoors may use less energy maintaining body temperature, potentially allowing more energy for growth and production
(e) Use beakers/containers of different sizes with the same covering conditions.
Explanation: To investigate how body size affects heat loss, the student could modify the experiment by using beakers of different volumes (representing different body sizes) while keeping all other variables constant. For example, they could use 100 cm³, 200 cm³, and 300 cm³ beakers, all either covered or all uncovered, and measure the temperature decrease over the same time period. This would show how the surface area to volume ratio (which changes with size) affects the rate of heat loss, with smaller volumes (representing smaller animals) having a larger surface area to volume ratio and thus losing heat faster.

▶️ Answer/Explanation
(a)(i) Sickle shaped red blood cells stick to each other / caught / trapped in walls of blood vessels.
Explanation: In sickle cell anaemia, the red blood cells become rigid and crescent-shaped instead of being flexible and biconcave. These abnormally shaped cells are less flexible and can get stuck to each other or to the walls of small blood vessels. This creates blockages that restrict blood flow to various parts of the body, leading to pain and potential tissue damage.
(a)(ii) An explanation that includes:
- Cold temperatures reduce blood flow / cause more sickling
- Less oxygen at high altitude
- Less respiration / more anaerobic respiration
- More lactic acid
- Less energy / ATP
Explanation: Cold temperatures cause blood vessels to constrict, reducing blood flow and potentially triggering more red blood cells to sickle. At high altitudes, the lower oxygen concentration means less oxygen is available to tissues. This reduced oxygen supply leads to less efficient aerobic respiration in cells, forcing them to rely more on anaerobic respiration which produces lactic acid. The combination of reduced energy production (ATP) from less efficient respiration and the buildup of lactic acid exacerbates symptoms like tiredness and joint pain.
(b)(i) Only expressed when homozygous / two copies / no dominant allele present / not expressed in heterozygote.
Explanation: A recessive allele is one whose effect is masked or “hidden” when a dominant allele is present. For a recessive trait to be physically expressed in an individual, that person must inherit two copies of the recessive allele (one from each parent), making them homozygous recessive. If they have one dominant and one recessive allele (heterozygous), the dominant allele will determine the trait, and the recessive allele will not be visible but can be passed to offspring.
(b)(ii) 0.375 or 3/8 or 37.5%
Explanation: First, we need to find the probability of the child not having sickle cell anaemia. Since both parents are heterozygous (HbA Hbs), we can use a Punnett square:
Parental genotypes: HbA Hbs × HbA Hbs
Possible offspring genotypes:
- HbA HbA (normal) – 1/4 probability
- HbA Hbs (carrier, no disease) – 2/4 probability
- Hbs Hbs (sickle cell anaemia) – 1/4 probability
Probability of not having sickle cell anaemia = 1/4 + 2/4 = 3/4
Probability of being female = 1/2
Since these are independent events, we multiply the probabilities:
3/4 × 1/2 = 3/8 = 0.375 = 37.5%
(c) D protoctist
Explanation: Malaria is caused by parasites belonging to the genus Plasmodium, which are single-celled eukaryotic organisms classified as protoctists (or protists). These are not bacteria (which are prokaryotic), fungi, or plants. The Plasmodium parasite is transmitted to humans through the bite of infected Anopheles mosquitoes.
(d) B haemoglobin
Explanation: Haemoglobin is the iron-containing protein pigment found in red blood cells that gives them their characteristic red color. Its crucial function is to bind with oxygen in the lungs and transport it to tissues throughout the body, while also helping to carry some carbon dioxide back to the lungs. Chlorophyll is found in plants, iron is a mineral component of haemoglobin but not the pigment itself, and magnesium is not the primary pigment in red blood cells.
(e) Two differences:
- Red blood cells are smaller than white blood cells
- Red blood cells have no nucleus while white blood cells do
- Red blood cells are biconcave in shape while white blood cells are spherical or irregular
Explanation: Red blood cells (erythrocytes) and white blood cells (leukocytes) have distinct structural differences that relate to their different functions. Red blood cells are smaller and lack a nucleus, which allows more space for haemoglobin and makes them more flexible for moving through narrow capillaries. Their biconcave disc shape provides a large surface area for efficient gas exchange. In contrast, white blood cells are generally larger, have a nucleus (essential for their immune functions), and can change shape to engulf pathogens or move through tissues.
▶️ Answer/Explanation
(a)(i) D (trachea)
A is incorrect because it is not the bronchiole
B is incorrect because it is not the bronchus
C is incorrect because it is not the oesophagus
(a)(ii) B (pulmonary artery)
A is incorrect because it is not the aorta
C is incorrect because it is not the pulmonary vein
D is incorrect because it is not the vena cava
(a)(iii) A (contract, contract)
B is incorrect because the external intercostals do not relax
C is incorrect because the diaphragm does not relax
D is incorrect because the diaphragm and the intercostals do not relax
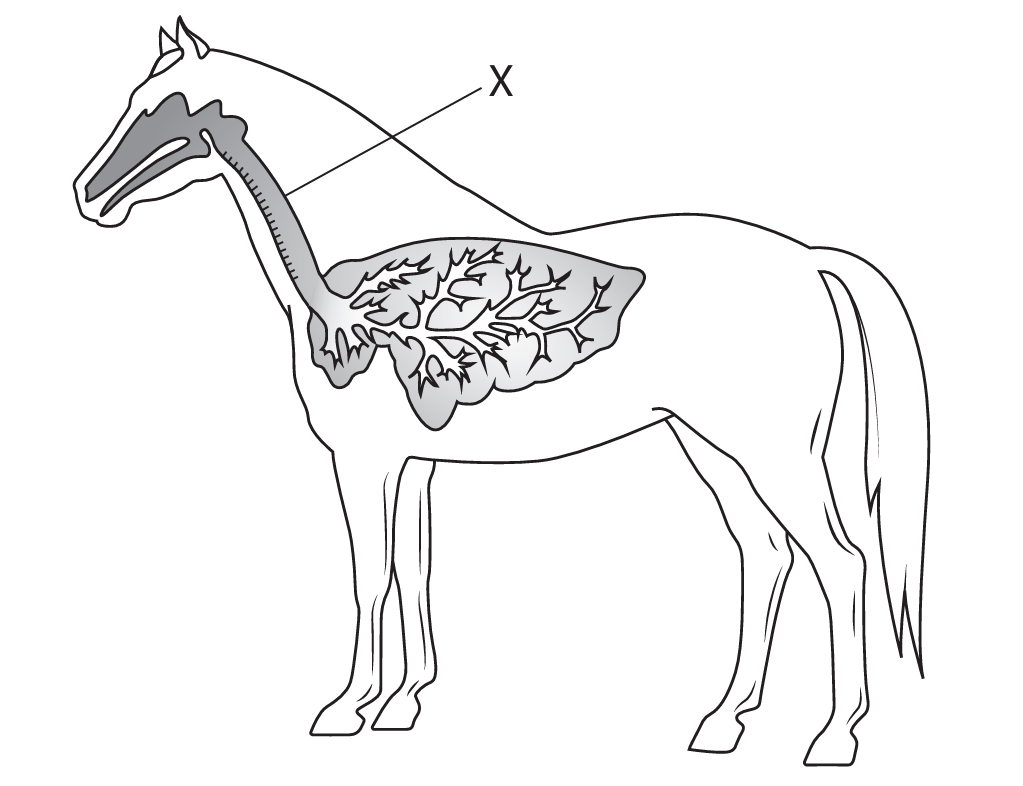
(b) An answer that makes reference to four of the following points:
• more blood to muscles / less blood to intestine (during exercise) / eq
• supply oxygen / oxygenated blood / glucose
• respiration
• energy / ATP
• muscle contraction
• less absorption of food / eq, in intestine when running /
Example full answer: When the horse runs, a much greater percentage of its total blood flow is directed to the leg muscles (increasing from 15% to 82%) to supply oxygen and glucose for aerobic respiration, which releases energy (ATP) for muscle contraction. Conversely, blood flow to the intestine decreases sharply (from 30% to 3%) because processes like digestion and absorption of food are less critical during intense physical activity. This redistribution ensures that the working muscles receive the oxygen and nutrients they need.
(c) An explanation that makes reference to two of the following points:
• (supply (more)) oxygen / there was a shortage of oxygen
• breakdown / remove lactic acid
• repay oxygen debt
• anaerobic respiration had occurred
Example full answer: The horse continues to breathe faster and deeply after running to repay an oxygen debt. During intense exercise, some muscles respire anaerobically, producing lactic acid. The continued high rate of breathing supplies extra oxygen to break down this lactic acid and to fully oxidise the remaining respiratory substrates.
▶️ Answer/Explanation
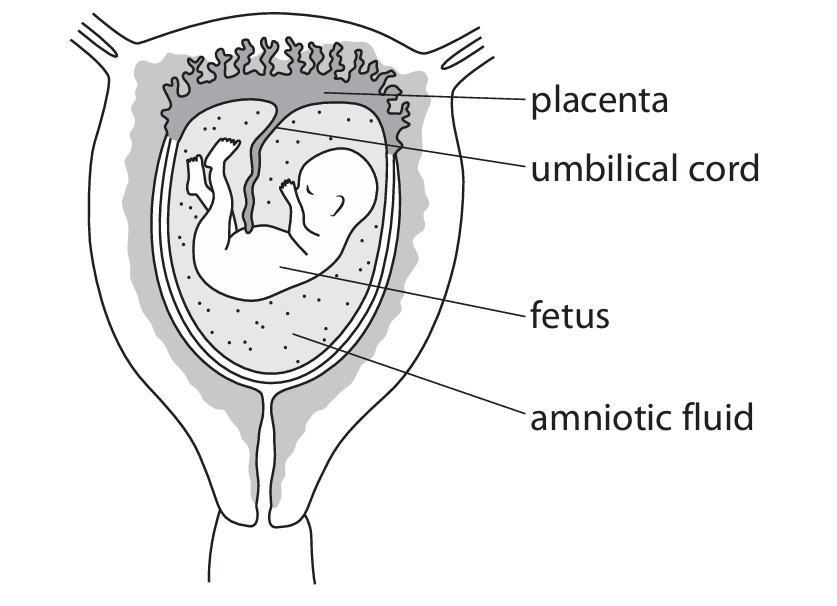
(a)(i) An explanation that makes reference to three of the following points:
• oxygen
• glucose
• respiration
• energy / ATP
Example answer: The blood contains glucose and oxygen. These are used by the fetus’s cells in respiration to release energy in the form of ATP. This ATP provides the energy required for active transport processes to occur.
(a)(ii) An explanation that makes reference to two of the following points:
• antibodies (from mother)
• (bind to) antigens
• to kill bacteria / pathogen / virus eq
Example answer: Antibodies from the mother’s blood cross the placenta. These antibodies bind to antigens on pathogens, marking them for destruction or neutralizing them, which helps protect the fetus from infection.
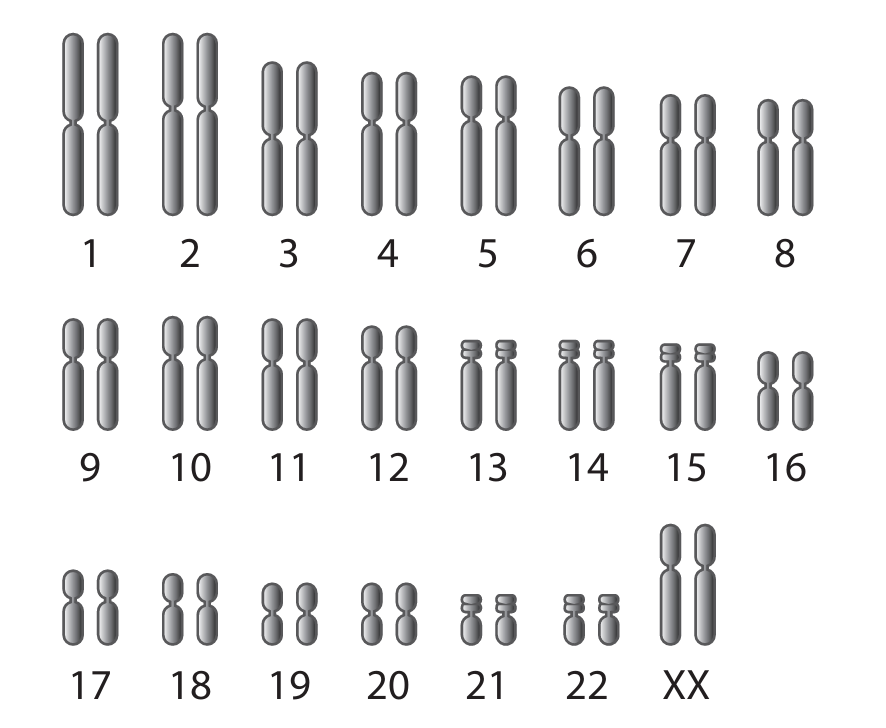
(b) An answer that makes reference to two of the following points:
• fetus is female / a girl
• cells contain 46 chromosomes / 23 pairs / has a diploid number / has two sets of chromosomes / normal number of chromosomes / eq
• chromosomes have different lengths / sizes / shapes
Example answer: 1. The fetus is female because the sex chromosomes are XX. 2. The cell has the normal diploid number of 46 chromosomes (23 pairs).
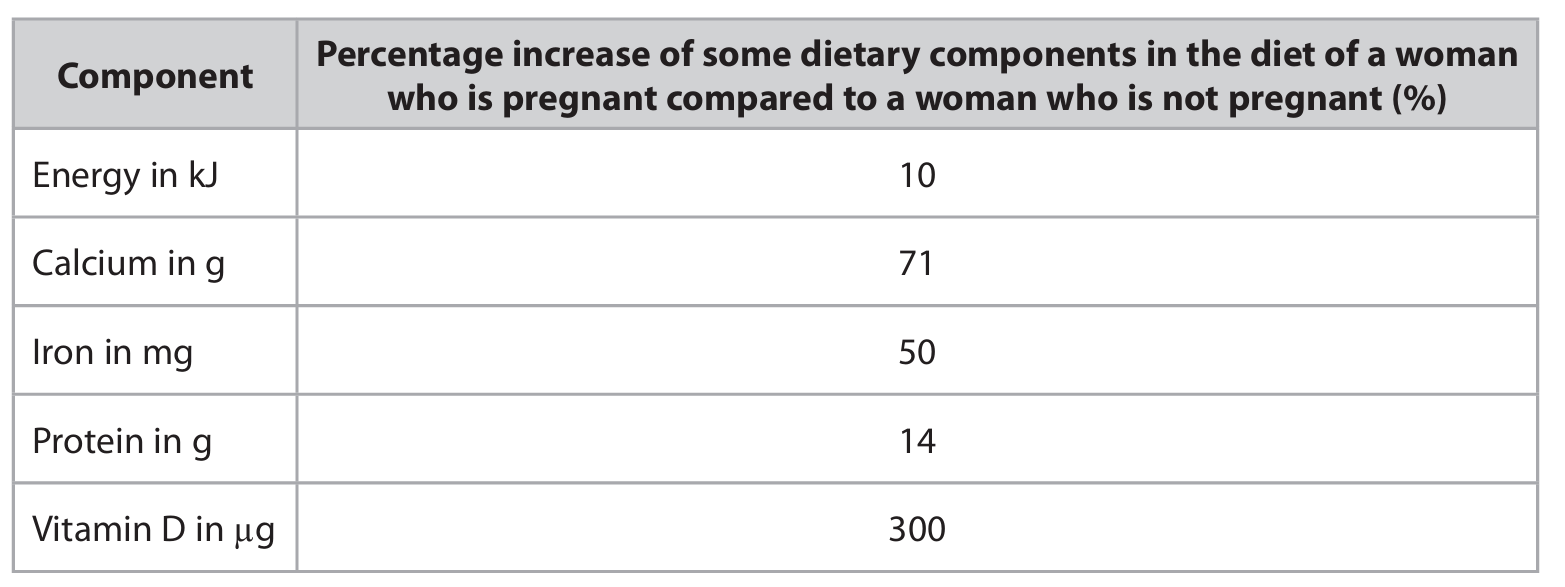
(c)(i) An answer that makes reference to four of the following points:
• calcium for bone / teeth growth / bone / teeth development / prevent rickets
• protein to grow / for enzymes / antibodies / eq
• iron for haemoglobin / red blood cells / prevent anaemia
• vitamin D for bone growth / bone development / calcium absorption / strong bones
• more energy as baby is heavy / mother becomes heavy / more energy for fetal development / to carry baby / eq
Example answer: Extra calcium and vitamin D are required for the development of the fetus’s bones and teeth. Additional iron is needed to make haemoglobin for the increased blood volume and to prevent anaemia. More protein is required for the growth of fetal tissues and the production of enzymes and antibodies. Increased energy is needed as the mother’s body works harder and carries extra weight.
(c)(ii)
• \(9.0 \text{ mg} = 50\%\) more
• \(100\% = 9.0 \times 2 = 18 \text{ mg}\)
• Total needed \(= 18 + 9 = 27 \text{ mg}\)
Award full marks for correct numerical answer without working.
Final Answer: \(27 \text{ mg}\)

Most-appropriate topic codes (Edexcel IGCSE Biology):
• 6(a): Use of biological resources – Food production (Micro-organisms) — parts (d)(i), (d)(ii), (d)(iii)
• 3(h): Transport in humans – role of plasma/antibodies — part (b)
• Appendix 5: Suggested practical investigations — part (a)
▶️ Answer/Explanation
(a) Use the biuret test. Add equal volumes of biuret reagent to equal volumes of cow’s milk and human milk. The sample that develops a deeper/darker purple color contains more protein.
Explanation: The biuret test is a chemical test used to detect the presence of proteins. When biuret reagent (which contains copper sulfate in an alkaline solution) is added to a sample containing protein, it reacts with peptide bonds to produce a violet-purple color. The intensity of this color is proportional to the protein concentration. Since cow’s milk has a higher protein content (3.3 g) than human milk (1.3 g) for the same volume, the cow’s milk sample will show a more intense purple color when the same volume of biuret reagent is added to the same volume of each milk sample.
(b) Antibodies in milk help protect babies from infections by destroying pathogens like viruses and bacteria, providing passive immunity.
Explanation: Antibodies are specialized proteins that identify and neutralize foreign invaders like bacteria and viruses. When a baby consumes milk containing antibodies (especially colostrum, the first milk), these antibodies are absorbed in the baby’s gut and enter the bloodstream. They provide “passive immunity,” meaning the baby gains immediate, short-term protection against diseases that the mother has immunity to, before the baby’s own immune system is fully developed.
(c) Two ways are:
- As a source of energy for respiration.
- As an energy store.
Explanation: Lipids (fats) are a concentrated energy source. Babies have high energy demands for rapid growth and development. The lipids in milk are broken down to release energy through metabolic processes like respiration. Additionally, any excess energy from lipids can be stored in the body’s adipose tissue as a reserve for future use. Lipids are also important for insulating the body and for the development of the nervous system, including the myelin sheath that insulates nerve cells.
(d)(i) Lactose.
Explanation: Lactose is the main carbohydrate (a disaccharide sugar) found in milk. It is the primary food source for the bacteria used in yoghurt production.
(d)(ii) Lactobacillus or Streptococcus.
Explanation: These are the genera of bacteria commonly used in yoghurt production. They are lactic acid bacteria that ferment the lactose in milk.
(d)(iii) The milk is heated to a high temperature to kill any harmful bacteria (pathogens) present and to sterilize/pasteurize the milk, preventing competition for the added bacteria.
Explanation: The initial heating step serves two main purposes. Firstly, it acts as a pasteurization or sterilization process, eliminating potentially harmful microorganisms (pathogens) that could cause spoilage or disease. Secondly, by removing these competing microorganisms, it ensures that the specific yoghurt-making bacteria (Lactobacillus or Streptococcus) added later can grow without competition, fermenting the lactose efficiently to produce lactic acid, which gives yoghurt its characteristic tangy flavor and thick texture.
▶️ Answer/Explanation
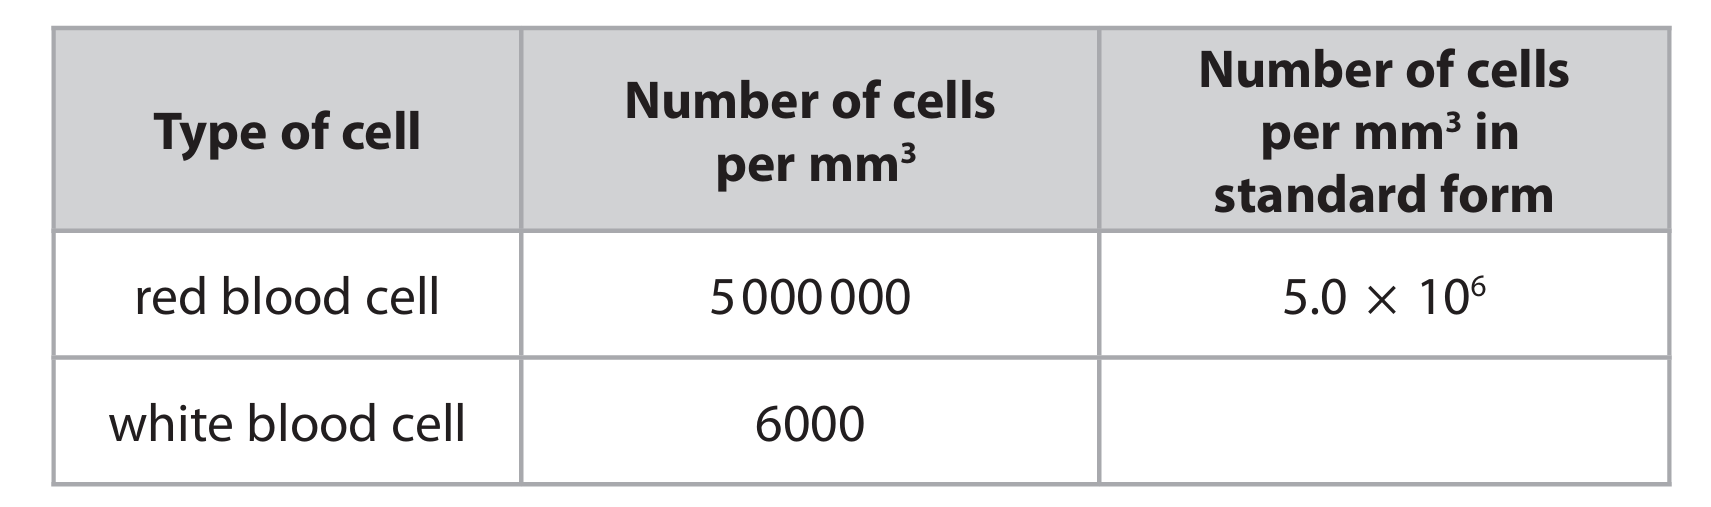
(a)(i) 6.0 × 10³
Explanation: To convert 6000 into standard form, we move the decimal point three places to the left, resulting in 6.0. Since we moved the decimal point three places, we multiply by 10 raised to the power of 3. Therefore, 6000 in standard form is 6.0 × 10³.
(a)(ii) D 5.0 × 10¹²
Explanation: First, we need to know the volume conversion. There are 1000 mm3 in 1 cm3. Therefore, 1000 cm3 is equal to 1000 × 1000 = 1,000,000 mm3 (or 106 mm3). The number of red blood cells per mm3 is 5.0 × 10⁶. To find the total number in 106 mm3, we multiply: (5.0 × 10⁶ cells/mm3) × (106 mm3) = 5.0 × 10¹² cells.
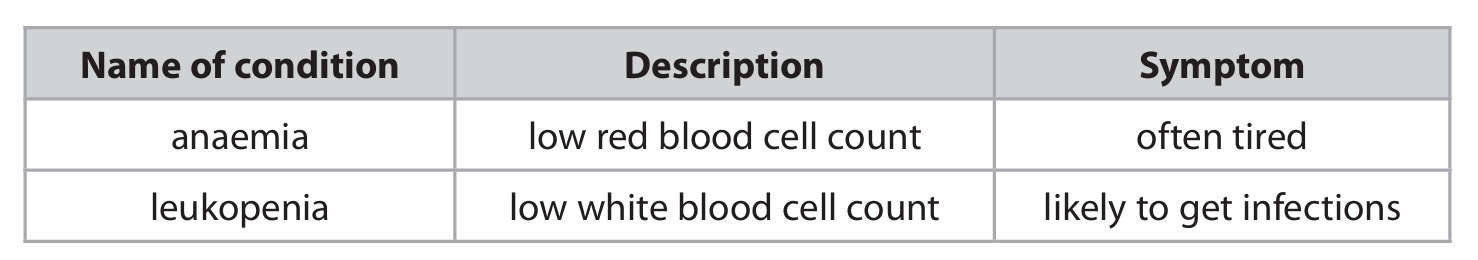
(b)(i) Red blood cells contain haemoglobin, which carries oxygen. A low red blood cell count (anaemia) means less haemoglobin is available to transport oxygen to the body’s tissues. Muscles and organs require oxygen for aerobic respiration to release energy (in the form of ATP). With less oxygen delivered, the rate of respiration decreases, leading to less energy being produced. This lack of energy causes the person to feel tired and fatigued.
(b)(ii) White blood cells are crucial components of the immune system. A low white blood cell count (leukopenia) means the body has fewer of these defence cells. Specifically, there are fewer phagocytes to engulf and digest pathogens (like bacteria and viruses) through phagocytosis, and fewer lymphocytes to produce antibodies that neutralise pathogens or mark them for destruction. With this weakened immune response, the body is less able to fight off invading microorganisms, making the person more susceptible to infections.


▶️ Answer/Explanation
(a) Control the movement (of substances) in/out of the cell.
Explanation: The cell membrane, also known as the plasma membrane, acts as a selective barrier. It regulates the passage of substances such as nutrients, ions, and waste products, allowing essential molecules to enter the cell while keeping harmful ones out. This maintains the internal environment necessary for the cell’s survival and function.
(b) 6.9 / 6.91 / 6.908 mm²
Explanation: First, we calculate the original area of the lumen. The diameter is 4.0 mm, so the radius \( r \) is half of that, which is 2.0 mm. Using the formula for the area of a circle, \( \pi r^2 \), and given \( \pi = 3.14 \), the original area is \( 3.14 \times (2.0)^2 = 3.14 \times 4 = 12.56 \, \text{mm}^2 \).
The fatty deposit covers 45% of this area, meaning the area available for blood flow is the remaining 55%. So, we calculate 55% of the original area: \( 0.55 \times 12.56 = 6.908 \, \text{mm}^2 \). Rounded appropriately, this gives an area of approximately 6.9 mm².
(c)(i) A bar chart with the following features:
- S: y-axis linear and uses at least half the grid.
- L: labelled bars drawn for each cholesterol concentration range.
- A1: y-axis labelled “Number of men”.
- A2: x-axis labelled “Cholesterol concentration in mg/cm³” or similar.
- P: bar heights correct (within half a small square of the correct value).
Explanation: A bar chart is the most suitable way to represent this categorical data. The x-axis should show the different ranges of cholesterol concentration, and the y-axis should show the number of men in each range. Each bar’s height corresponds to the frequency (number of men) for that specific cholesterol range. The axes must be clearly labelled, and the scale should be chosen to make good use of the graph paper.
(c)(ii) C 160 to 199
Explanation: The mode is the value that appears most frequently in a data set. In this context, it’s the cholesterol range with the highest number of men. Looking at the table, the range 160 to 199 mg per cm³ has 442 men, which is the highest frequency among all the groups.
(c)(iii) 15.3% (accept 15.28%, 15.276%, or 15%)
Explanation: First, identify the men at higher risk. These are the men in the ranges greater than 239 mg per 100 cm³, which correspond to the ranges 240-279, 280-319, 320-359, and 360-399. Adding these up: 115 + 34 + 9 + 5 = 163 men.
Next, find the total number of men in the sample: 13 + 150 + 442 + 299 + 115 + 34 + 9 + 5 = 1067 men.
Finally, calculate the percentage: \( \frac{163}{1067} \times 100 \approx 15.28\% \).
(d) Discussion points include:
- The statin group shows a lower percentage of heart attacks (2.2%) than the control group (3.8%), which supports the claim.
- However, the conclusion might be limited because only one type of statin was tested.
- The study lasted only four years; long-term effects are unknown.
- The difference could be due to chance, and we don’t know the sample size to assess significance.
- The groups might not have been matched for other factors affecting heart disease risk (e.g., diet, exercise, age, genetics, pre-existing conditions).
Explanation: While the data suggests a benefit from statins, a critical evaluation is needed. The observed reduction in heart attacks is promising, but the study’s design limits the strength of the conclusion. Without knowing if the groups were identical in all other relevant aspects (like lifestyle and genetics), we cannot be sure the result is solely due to the statin. Furthermore, the duration of the study and the testing of only one specific statin mean the findings cannot be broadly generalized without further research.
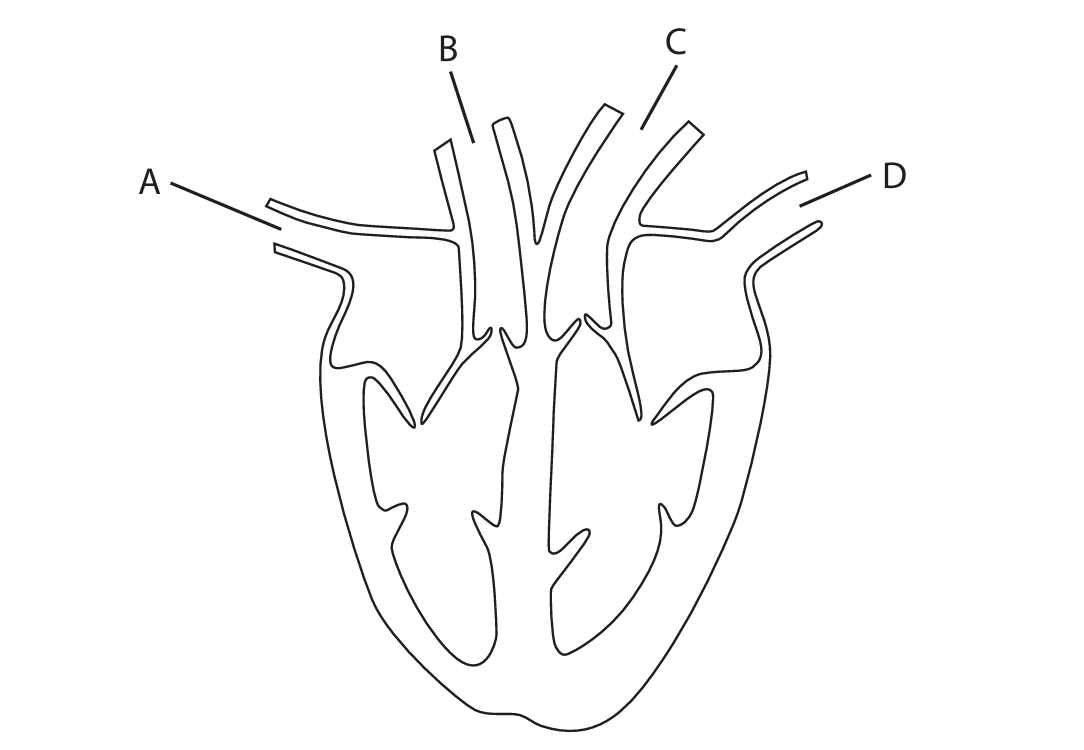
▶️ Answer/Explanation
(a)(i) D
Explanation: The blood vessel that brings oxygenated blood to the heart is the pulmonary vein. In a standard heart diagram, this is typically the vessel labelled D, which carries oxygen-rich blood from the lungs back to the left atrium.
(a)(ii) C
Explanation: The blood vessel with the highest pressure is the aorta. This is the main artery (labelled C) that carries oxygenated blood from the left ventricle to the rest of the body. The left ventricle has the thickest muscular wall, enabling it to generate the highest pressure to pump blood throughout the entire systemic circulation.
(b)(i)
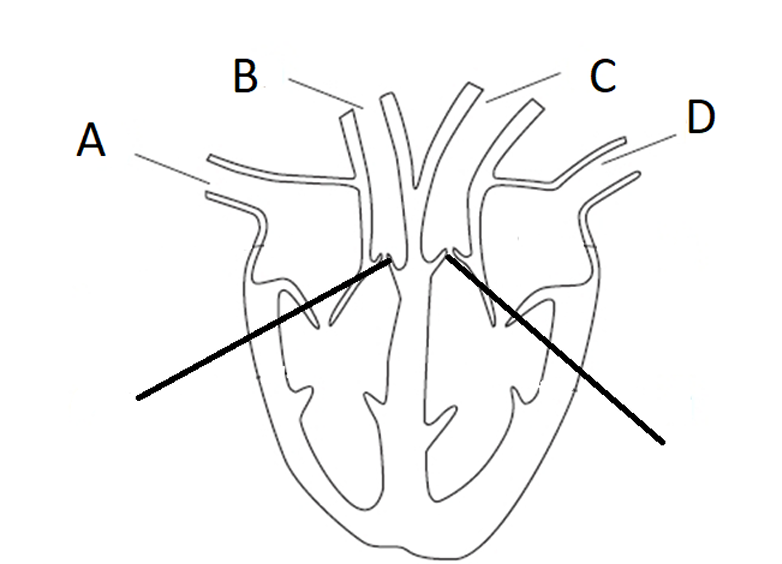
Explanation: A label line should be drawn pointing to the base of either the aorta or the pulmonary artery, where these vessels exit the ventricles. These are the locations of the semi-lunar valves.
(b)(ii)
Explanation: The primary function of the semi-lunar valves is to prevent the backflow of blood. After the ventricles contract and pump blood into the arteries (aorta and pulmonary artery), these valves snap shut. This ensures that blood flows in only one direction—away from the heart—and does not leak back into the ventricles when they relax.
(c)(i)
Explanation: The hole, known as the foramen ovale, normally closes before birth because the baby’s lungs begin to function. Once the baby takes its first breath, the lungs expand, and blood is sent to the lungs to be oxygenated. The hole closes to separate the oxygenated blood (on the left side of the heart, going to the body) from the deoxygenated blood (on the right side, going to the lungs). This separation is crucial for efficient oxygenation of the blood supplying the body’s tissues.
(c)(ii)
Explanation: If the hole fails to close, a condition known as a patent foramen ovale (PFO) occurs. This allows oxygenated and deoxygenated blood to mix within the heart. As a result, the blood pumped to the body contains less oxygen than normal. This can lead to symptoms such as bluish skin discoloration (cyanosis), shortness of breath, and fatigue, as the body’s tissues do not receive enough oxygen for efficient aerobic respiration and energy production. In severe cases, it can impact the baby’s growth and development.