▶️ Answer/Explanation
(a) An answer that makes reference to one of the following points:
• maintenance of constant (internal) conditions in body / eq (1)
• control / regulating / maintaining internal conditions / eq (1)
• control / regulating / maintaining internal environment / eq (1)
• keeping conditions in body the same / within a (narrow) range / eq (1)
(b) • 250 (1)
Calculation: \( \frac{300000}{1200} = 250 \)
(c)(i) A (cell wall and cytoplasm only)
B is not the answer as bacteria do not have nuclei
C is not the answer as bacteria do not have nuclei
D is not the answer as bacteria do not have nuclei
(c)(ii) An explanation that makes reference to the following points:
1. fertilisers / animal waste / minerals / nitrates / phosphates (run off / leach) / eq (1)
2. algal growth / eutrophication / eq (1)
3. less light (penetrates) / competition for light / less photosynthesis / eq (1)
4. decomposition / decay (of dead algae / plants / organisms / organic waste / manure / faeces / sewage) eq (1)
5. less oxygen / only anaerobic species grow / eq (1)
6. bacteria respire / other species cannot respire / reduced respiration / eq (1)
7. pesticides kill organisms / eq (1)
(d)(i) An answer that makes reference to one of the following points:
• eggs / ova / follicles, do not mature / do not grow / eq (1)
• (FSH is required to) mature eggs / ova / follicles (1)
• (low FSH leads to) less oestrogen / (FSH) stimulates oestrogen release (1)
(d)(ii) An answer that makes reference to one of the following points:
• no ovulation occurs / egg not released / ova not released / eq (1)
• LH / it stimulates ovulation / LH / it stimulates egg release / eq (1)
• (lower LH leads to) less progesterone / LH / it stimulates progesterone (1)
(e)(i) An explanation that makes reference to two of the following points:
• less water absorbed / less water enters blood / less water enters capillaries / eq (1)
• (water moves by) osmosis (1)
• water potential in blood is high(er) / water potential in gut / faeces / lumen is low(er) / eq (1)
(e)(ii) An explanation that makes reference to three of the following points:
1. mutation (1)
2. (only resistant bacteria) survive / are not killed / non-resistant bacteria die / eq (1)
3. bacteria reproduce / multiply / eq (1)
4. pass on allele / gene / mutation / eq (1)
(f)(i) An explanation that makes reference to two of the following points:
• (denitrifying bacteria convert) nitrate into nitrogen (1)
• so less eutrophication / less algal growth / more oxygen in river / lower BOD / eq (1)
• wood chips have large surface area (for bacteria) / wood chips are biodegradable (so do not pollute) / eq (1)
(f)(ii) An explanation that makes reference to two of the following points:
1. trees / roots absorb water / trees intercept water / eq (1)
2. (more) transpiration (1)
3. less runoff / slows down water flow / more soil permeability / more infiltration / eq (1)
4. less soil erosion / roots hold onto soil / roots stabilise soil / eq (1)
5. rivers do not get blocked (with soil) / eq (1)
▶️ Answer/Explanation
(a) An explanation that makes reference to two of the following:
- (number / amount / how many / range) the different species / eq (1)
- number / abundance / how many of each species / eq (1)
- variation / variety (of organisms) (in an ecosystem) / eq (1)
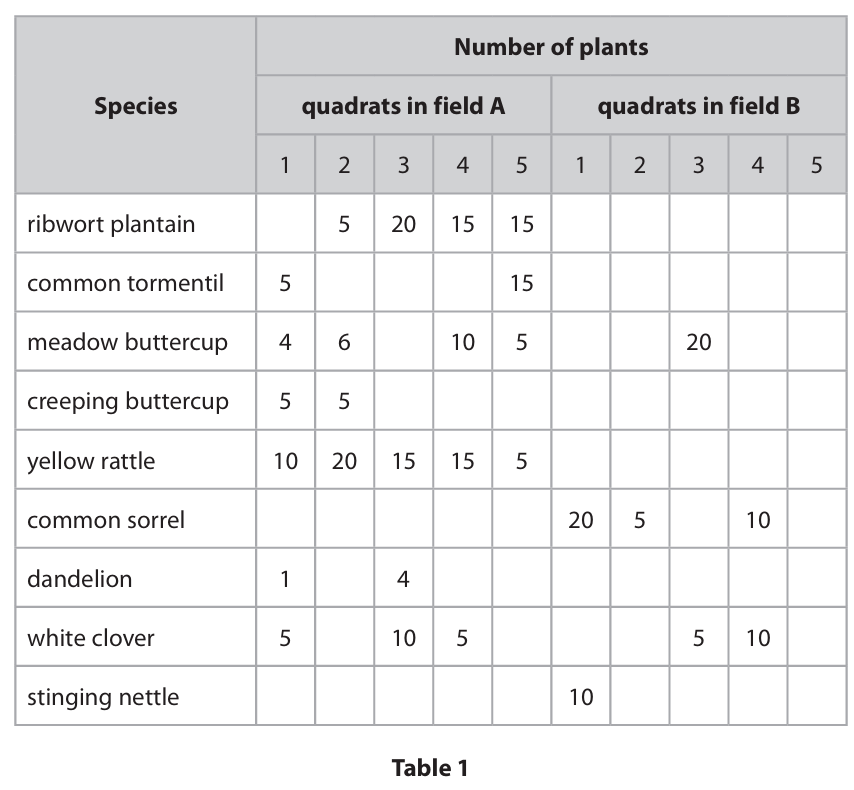
(b)(i) A description that makes reference to the following:
- place at random / eq (1)
- (place quadrats at) co-ordinates / eq (1)
Use random coordinates = 2 marks
(b)(ii) Calculation:
Most frequently occurring species in field B: common sorrel
Total plants counted: \(20 + 5 + 10 = 35\)
Total area sampled: \(5 \times (0.5 \times 0.5) = 5 \times 0.25 = 1.25 \text{ m}^2\)
Number per square metre: \(35 \div 1.25 = 28 \text{ per m}^2\)
Answer: 28
(b)(iii) meadow buttercup (1)
(b)(iv) An answer description that makes reference to five of the following:
- more species present / eq (1)
- more even distribution / similar numbers of each / eq (1)
- common sorrel / stinging nettles absent / eq (1)
- more biodiversity / grazing increases biodiversity / eq (1)
- reliable / repeated / more than one quadrat done in each field / eq (1)
- no information on water / sunlight / temperature / fertilisers / minerals / seasons / eq (1)
- only done on one field / repeat in other fields / eq (1)
- no information about amount of animals / age of animals / duration / eq (1)
- grazing reduces competition allows different species to grow / prevents succession / eq (1)
- grazing provides increased nitrates / minerals / manure / eq (1)
▶️ Answer/Explanation
(a) B (1 and 3 only)
A is incorrect as yeast has no nervous system
C is incorrect as yeast has no nervous system
D is incorrect as yeast has no nervous system
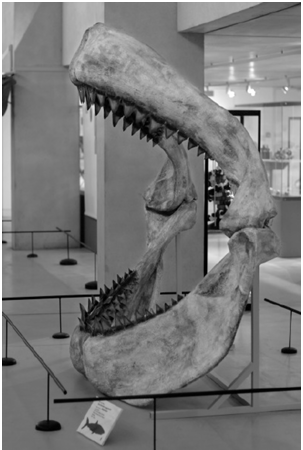
(b) An explanation that makes reference to three of the following:
• competition (between megalodon and whales) (1)
• whales ate more food / eq (1)
• whales better adapted / swam faster / better at feeding / better at hunting / eq (1)
• whales survived / eq (1)
• whales reproduced more / had more offspring / eq (1)
Accept less food left for megalodon / no food / megalodon starve. Accept megalodon less well adapted. Accept megalodon did not survive/died (out). Ignore extinct.
(c) (i) A description that makes reference to two of the following:
• acid rain (1)
• deforestation / death of trees / death of plants / eq (1)
• death of fish / death of animals in lakes / loss of species in lakes or rivers / eq (1)
Accept sulphuric acid. Accept damages plants/trees. Accept loss of food chains/biodiversity.
(ii) An explanation that makes reference to three of the following:
• (less) photosynthesis (1)
• so less glucose / sugar / starch / eq (1)
• fewer producers / fewer plants / less mass of producers / producers die / plants do not grow as much / eq (1)
• less food for consumers / less energy for consumers / eq (1)
Ignore ‘cannot produce food’ for mp2. Accept fewer consumers/herbivores/carnivores.
(d) (i) An answer that makes reference to two of the following:
• prevents osmosis / less osmosis (1)
• so water will not enter cells / eq (1)
• so cells do not burst / eq (1)
Accept osmosis would occur if in water. Accept cells burst if in water.
(ii) A description that makes reference to four of the following:
• place diploid nucleus into enucleated egg cell / place body cell nucleus into enucleated egg cell / eq (1)
• electric shock / eq (1)
• mitosis / cell division / eq (1)
• place embryo into uterus / womb (1)
• of surrogate (mother) (1)
Accept fuse body cell with enucleated egg. Accept empty egg cell for enucleated egg cell.
(e) A description that makes reference to three of the following:
Negative:
• mammoth population increases / over-population occurs / eq (1)
• mammoth eats too much food / less food for other species / eq (1)
Positive:
• less global warming / less greenhouse effect / eq (1)
• decomposition of faeces / decay of dead mammoths (1)
• more amino acid / protein / DNA / chlorophyll synthesis in plants / eq (1)
• (soil nutrients means) more plants / increased plant growth / eq (1)
Accept high mammoth reproduction rate. Accept overeats prey / prey could go extinct. Accept less greenhouse gas. Accept better plant growth.
▶️ Answer/Explanation
(a) B (1 and 3 only)
A is incorrect as yeast has no nervous system
C is incorrect as yeast has no nervous system
D is incorrect as yeast has no nervous system
(b) An explanation that makes reference to three of the following:
• competition (between megalodon and whales) (1)
• whales ate more food / eq (1)
• whales better adapted / swam faster / better at feeding / better at hunting / eq (1)
• whales survived / eq (1)
• whales reproduced more / had more offspring / eq (1)
Accept less food left for megalodon / no food / megalodon starve. Accept megalodon less well adapted. Accept megalodon did not survive/died (out). Ignore extinct.
(c) (i) A description that makes reference to two of the following:
• acid rain (1)
• deforestation / death of trees / death of plants / eq (1)
• death of fish / death of animals in lakes / loss of species in lakes or rivers / eq (1)
Accept sulphuric acid. Accept damages plants/trees. Accept loss of food chains/biodiversity.
(ii) An explanation that makes reference to three of the following:
• (less) photosynthesis (1)
• so less glucose / sugar / starch / eq (1)
• fewer producers / fewer plants / less mass of producers / producers die / plants do not grow as much / eq (1)
• less food for consumers / less energy for consumers / eq (1)
Ignore ‘cannot produce food’ for mp2. Accept fewer consumers/herbivores/carnivores.
(d) (i) An answer that makes reference to two of the following:
• prevents osmosis / less osmosis (1)
• so water will not enter cells / eq (1)
• so cells do not burst / eq (1)
Accept osmosis would occur if in water. Accept cells burst if in water.
(ii) A description that makes reference to four of the following:
• place diploid nucleus into enucleated egg cell / place body cell nucleus into enucleated egg cell / eq (1)
• electric shock / eq (1)
• mitosis / cell division / eq (1)
• place embryo into uterus / womb (1)
• of surrogate (mother) (1)
Accept fuse body cell with enucleated egg. Accept empty egg cell for enucleated egg cell.
(e) A description that makes reference to three of the following:
Negative:
• mammoth population increases / over-population occurs / eq (1)
• mammoth eats too much food / less food for other species / eq (1)
Positive:
• less global warming / less greenhouse effect / eq (1)
• decomposition of faeces / decay of dead mammoths (1)
• more amino acid / protein / DNA / chlorophyll synthesis in plants / eq (1)
• (soil nutrients means) more plants / increased plant growth / eq (1)
Accept high mammoth reproduction rate. Accept overeats prey / prey could go extinct. Accept less greenhouse gas. Accept better plant growth.
▶️ Answer/Explanation
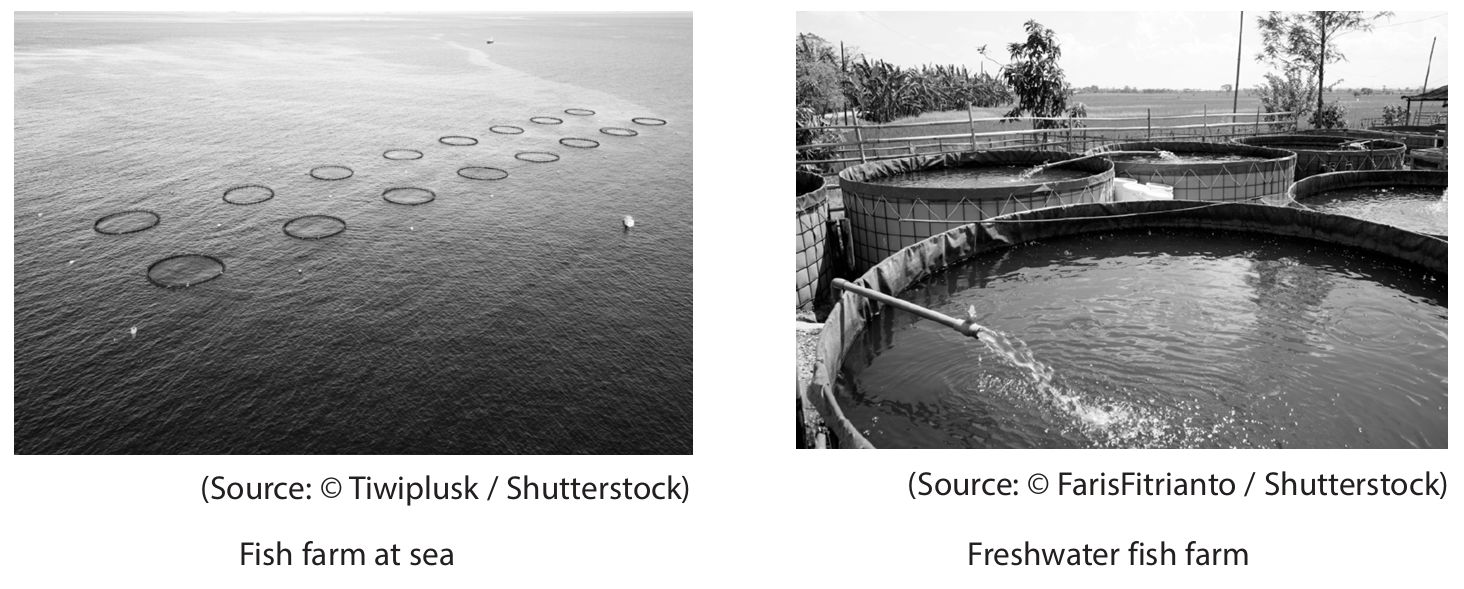
(a) • drowning / being washed overboard / sinking / storms / (bad) weather / attacked / killed by sharks by predators / eq (1)
(b) An explanation that makes reference to three of the following points: (3)
1. only based on forecasts / model / not happened yet / can’t predict future / 30 years is a long way off / not guaranteed / eq (1)
2. other (scientists) have different view / only an opinion / government policy may change / eq (1)
3. amount of sea farms may change / may not work / unproven / untested / eq (1)
4. peoples’ tastes may changes / diet / choices / demand for fish may change / eq (1)
5. effect of climate change / sea temperature rising / levels rising / global warming /eq (1)
6. effect of pollution / eq (1)
(c) An explanation that makes reference to three of the following points: (3)
1. (fish) faeces / waste / uneaten food /eq (1)
2. nitrate / phosphate levels increase / eq (1)
3. leads to algal growth / eutrophication / (eq)
4. less oxygen (for respiration)/ oxygen used (by bacteria) / eq (1)
5. chemicals / hormones /eq (1)
6. bacteria / decomposers / eq (1)
(d)(i) A description that makes reference to two of the following points: (2)
1. pesticide / insecticide / fungicide / eq (1)
2. antibiotics / vaccinate fish / eq (1)
3. selective breeding / GM fish / eq (1)
4. separating / isolating diseased fish / removing sick / dead fish / eq (1)
5. low stocking density /eq (1)
(d)(ii) An explanation that makes reference to two of the following points: (2)
1. pesticide / insecticide / fungicide/ antibiotic / kill other organisms / disrupt food chain /eq (1)
2. (pesticide / insecticide / fungicide / antibiotics ) can (bio)accumulate / eq (1)
3. (antibiotics) lead to antibiotic resistance / eq (1)
4. selective bred / GM organisms may escape and interbreed / eq (1)
(e) An explanation that makes reference to two of the following points: (2)
1. deep water / greater volume / eq (1)
2. (so) dilution / reduces concentration / eq (1)
3. fast water flowing / eq (1)
4. (so) dispersed / carried away / eq (1)
(f) An answer that includes: (1)
• further from shore / further from land / isolated / longer distance to travel / no population nearby / need to use boat to reach / take a long time to get there / eq (1)
(g) An answer that includes one of: (1)
• is cheaper / use cheaper food (readily available) / surplus food / crop waste /eq (1)
• more efficient energy transfer / eq (1)
• will not eat each other / other fish / eq(1)
(h) An explanation that makes reference to two of the following points: (2)
• less fuel / less transport of equipment /supplies / workers / less food miles / eq (1)
• less energy used / less electricity / less machinery (in running / building) / eq (1)
• less carbon dioxide released (from burning the fossil fuel) / eq (1)
Total = 17 marks
▶️ Answer/Explanation
5 (a)(i)
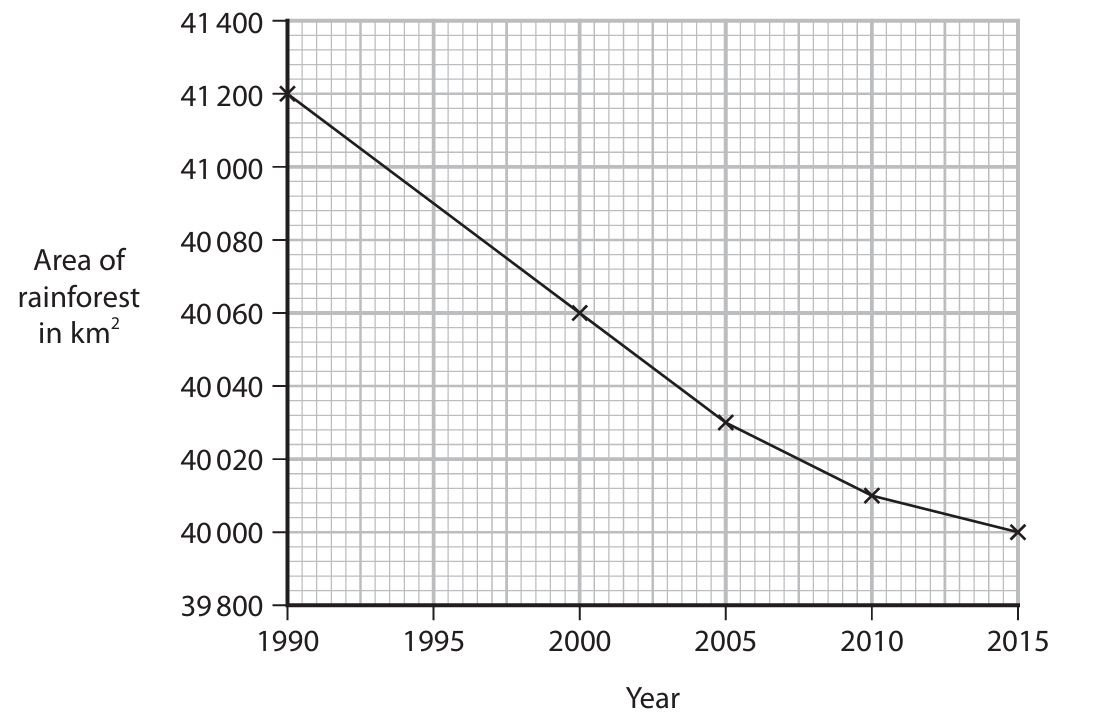
Answer: 48 km² per year
Detailed Explanation:
To calculate the mean rate of decrease, we need to find the total decrease in rainforest area over the 25-year period (1990 to 2015) and then divide by the number of years.
From the graph, we can see that in 1990 the rainforest area was approximately 41,200 km², and by 2015 it had decreased to approximately 40,000 km².
The total decrease is: 41,200 km² – 40,000 km² = 1,200 km²
The time period is: 2015 – 1990 = 25 years
Therefore, the mean rate of decrease per year is: 1,200 km² ÷ 25 years = 48 km² per year
This means that on average, the Earth lost 48 square kilometers of rainforest each year during this period.
5 (a)(ii)
Detailed Explanation:
An increase in atmospheric carbon dioxide gas has several negative effects on the environment:
First, carbon dioxide is a greenhouse gas that contributes significantly to the greenhouse effect. This means it traps heat in the Earth’s atmosphere, leading to global warming and an overall increase in Earth’s temperature.
This temperature rise causes polar ice caps and glaciers to melt, which in turn leads to rising sea levels. Higher sea levels can cause flooding in coastal areas, resulting in habitat loss for both human and animal populations.
Additionally, increased CO₂ levels contribute to climate change, which alters weather patterns worldwide. This can result in more frequent and severe extreme weather events such as storms, droughts, and desertification, making some regions less habitable and disrupting agricultural systems.
The changing climate also affects ecosystems, leading to extinctions as species struggle to adapt to new conditions. It can change the distribution of organisms, force migrations, spread pests, and disrupt food chains.
Another significant effect is ocean acidification. When CO₂ dissolves in seawater, it forms carbonic acid, lowering the ocean’s pH. This acidification harms marine life, particularly organisms with calcium carbonate shells or skeletons, and can lead to coral reef bleaching.
5 (b)(i)
Detailed Explanation:
Microorganisms play essential roles in converting organic waste into nitrate ions through the process of decomposition and the nitrogen cycle.
Decomposers, primarily bacteria and fungi, break down organic waste material containing nitrogen compounds like proteins. Through the process of ammonification, these decomposers convert the nitrogen in organic matter into ammonia (NH₃) or ammonium ions (NH₄⁺).
Next, specific nitrifying bacteria convert ammonium into nitrite ions (NO₂⁻). Another group of nitrifying bacteria then oxidize these nitrite ions into nitrate ions (NO₃⁻), which is the form most readily absorbed by plants.
This entire process, known as nitrification, is crucial for making nitrogen available to plants and maintaining the nutrient cycle in aquatic ecosystems like rivers.
5 (b)(ii)
Detailed Explanation:
Recording only the number of different animal species does not provide a complete measure of biodiversity because it ignores several important factors:
This measure doesn’t account for the population sizes or abundance of each species. An ecosystem might have many species but be dominated by just one or two of them, which isn’t reflected in a simple species count.
It also fails to consider other kingdoms of organisms such as plants, bacteria, fungi, and protoctists, which are all important components of ecosystem biodiversity.
Additionally, some species may be seasonal or migratory, meaning they’re only present at certain times of year. A survey conducted at one time might miss these species, giving an incomplete picture of the true biodiversity.
5 (b)(iii)
Detailed Explanation:
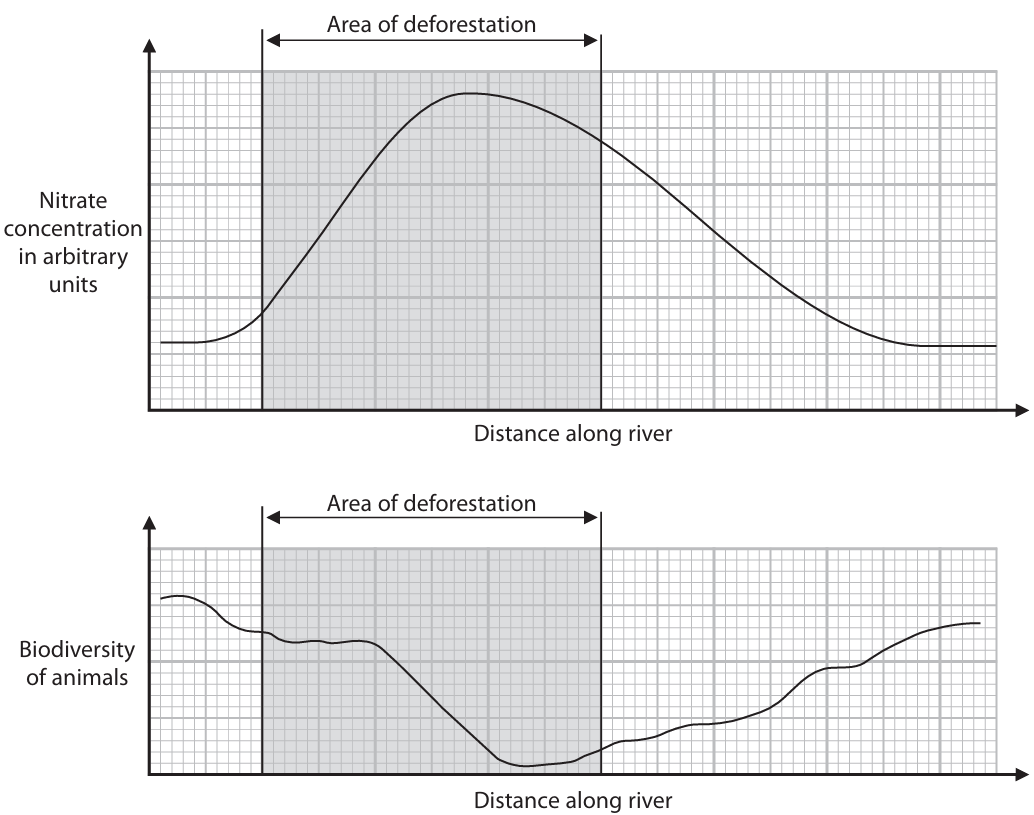
The graphs show that as nitrate concentration increases (particularly after the deforested area), biodiversity of animals in the river decreases. This relationship can be explained through a process called eutrophication.
Deforestation leads to soil erosion and runoff, which carries minerals and organic waste into the river. This includes nitrates from decomposed organic matter and possibly fertilizers from agricultural activities following deforestation.
The increased nitrate levels act as nutrients, causing excessive growth of algae and aquatic plants in a process called eutrophication. The algal growth forms blooms on the water surface that block light penetration to deeper water.
With reduced light, submerged plants cannot photosynthesize effectively and eventually die. The dead plant material, along with the algae (which also eventually die), provides more organic matter for decomposers.
As bacteria decompose this increased organic matter, they respire, consuming oxygen from the water. This leads to oxygen depletion in the river.
The low oxygen levels cause fish and other animal species to die because they cannot respire adequately. This results in decreased biodiversity as more sensitive species disappear from the ecosystem.
Additionally, deforestation may directly cause habitat loss and disruption of food chains, further contributing to the decline in biodiversity observed in the graph.
▶️ Answer/Explanation
(a) Difference = approximately 105% (range: 94-106%)
Explanation: To calculate this difference, we need to find the percentage change for each time period separately and then find the difference between them.
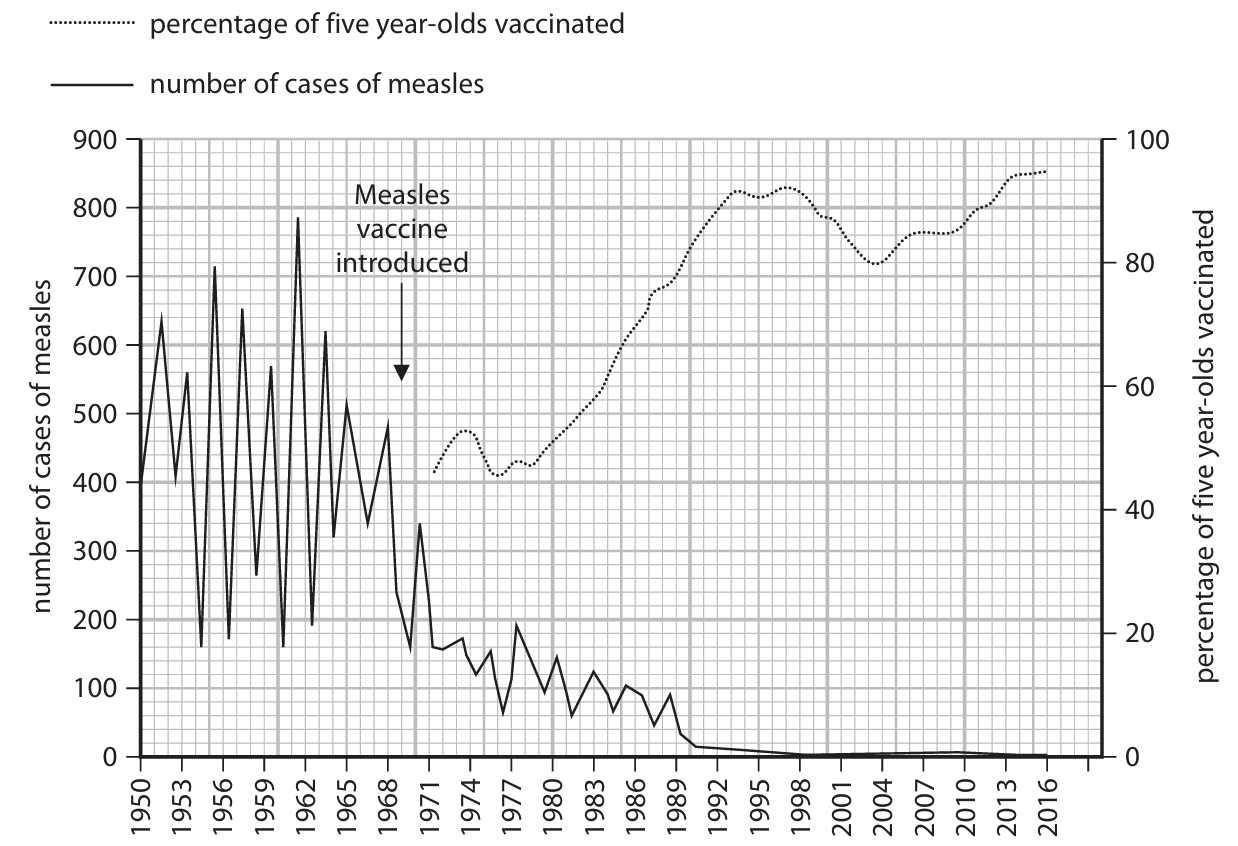
For 1950-1965: Cases increased from approximately 400-420 to 510-520. Using the midpoint values (410 to 515):
Percentage change = \(\frac{515 – 410}{410} \times 100 = \frac{105}{410} \times 100 ≈ 25.6\%\)
For 1968-1983: Cases decreased from approximately 480-490 to 120-130. Using the midpoint values (485 to 125):
Percentage change = \(\frac{125 – 485}{485} \times 100 = \frac{-360}{485} \times 100 ≈ -74.2\%\)
Difference = |25.6 – (-74.2)| = 99.8% (approximately 100%)
The exact answer may vary slightly depending on the precise values read from the graph, but should fall within the range of 94-106%.
(b) The relationship shows that as vaccination rates increase, measles cases decrease significantly.
Explanation: The graph demonstrates an inverse relationship between vaccination rates and measles cases. Before widespread vaccination (pre-1968), cases were high and fluctuated significantly. After the introduction of vaccination, cases began to decline steadily as vaccination rates increased.
For example, in the early 1970s when vaccination rates were around 50-60%, cases dropped to about 100-200 thousand. By the 1990s, when vaccination rates reached 80-90%, cases fell dramatically to very low levels (less than 20 thousand). This shows that vaccination provides herd immunity, reducing the virus’s ability to spread through the population.
The relationship is not perfectly linear because other factors like vaccination campaigns, public awareness, and natural immunity from previous infections also play a role. However, the overall trend clearly shows that higher vaccination coverage leads to fewer measles cases.
(c) Vaccinations are not used on immunocompromised children because they may not develop proper immunity and could develop the disease.
Explanation: Children with compromised immune systems (due to treatments like chemotherapy or immunosuppressive drugs) have reduced ability to produce antibodies and memory cells in response to vaccines. Vaccines contain weakened or inactivated pathogens that stimulate the immune system to create protection.
In immunocompromised children, their weakened immune systems may not be able to mount an effective response to the vaccine, leaving them unprotected. Even more concerning, there’s a risk that the weakened pathogen in the vaccine could cause the actual disease in these vulnerable children.
Instead of vaccination, these children rely on herd immunity – the protection provided when enough people in the community are vaccinated to prevent the disease from spreading. This is why high vaccination rates in the general population are so important, as they protect those who cannot be vaccinated themselves.
▶️ Answer/Explanation
(a) C (respiration)
Explanation: Respiration is the metabolic process that breaks down glucose to release energy, which is stored in ATP molecules. Active transport uses ATP but does not produce it. Diffusion is a passive process and does not require or produce ATP. Transpiration is the loss of water vapor from plants and is not directly involved in ATP production.
(b)(i)
Explanation: Intensive farming often involves the heavy use of fertilizers. Deforestation removes trees whose roots help bind the soil. The combination of these factors leads to soil erosion. When it rains, eroded soil and excess fertilizers (rich in minerals like nitrates and phosphates) are washed into rivers and eventually into estuaries and the sea. These minerals act as nutrients for dinoflagellates, allowing their populations to grow rapidly, a process known as eutrophication.
(b)(ii)
Explanation: After the glowing events, large numbers of dinoflagellates die. Their bodies are decomposed by bacteria and other microorganisms. These decomposers respire as they break down the organic matter, a process that consumes oxygen. The large algal bloom may also block light, reducing photosynthesis and oxygen production by other organisms. The high rate of oxygen consumption by decomposers leads to a decrease in dissolved oxygen levels.
(c) C (nitrifying)
Explanation: Nitrifying bacteria are specifically responsible for converting ammonia into nitrites and then into nitrates in the nitrogen cycle. Decomposer bacteria break down organic matter into ammonia. Denitrifying bacteria convert nitrates back into nitrogen gas. Nitrogen-fixing bacteria convert atmospheric nitrogen gas into ammonia.
(d)(i) 70 dinoflagellates per hour
Explanation: The total number of non-glowing dinoflagellates eaten in 2 hours was 2100. The total eaten per hour is \( 2100 \div 2 = 1050 \) dinoflagellates per hour. This is the rate for all 15 copepods. The mean rate per copepod is \( 1050 \div 15 = 70 \) dinoflagellates per hour per copepod.
(d)(ii)
Explanation: A random mutation gave some dinoflagellates the allele to glow. This created variation. When predators were present, dinoflagellates that glowed were less likely to be eaten (as the glow attracted the predators’ own predators). These dinoflagellates had a higher survival rate and were more likely to reproduce, passing the advantageous allele for glowing to their offspring. Over many generations, the frequency of the glowing allele increased in the population, leading to the evolution of this trait.
(e)
Explanation: It would reduce reliance on electricity generated from burning fossil fuels. The dinoflagellates photosynthesize during the day, taking in carbon dioxide (\(CO_2\)) from the atmosphere. At night, they produce light through bioluminescence without burning fuels. Therefore, this method produces no direct air pollutants and contributes less to the greenhouse effect, making it a more sustainable and carbon-neutral alternative.
▶️ Answer/Explanation
(a)
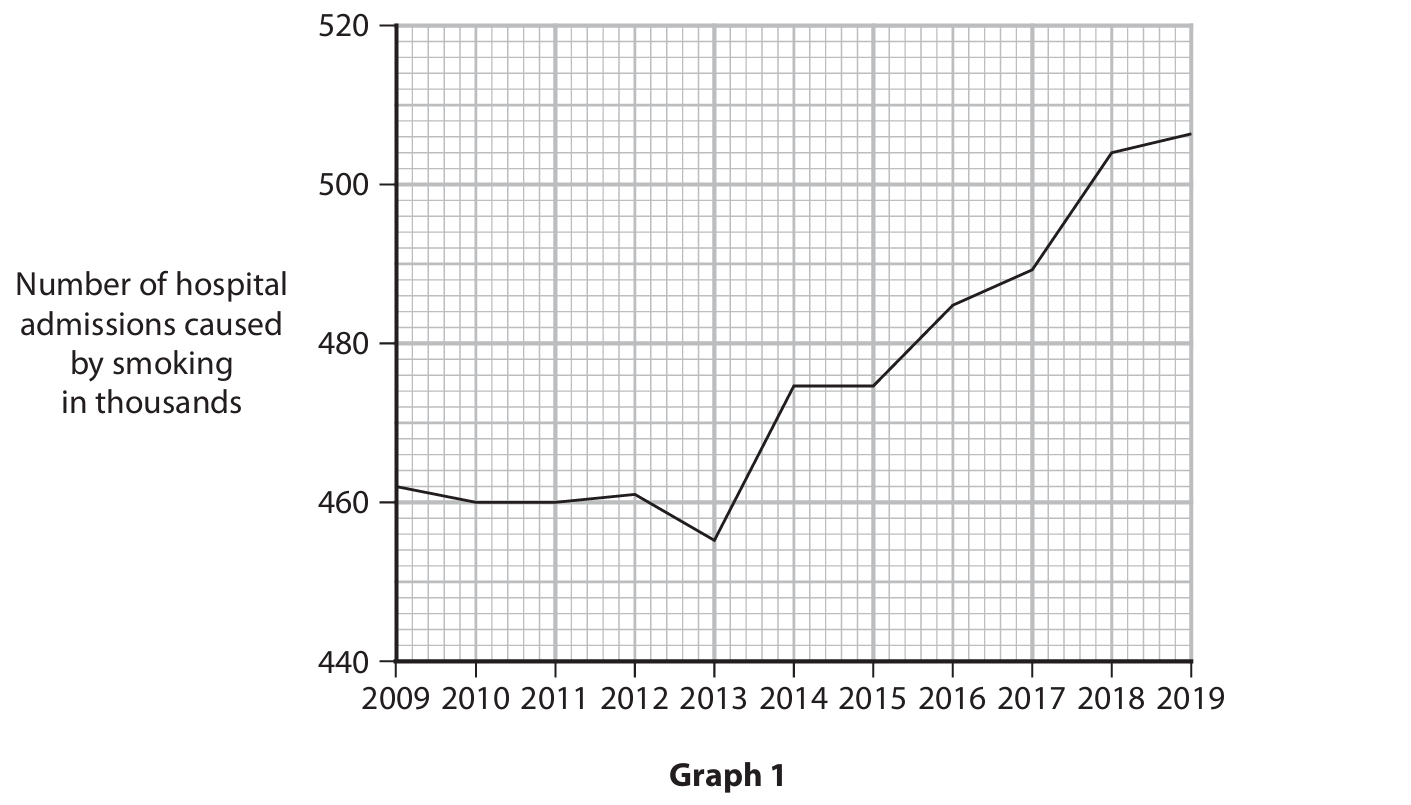
Percentage increase ≈ 9.52%
Explanation:
To calculate the percentage increase, we first need the number of admissions for the start year (2009) and the end year (2019) from Graph 1.
From the graph, the number in 2009 is approximately 462 (thousand). The number in 2019 is approximately 506 (thousand).
The actual increase is calculated as: 506 – 462 = 44 (thousand).
The percentage increase is calculated using the formula:
\[ \text{Percentage Increase} = \left( \frac{\text{Change}}{\text{Original}} \right) \times 100 = \left( \frac{44}{462} \right) \times 100 \]
Performing the calculation: (44 ÷ 462) ≈ 0.095238. Multiplying by 100 gives approximately 9.52%.
Therefore, the percentage increase in hospital admissions caused by smoking from 2009 to 2019 was about 9.52%.
(b)
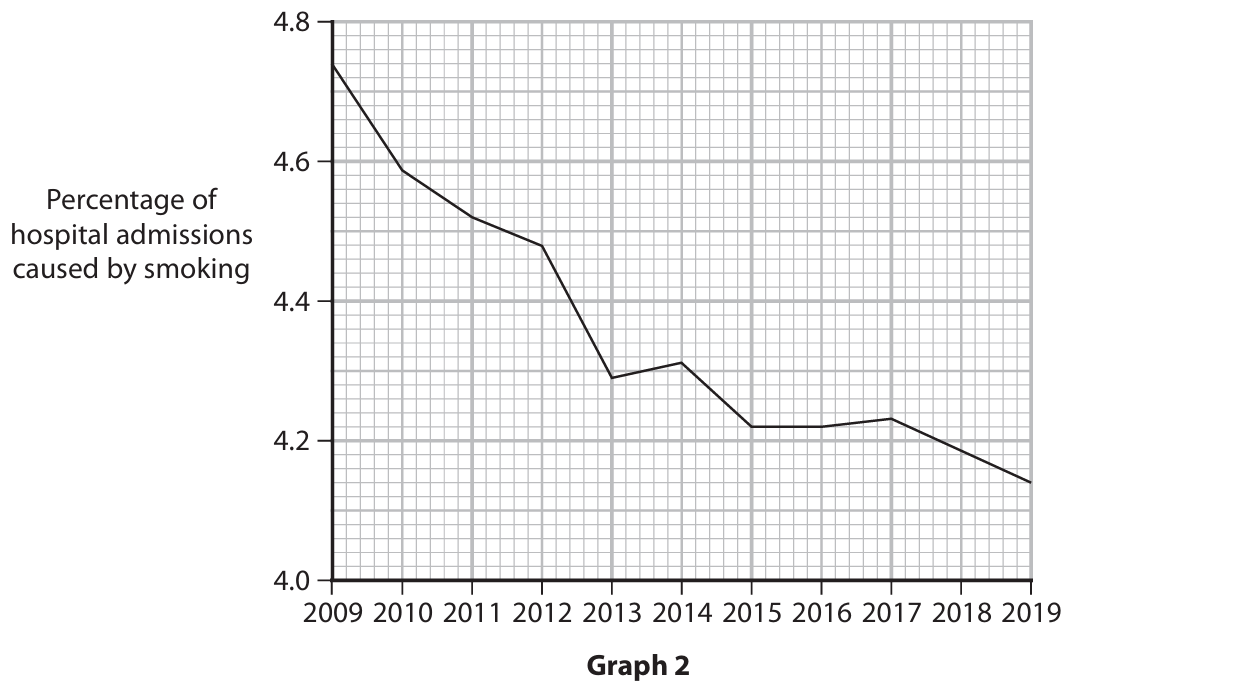
Comment:
Explanation:
Analyzing the data from both graphs reveals important trends. Graph 1 shows that the absolute number of hospital admissions due to smoking generally increased from 2009 (≈462,000) to 2019 (≈506,000), with a noticeable dip or plateau around 2012-2013 where numbers were at their lowest.
However, Graph 2 tells a different story about the proportion of total admissions. It shows that the percentage of all hospital admissions that were caused by smoking declined over the same period, reaching its lowest point in 2019.
This apparent contradiction can be explained by factors such as an increase in the total number of hospital admissions from all causes (e.g., due to a growing or aging population, or an increase in other illnesses), meaning smoking-related admissions make up a smaller share of a larger total. It could also suggest that while the number of people suffering smoking-related illnesses is high, fewer people are starting to smoke or more people are quitting, leading to a slower growth rate of smoking-related admissions compared to admissions from other causes.
(c)
Consequences for Lung Function:
Explanation:
Smoking severely damages the lungs and impairs their function through several mechanisms:
- Damage to Cilia: The trachea and bronchi are lined with cilia (tiny hair-like structures) that sweep mucus and trapped particles out of the airways. Smoke paralyzes and destroys these cilia. This is a primary and early consequence.
- Mucus Buildup: With the cilia unable to function, mucus builds up in the airways. This buildup cannot be cleared effectively, creating a stagnant environment.
- Increased Infection Risk: The accumulated mucus becomes a breeding ground for bacteria, leading to frequent bacterial infections, bronchitis, and pneumonia.
- Alveoli Destruction: The toxins in smoke damage the walls of the alveoli (air sacs where gas exchange occurs). This causes the alveoli to break down and merge, a condition called emphysema. This drastically reduces the surface area available for oxygen and carbon dioxide exchange.
- Inflammation and Narrowing: Smoke causes chronic inflammation and swelling of the bronchioles. The muscles around these airways can also tighten, causing them to narrow. This makes it physically harder to move air in and out, leading to breathlessness, a characteristic of chronic bronchitis.
- Cancer: The carcinogens in tobacco smoke can cause mutations in lung cells, leading to uncontrolled cell growth and lung cancer.
Collectively, the destruction of alveoli (emphysema) and the inflamed, narrowed airways (chronic bronchitis) are often grouped under the term Chronic Obstructive Pulmonary Disease (COPD), a major long-term consequence of smoking.
▶️ Answer/Explanation
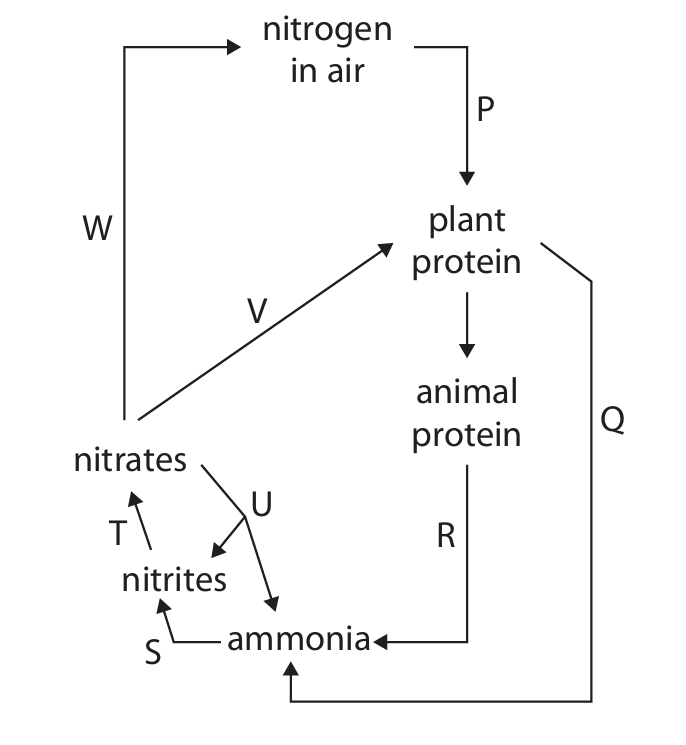
(a)(i) Answer: A (P)
Explanation: Nitrogen fixation is the process where atmospheric nitrogen (N₂) is converted into ammonia (NH₃) or related compounds by nitrogen-fixing bacteria. In the diagram, this process is represented by stage P, where nitrogen from the air enters the soil ecosystem.
(a)(ii) Answer: C (T)
Explanation: Nitrification is the biological oxidation of ammonia to nitrite (NO₂⁻) followed by the oxidation of nitrite to nitrate (NO₃⁻). This process is carried out by specific nitrifying bacteria. In the diagram, stage T represents this conversion process within the nitrogen cycle.
(a)(iii) Answer: D (W)
Explanation: Denitrification is the microbial process where nitrate (NO₃⁻) is reduced to nitrogen gases (N₂ or N₂O), which are then released back into the atmosphere. This completes the nitrogen cycle. In the diagram, stage W shows this return of nitrogen to the atmosphere.
(b)(i) Answer: Fertilizer pollution can severely impact aquatic ecosystems through a process called eutrophication.
Explanation: When excess fertilizer containing nitrates and phosphates is washed into water bodies from agricultural fields, it acts as a nutrient source for algae and aquatic plants. This leads to rapid algal growth known as an algal bloom. The dense algal growth covers the water surface, blocking sunlight from reaching deeper aquatic plants. Without sufficient light, these plants cannot photosynthesize effectively and eventually die. As the algae and plants die, they sink to the bottom where they are decomposed by bacteria. These decomposing bacteria respire, consuming large amounts of oxygen in the process. This leads to oxygen depletion in the water, creating hypoxic (low oxygen) conditions. The lack of oxygen causes fish and other aquatic organisms to suffocate and die, disrupting the entire aquatic ecosystem.
(b)(ii) Answer: Animal manure / dung / faeces / animal waste
Explanation: Instead of chemical fertilizers, farmers could use organic alternatives like animal manure. Animal waste contains essential nutrients like nitrogen, phosphorus, and potassium that plants need for growth. When properly composted and applied, manure slowly releases these nutrients into the soil, improving soil structure and fertility while reducing the risk of water pollution compared to synthetic fertilizers. Other alternatives include compost, green manure (growing and plowing under plants specifically for soil improvement), and bone meal.
▶️ Answer/Explanation
(a)(i)
Explanation: Plants need nitrate ions (\( NO_3^- \)) because:
1. Nitrates are a source of nitrogen, which is a key element needed to synthesize amino acids.
2. Amino acids are the building blocks for proteins, which are essential for plant growth, enzyme function, and cell structure.
Additional detail: Nitrogen is also required for making other important compounds like chlorophyll, DNA, and RNA.
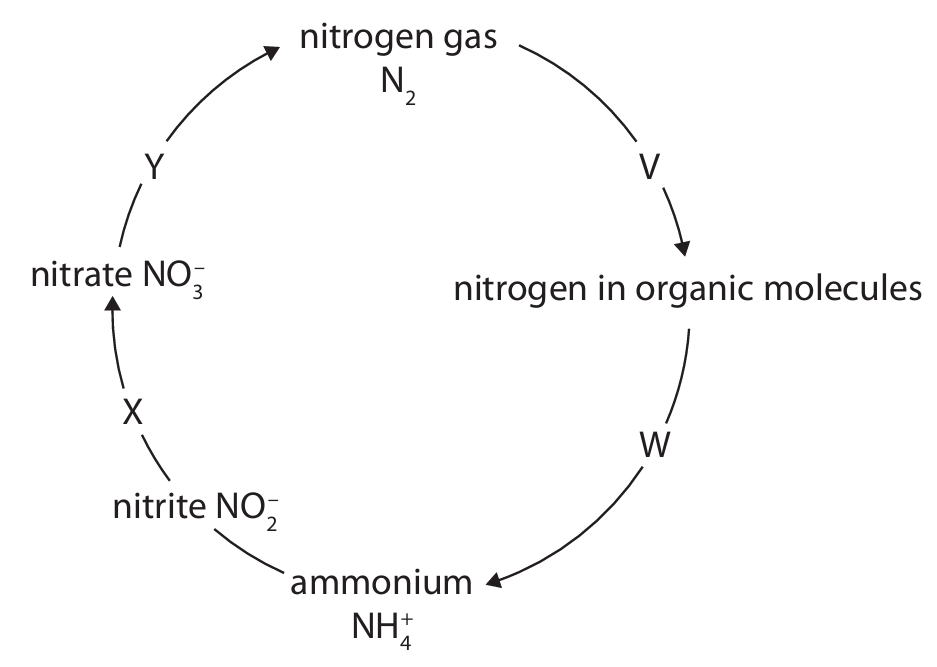
(a)(ii)
Process Names:
• \( V \): Nitrogen fixation (carried out by nitrogen-fixing bacteria).
• \( X \): Nitrification (carried out by nitrifying bacteria, converting ammonium to nitrite then nitrate).
• \( Y \): Denitrification (carried out by denitrifying bacteria, converting nitrates back to nitrogen gas).
(b)(i)
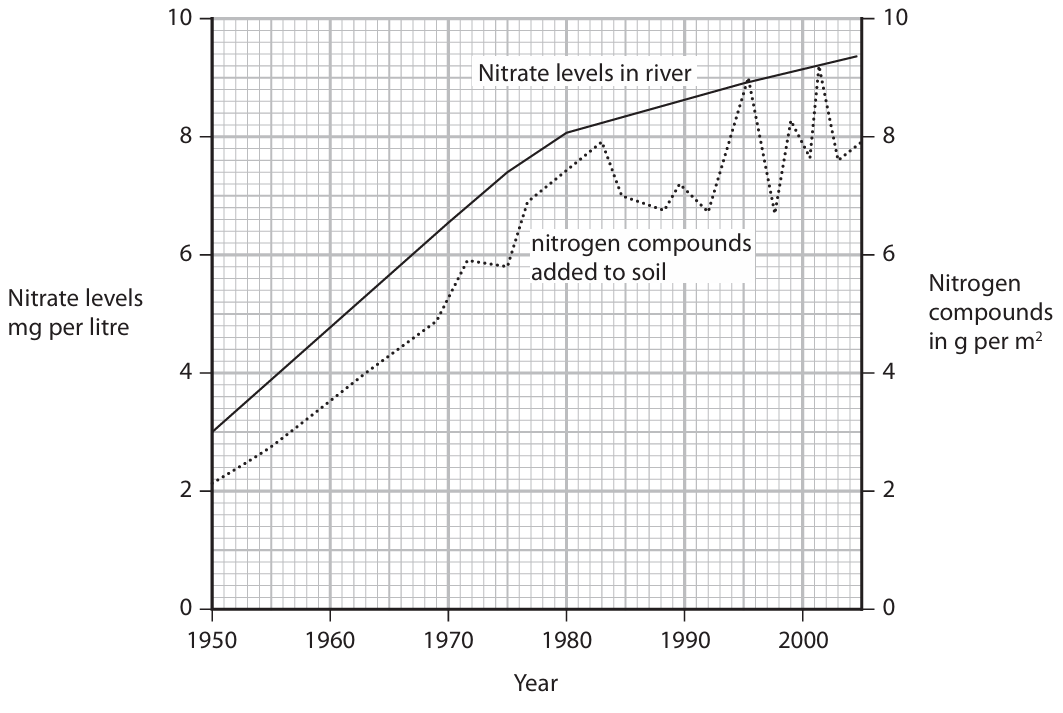
Comment on the relationship:
1. There is a general positive correlation between the two variables from 1950 to 1970; as nitrogen application increased, river nitrate levels also increased.
2. From 1980 onwards, the relationship becomes less clear/more variable.
3. The amount of nitrogen applied to fields fluctuates more (shows greater variability) than the nitrate levels in the river, which remain relatively more stable.
4. This can be explained by factors such as:
– Leaching of excess nitrate from fields into the river.
– Variations in fertilizer application rates by farmers.
– The river receiving nitrates from other sources (e.g., sewage, natural decay).
(b)(ii)
Describe changes in the river (eutrophication process):
1. Increased nitrate levels led to excessive algal growth / algal blooms (eutrophication).
2. The increase in algae and later their death led to a rise in decomposer bacteria that break down the organic matter.
3. These decomposers respire, using up oxygen, leading to reduced oxygen levels (anoxia) in the water.
4. This resulted in increased turbidity (cloudiness) and reduced light penetration, harming aquatic plants.
5. Ultimately, there was a loss of biodiversity, including death of fish and other oxygen-dependent organisms.
▶️ Answer/Explanation
(a)
An explanation that makes reference to:
• Burning / combustion of petrol / diesel / fuel in car engines. (1 mark)
• This combustion reaction releases carbon dioxide (\( \text{C} + \text{O}_2 \rightarrow \text{CO}_2 \)). (1 mark)
More cars mean more fuel burned, directly increasing \( \text{CO}_2 \) emissions.
(b)
An explanation that makes reference to two of the following:
• Carbon dioxide is a greenhouse gas. (1 mark)
• It traps / absorbs infrared (IR) radiation (heat) from the Earth, preventing its escape into space. (1 mark)
• This leads to an enhanced greenhouse effect, causing global warming / climate change. (1 mark)
(Maximum 2 marks)
(c)
An explanation that makes reference to:
• Carbon dioxide is a reactant / raw material needed for photosynthesis. (1 mark)
• At lower concentrations, \( \text{CO}_2 \) can be a limiting factor for photosynthesis; increasing its concentration can increase the rate up to a point. (1 mark)
The photosynthesis equation is: \( 6\text{CO}_2 + 6\text{H}_2\text{O} \xrightarrow{\text{light}} \text{C}_6\text{H}_{12}\text{O}_6 + 6\text{O}_2 \).
(d)
An explanation that makes reference to two of the following:
• A carbon sink absorbs more \( \text{CO}_2 \) than it releases. (1 mark)
• Respiration (by plants, animals, decomposers) releases \( \text{CO}_2 \) back into the atmosphere, reducing net absorption. (1 mark)
• Deforestation (cutting down trees) reduces the number of plants for photosynthesis and often involves burning/decay, releasing stored carbon as \( \text{CO}_2 \). (1 mark)
(Maximum 2 marks)
(e)
A description that makes reference to three of the following:
• Place leaves (or aquatic plants like pondweed) in test tubes containing hydrogen-carbonate indicator. (1 mark)
• Expose one setup to bright light and another to darkness (or vary light intensity using a lamp at different distances). (1 mark)
• In bright light, the indicator turns purple/dark red (due to net \( \text{CO}_2 \) uptake in photosynthesis). In darkness, it turns yellow (due to net \( \text{CO}_2 \) release from respiration). (1 mark)
• Control other variables: use leaves of the same species, size, age; same volume and concentration of indicator; same temperature; same time period. (1 mark)
(Maximum 3 marks)
(f)
Step-by-step calculation:
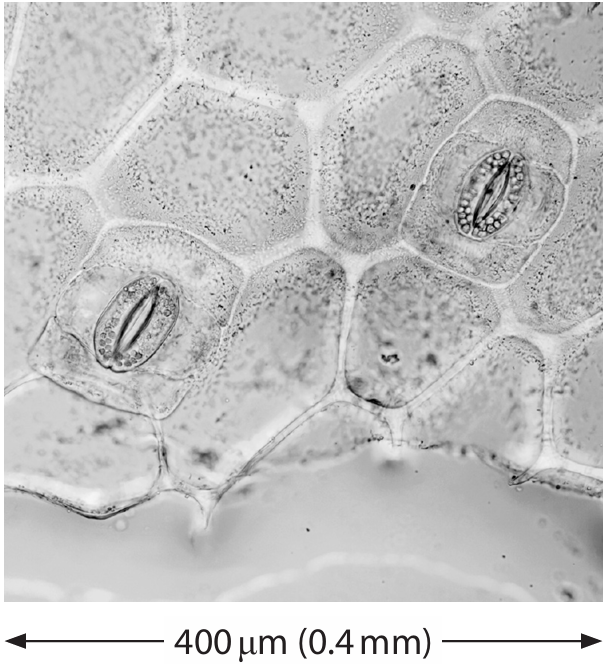
1. Area in photograph: side = \( 400 \mu\text{m} = 0.4 \text{ mm} = 0.04 \text{ cm} \).
2. Area of square = \( (0.04 \text{ cm})^2 = 0.0016 \text{ cm}^2 \).
3. Number of stomata in this area = 2.
4. Stomatal density = \( \frac{2}{0.0016} = 1250 \) stomata per \( \text{cm}^2 \).
5. Total number on leaf = \( 1250 \times 150 = 187500 \).
Answer: \( \mathbf{187500} \) stomata. (3 marks)
(g)
An explanation that makes reference to:
• Stomata allow water vapour to evaporate / be lost from the leaf in a process called transpiration. (1 mark)
• This transpiration pull creates a tension / negative pressure in the xylem, drawing a continuous column of water up from the roots, through the stem, and into the leaves. (1 mark)
This is known as the transpiration stream, and it relies on stomatal opening for water movement against gravity.
▶️ Answer/Explanation
(a)
Explanation: Selective breeding involves a deliberate process to enhance desirable traits. To produce fish that grow rapidly, fish farmers would first identify and select parent fish that already exhibit fast growth rates. These selected fish are then bred together. From their offspring, the fastest-growing individuals are again selected to be the parents for the next generation. By repeating this process over many generations, the alleles (gene variants) responsible for rapid growth become more common in the population, leading to a stock of fish that consistently grows quickly.
(b)
Explanation: The conversion of ammonia to nitrates is a natural biological process called nitrification. This process is carried out by specific types of bacteria known as nitrifying bacteria. These bacteria are autotrophs that obtain energy by oxidizing nitrogen compounds. The process occurs in two main stages. First, bacteria such as Nitrosomonas convert ammonia (NH₃) into nitrites (NO₂⁻). Then, other bacteria, like Nitrobacter, convert these nitrites into nitrates (NO₃⁻). Nitrates are a form of nitrogen that can be more easily utilized by plants and algae.
(c)
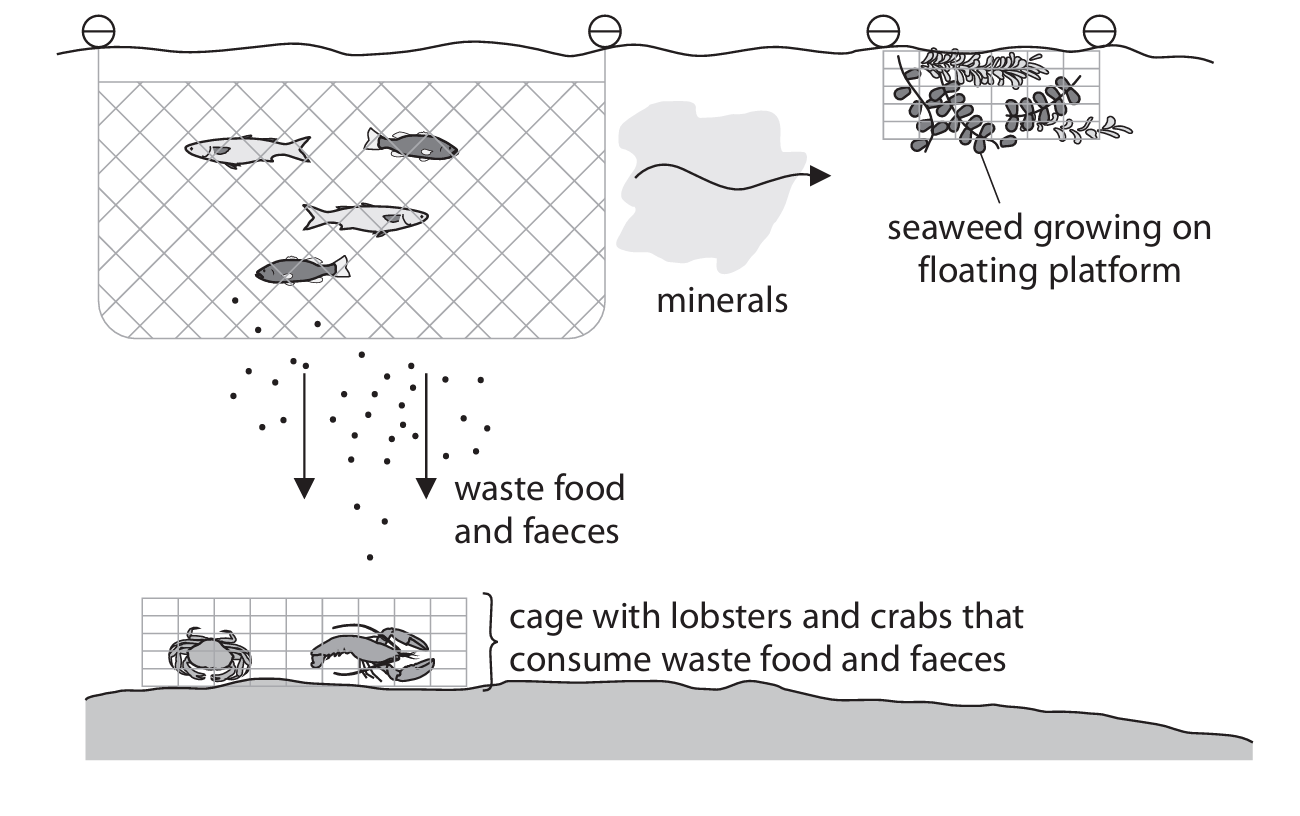
Explanation: The multi-trophic level aquaculture system is designed to create a more balanced and efficient ecosystem, which directly addresses pollution and profitability.
Reducing Pollution:
- The system significantly reduces solid waste pollution because lobsters and crabs consume the waste food and faeces produced by the main fish stock. This means less organic matter accumulates on the seabed.
- With less waste material available, there is a reduction in the population of decomposing bacteria. This is beneficial because these bacteria consume large amounts of oxygen during respiration; therefore, lower bacterial numbers help to maintain higher oxygen levels in the water, preventing oxygen depletion that can kill aquatic life.
- Furthermore, the seaweed plays a crucial role in reducing dissolved nutrient pollution. It absorbs nitrates, phosphates, and other minerals from the water that would otherwise act as fertilizers, potentially causing excessive algal growth (algal blooms) and eutrophication. The seaweed also releases oxygen through photosynthesis, further improving water quality.
Increasing Profits:
- This system creates additional saleable products. The farmer can now harvest and sell not only the main fish but also the lobsters, crabs, and seaweed, diversifying their income streams.
- It also reduces costs. There is no need to purchase extra feed for the lobsters and crabs, as they consume the waste from the fish. Similarly, the seaweed obtains its minerals naturally from the water, eliminating the need for artificial fertilizers.
- Healthier fish, resulting from the improved water quality (higher oxygen, lower disease risk), are likely to grow better and have lower mortality rates, leading to higher yields and reduced losses.
▶️ Answer/Explanation
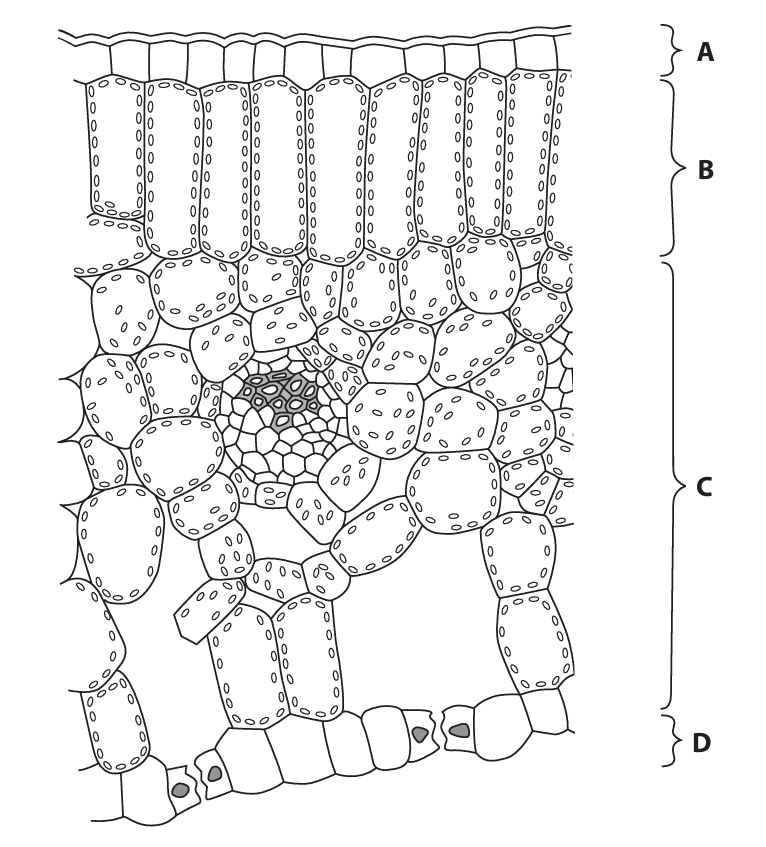
(a) (i) B
Explanation: The palisade mesophyll layer is typically found just below the upper epidermis in a leaf. It consists of tightly packed, columnar cells rich in chloroplasts, which are the main sites for photosynthesis. In a standard leaf cross-section diagram, this layer is labeled as B.
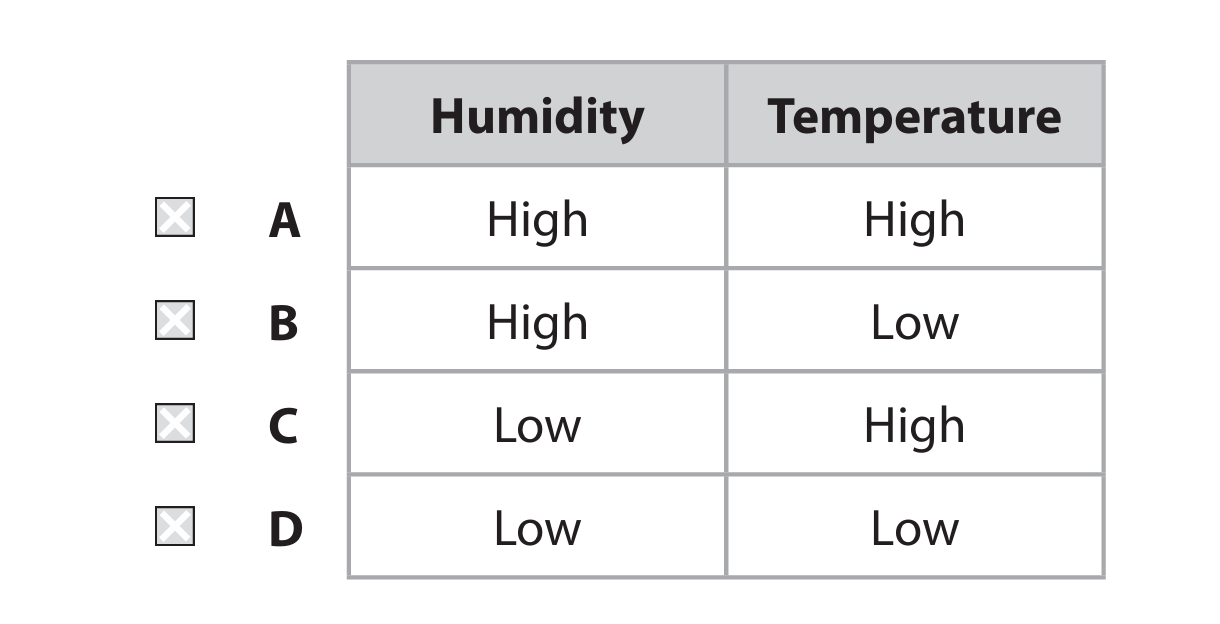
(a) (ii) Low humidity, High temperature
Explanation: Transpiration is the loss of water vapor from the leaves. Its rate is influenced by environmental factors. Low humidity creates a steeper concentration gradient for water vapor between the leaf’s interior and the outside air, favoring faster diffusion. High temperature increases the kinetic energy of water molecules, leading to more evaporation. Therefore, the combination of low humidity and high temperature provides the most favorable conditions for the fastest transpiration rate.
(b) (i) Concentration of carbon dioxide
Explanation: The independent variable is the factor that the scientist deliberately changes or manipulates in an experiment. Here, the scientists are growing plants in “different concentrations of carbon dioxide,” so that is the independent variable.
(b) (ii) Any two from: temperature, light, mineral ions/pH/soil, water/humidity
Explanation: Abiotic factors are the non-living chemical and physical parts of the environment. To ensure a fair test where only the independent variable (CO₂ concentration) affects the results, other abiotic factors that could influence plant growth or stomatal density must be kept constant. Examples include temperature, light intensity, water availability, humidity, and soil mineral content or pH.
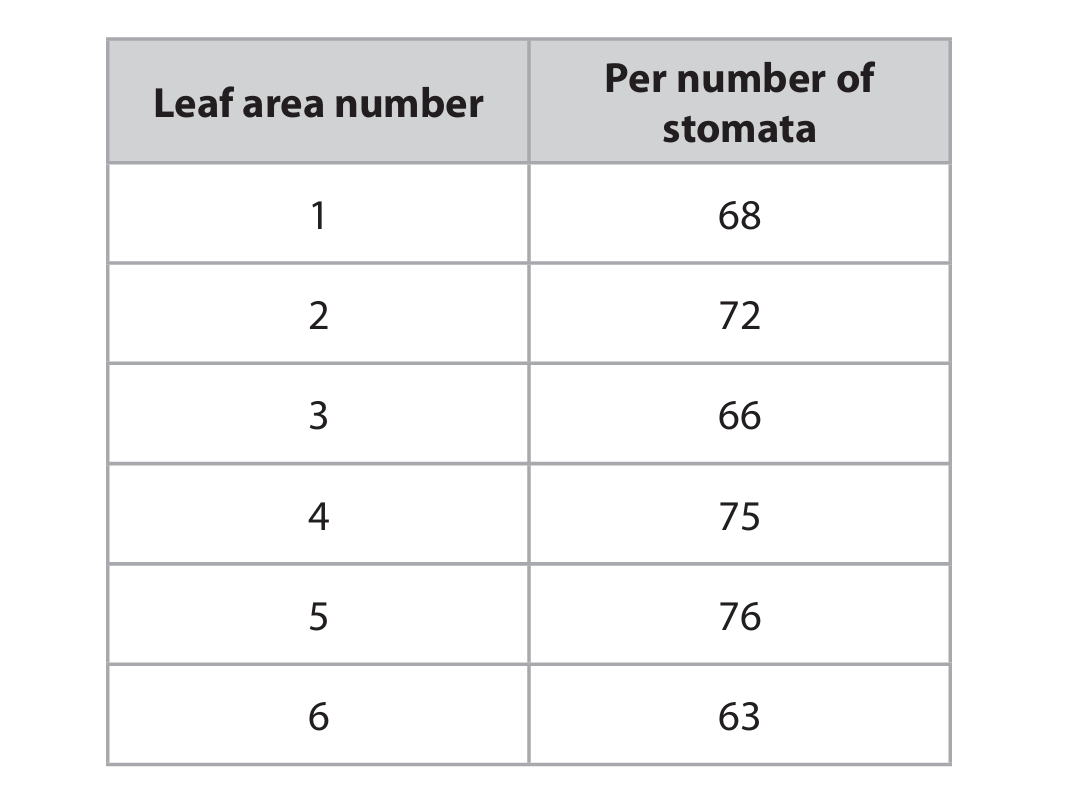
(b) (iii) 140 stomata per mm²
Explanation:
First, calculate the total number of stomata counted: 68 + 72 + 66 + 75 + 76 + 63 = 420.
Next, find the mean number of stomata per circular area: 420 ÷ 6 = 70.
Then, calculate the area of one circular sampling region using the formula \(\pi r^2\). The radius \(r\) is 0.40 mm.
Area = 3.14 × (0.40)² = 3.14 × 0.16 = 0.5024 mm².
Finally, calculate the mean density: Mean number of stomata per area = 70 ÷ 0.5024 ≈ 139.3.
Rounded to a sensible figure, this gives a mean density of approximately 140 stomata per mm².
(b) (iv) Discussion points include:
- Carbon dioxide is essential for photosynthesis.
- Fewer stomata may reduce the uptake of CO₂, potentially limiting photosynthesis.
- However, with increased external CO₂ concentration, the diffusion gradient is steeper, so fewer stomata might still allow sufficient CO₂ intake.
- A major advantage of fewer stomata is a significant reduction in water loss through transpiration.
- In hot, dry areas, conserving water is crucial to prevent wilting and maintain turgor.
- Reduced transpiration can also mean less transport of minerals from roots to shoots and less evaporative cooling of the leaf, which could be a disadvantage.
- The conclusion is generally supported as water conservation is often the limiting factor for survival in such environments, making the trade-off beneficial.
Explanation: The scientist’s conclusion links high CO₂, low stomatal density, and an advantage in hot, dry climates. The core of the discussion revolves around the trade-off between gas exchange (for photosynthesis) and water conservation. In high CO₂ conditions, the plant’s demand for stomatal openings for CO₂ intake might be lower because the driving force for diffusion is stronger. This allows the plant to afford having fewer stomata. The primary benefit of fewer stomata is a substantial reduction in transpirational water loss, which is a critical survival advantage in arid environments where water is scarce. While there might be minor drawbacks like reduced mineral transport or slightly lower photosynthetic rates, the overwhelming benefit of water conservation in a hot, dry habitat makes the scientist’s conclusion reasonable. The data from the investigation directly supports the first part of this chain by showing that high CO₂ leads to lower stomatal density.
▶️ Answer/Explanation
(a)
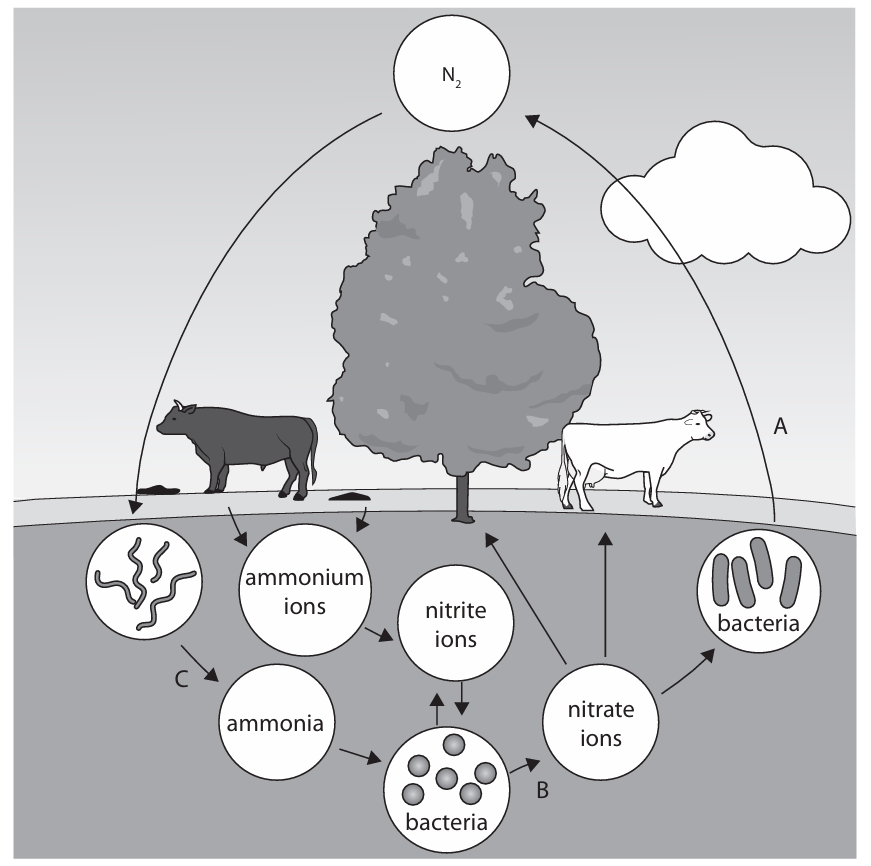
A: Denitrification
B: Nitrification
C: Nitrogen Fixation
Explanation: In the nitrogen cycle, process A shows nitrogen gas returning to the atmosphere from nitrates, which is denitrification carried out by denitrifying bacteria. Process B shows the conversion of ammonium ions to nitrites and then to nitrates, which is nitrification performed by nitrifying bacteria. Process C shows atmospheric nitrogen being converted to ammonia/ammonium ions, which is nitrogen fixation by nitrogen-fixing bacteria.
(b)(i)
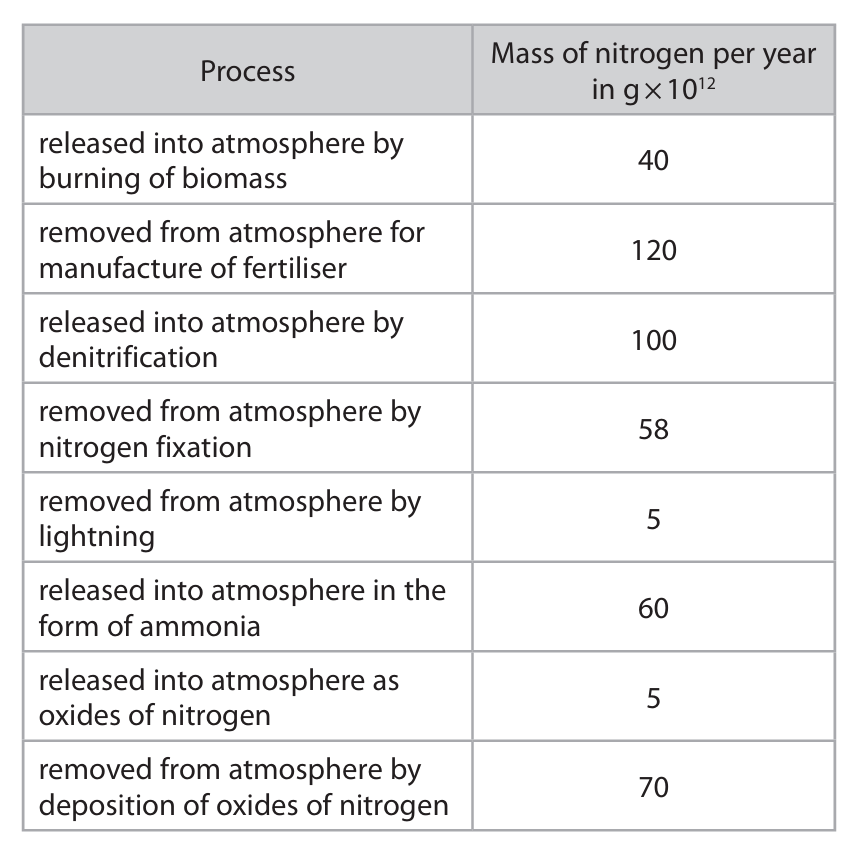
Mass = \(2.53 \times 10^{14}\) g
Explanation: To calculate the total nitrogen removed from the atmosphere, we add all the processes that remove nitrogen: fertilizer manufacture (120), nitrogen fixation (58), lightning (5), and deposition of nitrogen oxides (70). Adding these gives 120 + 58 + 5 + 70 = 253. Since the units are \(g \times 10^{12}\), we convert to standard form: \(253 \times 10^{12} = 2.53 \times 10^{14}\) g.
(b)(ii)
Percentage = 20% (or 19.5%)
Explanation: First, calculate the total nitrogen released into the atmosphere: burning biomass (40) + denitrification (100) + ammonia release (60) + nitrogen oxides release (5) = 205. The percentage from burning biomass is (40 ÷ 205) × 100 = 19.51%, which rounds to 20%.
(b)(iii)
Explanation: Burning biomass returns nitrogen to the atmosphere because biomass contains nitrogen compounds such as proteins, amino acids, and nucleic acids. When biomass burns, these nitrogen-containing compounds break down and release nitrogen in the form of nitrogen oxides (NOₓ) and other gases into the atmosphere.
(c)
Explanation: Nitrous oxide (N₂O) is a potent greenhouse gas that contributes significantly to global warming. It absorbs infrared radiation (heat) emitted by the Earth’s surface and prevents it from escaping into space, effectively trapping heat in the atmosphere. This enhanced greenhouse effect leads to an increase in global temperatures and climate change. Nitrous oxide is particularly concerning because it has a much greater warming potential per molecule than carbon dioxide.
▶️ Answer/Explanation
(a)(i) Methane / nitrous oxides / CFCs / water vapour
Explanation: Greenhouse gases are those that trap heat in the Earth’s atmosphere, contributing to the greenhouse effect. While carbon dioxide is the most commonly discussed, other significant greenhouse gases include methane (released from livestock and landfills), nitrous oxides (from agriculture and industrial processes), chlorofluorocarbons or CFCs (from refrigerants and aerosols, though now largely phased out), and water vapour. Carbon monoxide is not a significant greenhouse gas and is therefore rejected.
(a)(ii) \( 1.8 \times 10^{13} \) kg
Explanation: To find the net increase in atmospheric carbon dioxide, we calculate the total released minus the total removed. The total released is 727 (natural) + 37 (human) = 764 gigatonnes. The amount removed by plants is 746 gigatonnes. The net increase is therefore 764 – 746 = 18 gigatonnes. Since 1 gigatonne = \( 1 \times 10^{12} \) kg, we convert 18 gigatonnes to kg: 18 × \( 10^{12} \) kg = \( 1.8 \times 10^{1} \) × \( 10^{12} \) kg = \( 1.8 \times 10^{13} \) kg.
(a)(iii) Any two from: ice caps/glaciers melt, sea level rise/flooding, loss of habitat/desertification/droughts, extinctions/disrupted food chains, destruction of coral reefs/coral bleaching, spread of disease/pests, extreme weather/changes in weather patterns.
Explanation: Global warming, driven by an enhanced greenhouse effect, has wide-ranging environmental consequences. Two major effects are the melting of polar ice caps and glaciers, which contributes to rising sea levels and subsequent coastal flooding. Another significant impact is the disruption of ecosystems, leading to habitat loss, species extinction as animals and plants cannot adapt quickly enough, and phenomena like coral bleaching where warmer ocean temperatures cause corals to expel the algae living in their tissues, turning them white and threatening the entire reef ecosystem.
(b) An explanation that makes reference to four of the following points:
- Plants take in/absorb carbon dioxide.
- This is for the process of photosynthesis.
- The carbon (from CO₂) is converted into/stored as suberin/locked up in suberin.
- Suberin does not decay for long periods/decomposes slowly/remains for a long time.
- Perennial plants remain for long periods/don’t die off each year.
- Slower/less carbon dioxide is released from decomposition/decay.
Explanation: Genetically engineered plants with high suberin content act as enhanced carbon sinks. They absorb carbon dioxide from the atmosphere during photosynthesis. Instead of this carbon being used solely for immediate growth or being released back quickly, a significant portion is incorporated into suberin in their root cell walls. Suberin is a very stable, waterproof compound that decomposes extremely slowly, meaning the carbon is effectively “locked away” in the soil for a very long time. Furthermore, because these are perennial plants, they live for many years, continuously performing this carbon sequestration without the need for annual replanting, which could disturb the soil and release stored carbon. This long-term storage reduces the net amount of carbon dioxide in the atmosphere.
(c) D (restriction enzyme)
Explanation: In genetic engineering, specific enzymes are used to cut DNA at precise locations. Restriction enzymes (also called restriction endonucleases) are the enzymes responsible for cutting a gene out of a section of DNA. Amylase digests starch, ligase joins DNA fragments together, and lipase digests lipids (fats).
(d) An explanation that makes reference to two of the following points:
- Prevents water loss from the plant roots.
- Due to osmosis.
- Prevents plant cells from becoming flaccid/wilting; helps them stay turgid by preventing water from moving out to the higher salt concentration in the soil.
Explanation: Soil with a high salt concentration has a low water potential (a high solute concentration). Water naturally moves by osmosis from areas of high water potential (inside the root cells) to areas of low water potential (the salty soil). This can cause the plant to lose water and wilt. Suberin, being a waterproof substance in the cell walls of the roots, acts as a barrier. It reduces the movement of water out of the root cells into the salty soil, thereby helping the plant to retain water and maintain turgor pressure, which is essential for support and function.
(e) Any three from: produces large numbers/large scale, fast/quick process, all crops produce suberin/are genetically identical/clones, less risk of cross-pollinating with wild plants/spreading the transgene, can be done at any time of year/all year.
Explanation: Micropropagation (tissue culture) is used for several advantages over traditional pollination. Firstly, it allows for the rapid production of a very large number of plants from a single, successfully modified individual. Secondly, the process is much faster than waiting for seeds to develop and grow. Thirdly, all the plants produced are genetically identical clones, guaranteeing that every single plant will have the desired high-suberin trait. Fourthly, since micropropagation is asexual and doesn’t involve pollen, there is no risk of the transgene escaping via cross-pollination and spreading into wild plant populations. Finally, it is not season-dependent and can be carried out in a lab throughout the year.
▶️ Answer/Explanation
(a)
Explanation:
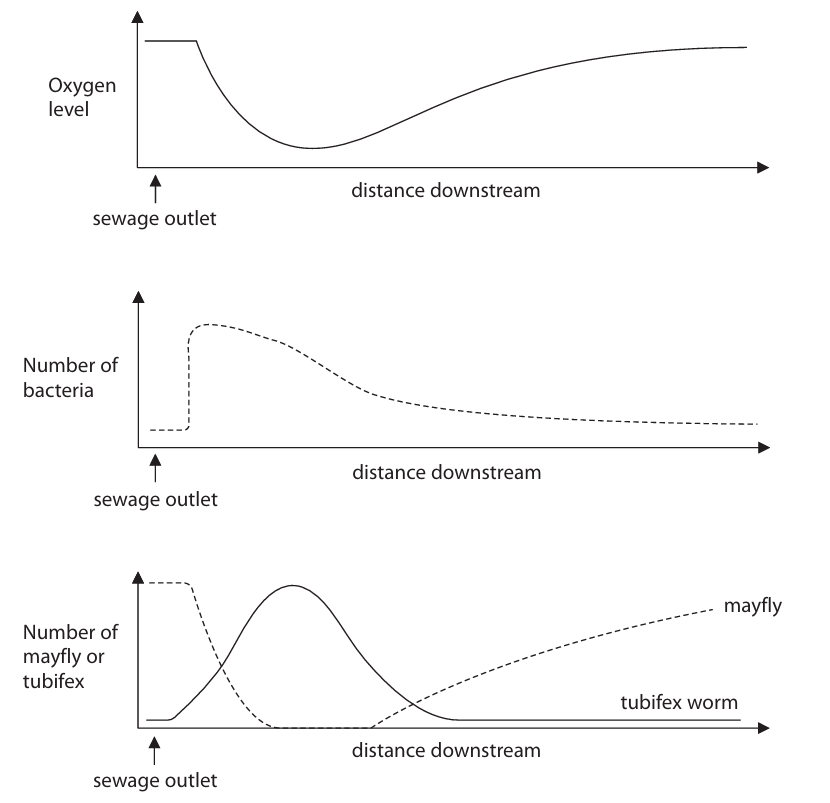
As the distance from the sewage outlet increases, several key changes occur in the river ecosystem, as shown by the graphs and understood through ecological principles.
Initially, right at the sewage outlet, the oxygen level in the water is low. This is because the sewage acts as a rich source of nutrients for bacteria. The bacterial population increases dramatically as they feed on this organic matter. These bacteria respire, consuming a large amount of the dissolved oxygen in the water, leading to oxygen depletion.
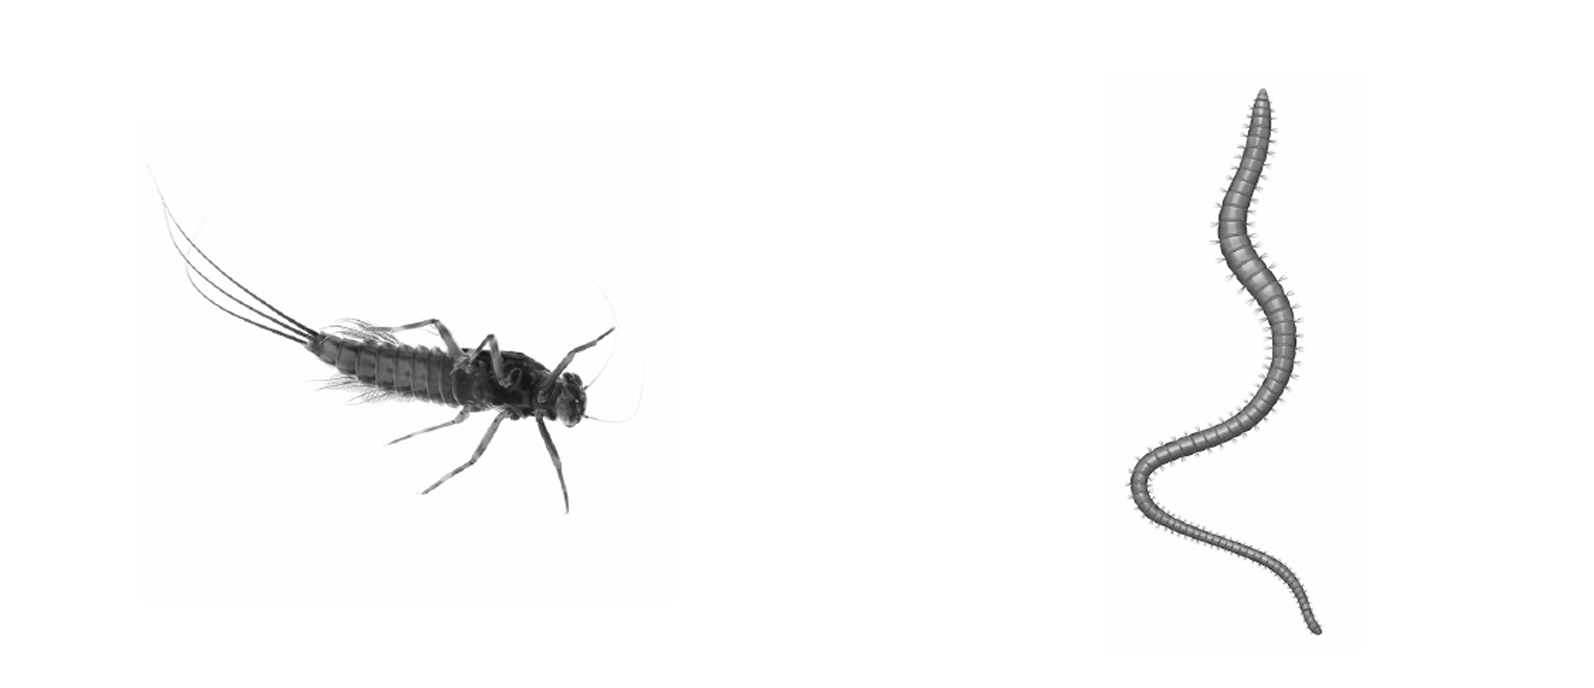
This low-oxygen environment has a direct impact on the larger organisms. Mayfly nymphs, which require high levels of dissolved oxygen to survive, cannot tolerate these conditions. Consequently, their numbers drop to zero near the outlet.
In contrast, tubifex worms are more tolerant of polluted conditions and can survive in water with very low oxygen levels. They thrive by feeding directly on the sewage and the bacteria, so their numbers are high near the outlet.
Further downstream, the concentration of sewage nutrients becomes diluted. With less food available, the bacterial population begins to decrease. As bacterial respiration reduces, the consumption of oxygen decreases, allowing the oxygen levels in the water to gradually recover.
As the oxygen levels return to normal, the habitat becomes suitable again for mayfly nymphs, and their numbers start to increase. Conversely, the conditions become less ideal for tubifex worms, and their numbers begin to decline as the pollution level decreases.
(b)(i)
Explanation:
Biodiversity refers to the variety of life found in a particular ecosystem or habitat. It encompasses two main concepts. First, it refers to the number of different species present (species richness). Second, it considers the relative abundance of individuals within each of those species (species evenness). A habitat with high biodiversity has many different species, each with a healthy population size, indicating a stable and healthy ecosystem.
(b)(ii)
Explanation:
Mayfly nymphs and tubifex worms have different tolerances to pollution, making them excellent bio-indicators.
Mayfly nymphs are very sensitive to pollution and low oxygen levels. Therefore, a high number of mayfly nymphs indicates clean, well-oxygenated, and unpolluted water. If mayfly nymphs are absent or present in very low numbers, it is a strong indicator that the water is polluted.
Tubifex worms, on the other hand, are very tolerant of pollution and can survive in low-oxygen conditions that would kill other organisms. A high number of tubifex worms suggests that the water is polluted and oxygen-depleted. In clean water, their numbers would be very low or zero.
By surveying the relative populations of these two organisms, scientists can get a quick and reliable indication of the pollution level in a river. The presence of mayflies and absence of tubifex worms points to clean water, while the opposite indicates pollution.
▶️ Answer/Explanation
(a)(i) 18.8% (or approximately 19%)
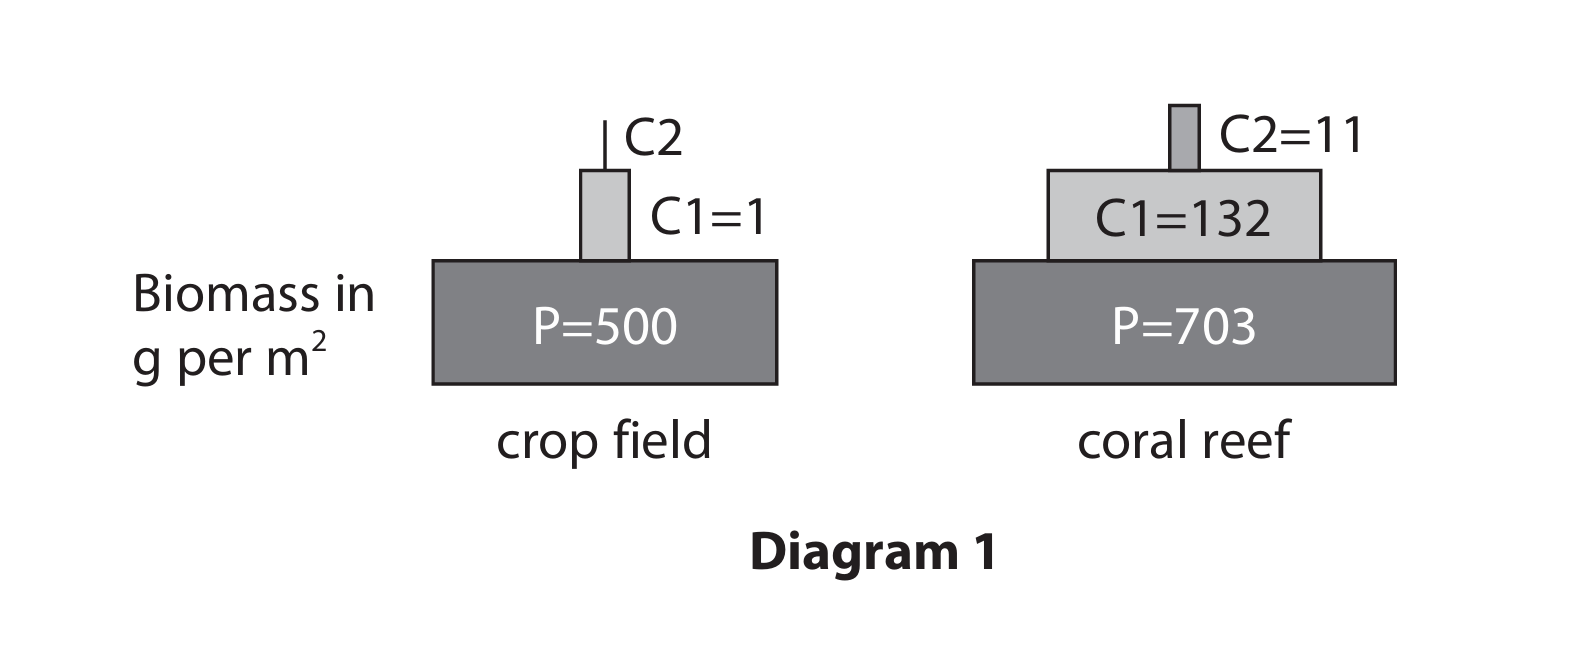
Explanation: The efficiency of biomass transfer from producers (P) to primary consumers (C1) is calculated using the formula:
\[ \text{Efficiency} = \frac{\text{Biomass at C1}}{\text{Biomass at P}} \times 100\% \]
For the coral reef: P = 703 g/m², C1 = 132 g/m².
\[ \text{Efficiency} = \frac{132}{703} \times 100\% \approx 18.8\% \]
This means about 18.8% of the biomass produced by the coral reef’s producers is transferred to the primary consumers.
(a)(ii) 0.01 g per m²
Explanation: The efficiency from primary consumers (C1) to secondary consumers (C2) is given as 1%. For the crop field, C1 biomass is 1 g/m².
\[ \text{C2 Biomass} = 1\% \text{ of } 1 = 0.01 \times 1 = 0.01 \text{ g/m²} \]
So, the biomass of the secondary consumers is only 0.01 grams per square meter.
(a)(iii) The biomass transfer is more efficient in the coral reef because more of the producer biomass is consumed, and there is less energy loss due to factors like heat or movement in the aquatic environment.
Explanation: In aquatic ecosystems like coral reefs, organisms often have lower energy requirements for support and movement compared to terrestrial ecosystems. Additionally, a larger proportion of the primary producers (like algae and phytoplankton) are typically consumed by herbivores, leading to a more efficient transfer of biomass up the food chain.
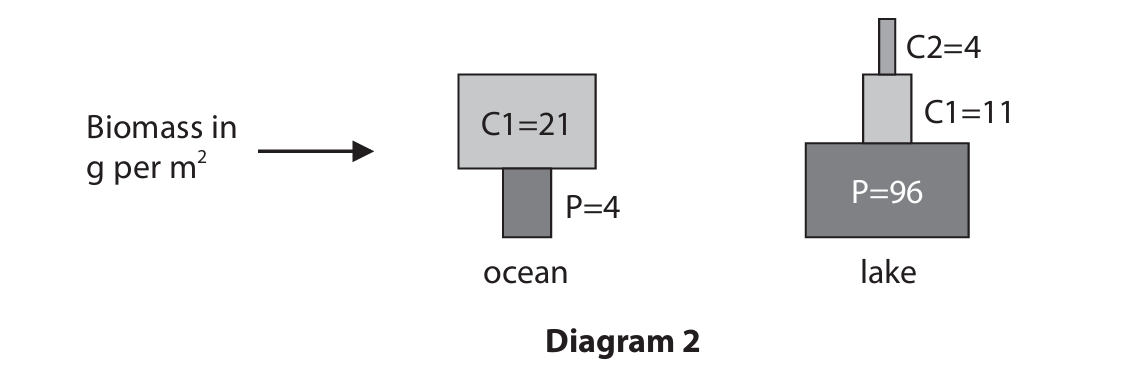
(b) The pyramid of biomass for the ocean is inverted because the producers (phytoplankton) have a very high reproduction rate and are consumed rapidly, so their standing biomass at any one time is low, while the consumers (zooplankton and fish) accumulate more biomass over time.
Explanation: In the ocean, the base of the food chain consists of phytoplankton. These tiny organisms reproduce extremely quickly and are eaten almost as fast as they are produced. This means that although they have a high turnover rate (produce a lot of biomass over time), their actual biomass present at any single moment (standing crop) is low. The consumers that feed on them, like zooplankton and small fish, may have a larger total biomass because they live longer and are not consumed as rapidly. This results in an inverted pyramid of biomass, where the higher trophic levels appear to have more biomass than the producers below them.
(c) Scientists could estimate the energy by sampling the producers using quadrats, collecting the plant material, and then burning it in a calorimeter to measure the heat energy released.
Explanation: To estimate the energy content of the producers in a specific area like 1 m² of a crop field, scientists would first need to collect a representative sample of the plants. They might use a quadrat to randomly select several 1 m² areas within the field. All the plant material (producers) from within these quadrats would be harvested, dried to remove water content (as water doesn’t contain usable energy), and then weighed to get the dry biomass. This dry plant material would then be burned in a device called a bomb calorimeter. The calorimeter measures the heat released when the plant material is completely combusted. This heat energy, measured in joules or calories, gives a direct estimate of the chemical energy stored in the producers’ tissues for that square meter of land.