▶️ Answer/Explanation
(a) An explanation that makes reference to two of the following:
- (number / amount / how many / range) the different species / eq (1)
- number / abundance / how many of each species / eq (1)
- variation / variety (of organisms) (in an ecosystem) / eq (1)
(b)(i) A description that makes reference to the following:
- place at random / eq (1)
- (place quadrats at) co-ordinates / eq (1)
Use random coordinates = 2 marks
(b)(ii) Calculation:
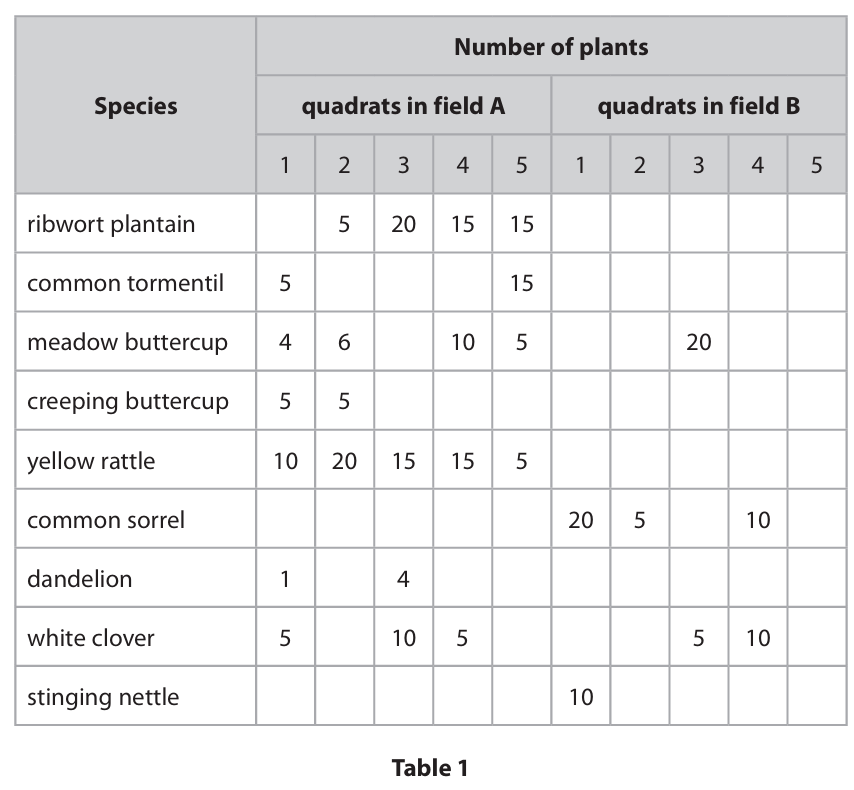
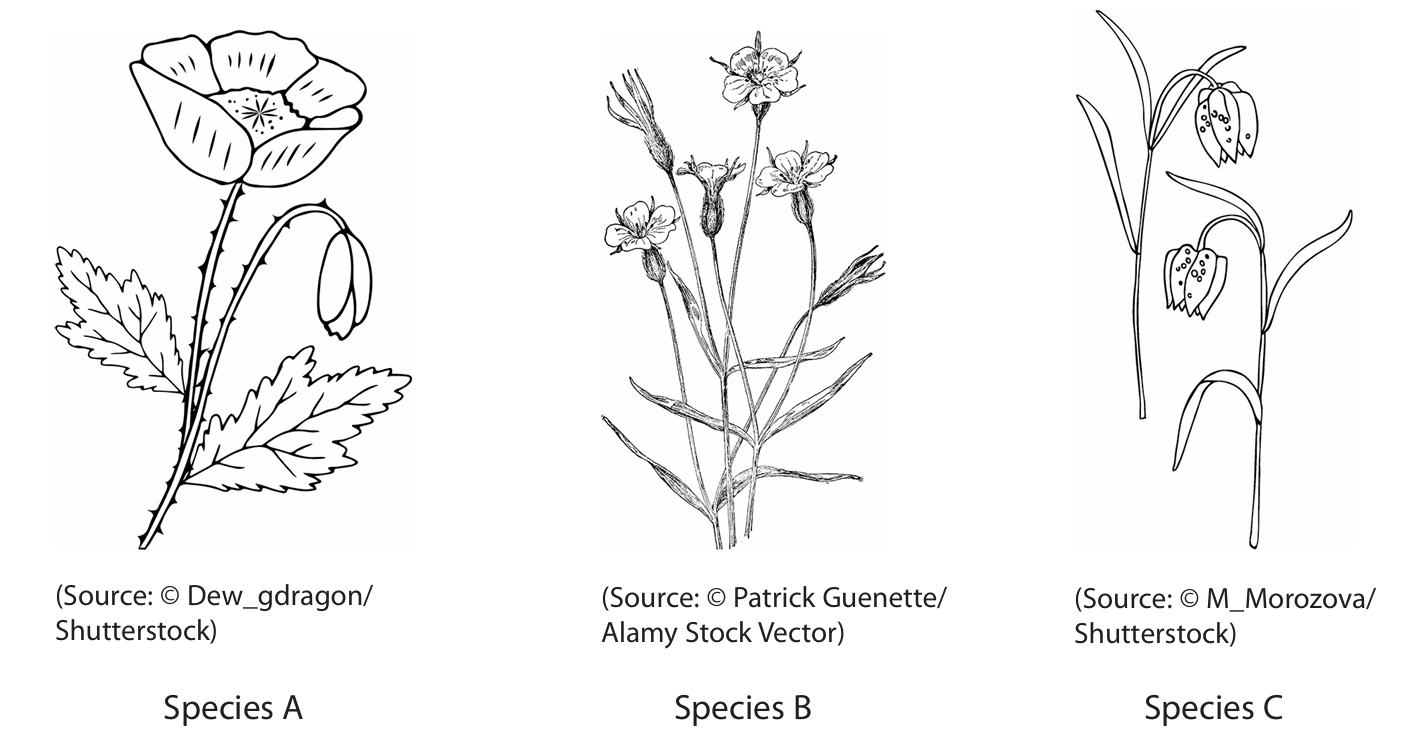
Most frequently occurring species in field B: common sorrel
Total plants counted: \(20 + 5 + 10 = 35\)
Total area sampled: \(5 \times (0.5 \times 0.5) = 5 \times 0.25 = 1.25 \text{ m}^2\)
Number per square metre: \(35 \div 1.25 = 28 \text{ per m}^2\)
Answer: 28
(b)(iii) meadow buttercup (1)
(b)(iv) An answer description that makes reference to five of the following:
- more species present / eq (1)
- more even distribution / similar numbers of each / eq (1)
- common sorrel / stinging nettles absent / eq (1)
- more biodiversity / grazing increases biodiversity / eq (1)
- reliable / repeated / more than one quadrat done in each field / eq (1)
- no information on water / sunlight / temperature / fertilisers / minerals / seasons / eq (1)
- only done on one field / repeat in other fields / eq (1)
- no information about amount of animals / age of animals / duration / eq (1)
- grazing reduces competition allows different species to grow / prevents succession / eq (1)
- grazing provides increased nitrates / minerals / manure / eq (1)
▶️ Answer/Explanation
(a)(i) \(1 : 2.4 : 1\)
Accept \(1: 2.375: 1\)
(a)(ii) A description that makes reference to the following points:
• ethanol / alcohol and add water (1)
• goes white / cloudy / white emulsion forms / milky / eq (1)
OR
• add Sudan III (1)
• red colour (in top layer) (1)
Accept alternative method: rub on paper / eq (1); paper goes transparent / clear / eq (1)
(a)(iii) • growth / repair / enzymes / build muscle / antibodies / eq (1)
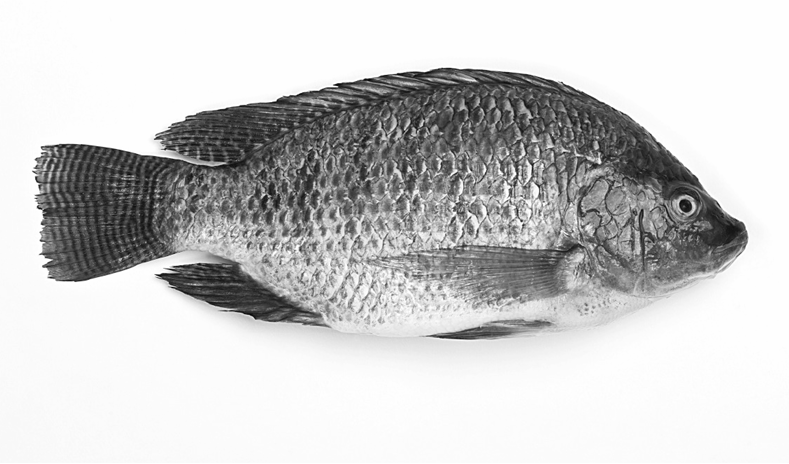
(b)(i) • \(357 \, \text{g per month}\) (2)
Correct answer gains both marks.
Accept one mark for:
\(2500\) (increase) or division by \(7\) or \((3750-1250)\) or \(357.14…\)
(b)(ii) • \(3002 / 3000 \, \text{g}\) (1)
(b)(iii) An answer that makes reference to two of the following points (1 mark each):
• (GM fish) grow more / bigger / faster / eq
• produce less faeces / can digest more efficiently / absorb more / eq
• less respiration / lower metabolic rate / eq
• move less / slower swimming / eq
• eat more food / less food wasted / eq
(b)(iv) • temperature / light (intensity) / oxygen / salinity / pH / eq (1)
(b)(v) An evaluation that makes reference to the following points (up to 5 marks):
1. GM fish grow bigger/faster/harvest sooner / eq (1)
2. less food wasted / more food eaten / eq (1)
3. less faeces / urea / excretion / ammonia / eq (1)
4. less decomposition / fewer decomposers / eq (1)
5. less nitrification / fewer nitrifying bacteria / eq (1)
6. less eutrophication / algal growth / plant growth / eq (1)
7. less oxygen loss / more oxygen in water / eq (1)
8. due to less (bacterial) respiration / (more oxygen for) respiration of animals / eq (1)
9. no information about disease spread / pathogen spread / eq (1)
10. GM fish are (genetically) similar so may be more likely to catch/spread disease / eq (1)
11. not repeated / need more experiments / no idea of sample size / eq (1)
12. (GM) fish that escape may harm food chains / outcompete wild fish / may breed with wild fish / eq (1)
13. did not measure nitrates / eq (1)
▶️ Answer/Explanation
(a)(i) Mark Scheme Summary: A description that makes reference to four of the following points (1 mark each):
- Cut shoot underwater / cut shoot diagonally.
- Ensure apparatus is airtight (e.g., dry leaves, check seals, use petroleum jelly).
- Measure distance bubble moves / distance water moves in capillary tube.
- Measure this movement over a set time.
- Place lamp at different distances from the shoot (to vary light intensity).
- Control other variables (e.g., temperature, humidity).
- Repeat readings / use reservoir to reset bubble.
(a)(ii) Water loss / distance moved by bubble / volume of water taken up / time taken to move bubble / rate of bubble movement.
Accept: water uptake / transpiration speed.
(b)(i) An explanation that makes reference to two of the following (1 mark each):
- More water loss as light intensity increases (more transpiration/evaporation).
- Because (more) stomata open / stomata open wider.
- Until all stomata are open (completely) / until stomata are fully open.
(b)(ii) An explanation that makes reference to three of the following (1 mark each):
- Desert plant loses less water in total / retains/conserves water.
- Water is lost in low light / water is not lost in high light (water loss decreases as light intensity increases for desert plant).
- Stomata close in light/day / stomata open in dark/night (reverse of normal plants).
- Desert plants have fewer stomata.
- This adaptation reduces wilting / stops plant going flaccid.
▶️ Answer/Explanation
(a) B (1 and 3 only)
A is incorrect as yeast has no nervous system
C is incorrect as yeast has no nervous system
D is incorrect as yeast has no nervous system
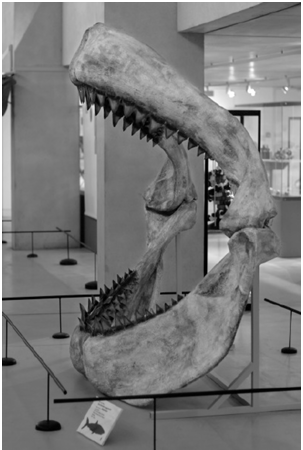
(b) An explanation that makes reference to three of the following:
• competition (between megalodon and whales) (1)
• whales ate more food / eq (1)
• whales better adapted / swam faster / better at feeding / better at hunting / eq (1)
• whales survived / eq (1)
• whales reproduced more / had more offspring / eq (1)
Accept less food left for megalodon / no food / megalodon starve. Accept megalodon less well adapted. Accept megalodon did not survive/died (out). Ignore extinct.
(c) (i) A description that makes reference to two of the following:
• acid rain (1)
• deforestation / death of trees / death of plants / eq (1)
• death of fish / death of animals in lakes / loss of species in lakes or rivers / eq (1)
Accept sulphuric acid. Accept damages plants/trees. Accept loss of food chains/biodiversity.
(ii) An explanation that makes reference to three of the following:
• (less) photosynthesis (1)
• so less glucose / sugar / starch / eq (1)
• fewer producers / fewer plants / less mass of producers / producers die / plants do not grow as much / eq (1)
• less food for consumers / less energy for consumers / eq (1)
Ignore ‘cannot produce food’ for mp2. Accept fewer consumers/herbivores/carnivores.
(d) (i) An answer that makes reference to two of the following:
• prevents osmosis / less osmosis (1)
• so water will not enter cells / eq (1)
• so cells do not burst / eq (1)
Accept osmosis would occur if in water. Accept cells burst if in water.
(ii) A description that makes reference to four of the following:
• place diploid nucleus into enucleated egg cell / place body cell nucleus into enucleated egg cell / eq (1)
• electric shock / eq (1)
• mitosis / cell division / eq (1)
• place embryo into uterus / womb (1)
• of surrogate (mother) (1)
Accept fuse body cell with enucleated egg. Accept empty egg cell for enucleated egg cell.
(e) A description that makes reference to three of the following:
Negative:
• mammoth population increases / over-population occurs / eq (1)
• mammoth eats too much food / less food for other species / eq (1)
Positive:
• less global warming / less greenhouse effect / eq (1)
• decomposition of faeces / decay of dead mammoths (1)
• more amino acid / protein / DNA / chlorophyll synthesis in plants / eq (1)
• (soil nutrients means) more plants / increased plant growth / eq (1)
Accept high mammoth reproduction rate. Accept overeats prey / prey could go extinct. Accept less greenhouse gas. Accept better plant growth.
▶️ Answer/Explanation
5 (a)(i)
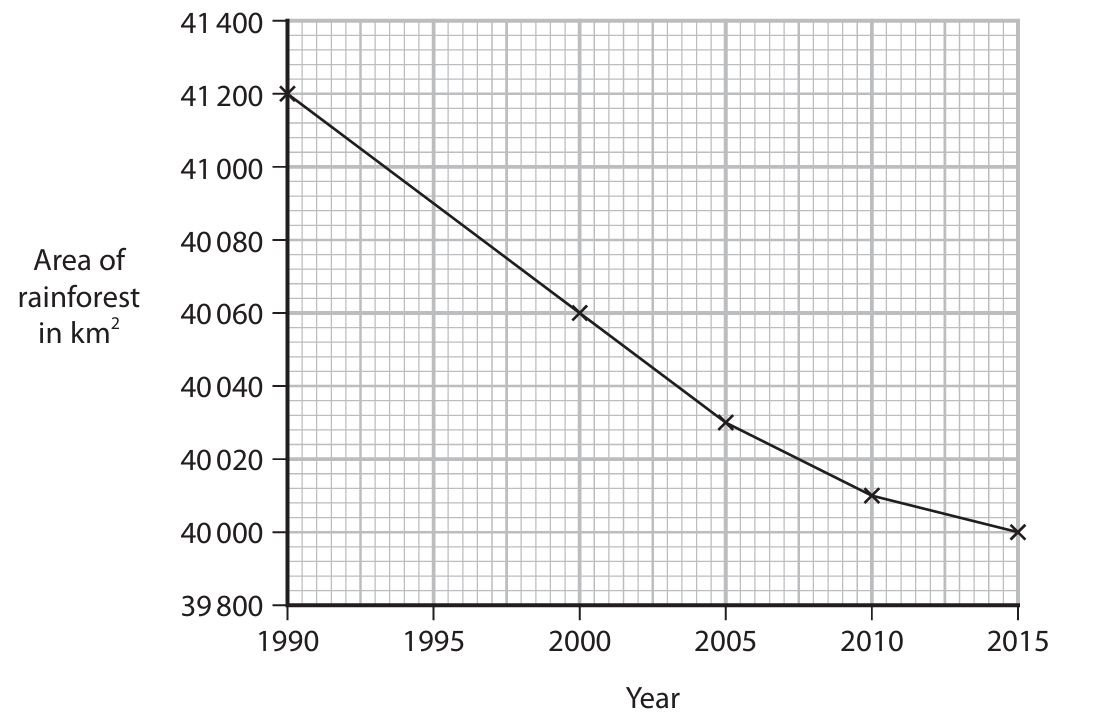
Answer: 48 km² per year
Detailed Explanation:
To calculate the mean rate of decrease, we need to find the total decrease in rainforest area over the 25-year period (1990 to 2015) and then divide by the number of years.
From the graph, we can see that in 1990 the rainforest area was approximately 41,200 km², and by 2015 it had decreased to approximately 40,000 km².
The total decrease is: 41,200 km² – 40,000 km² = 1,200 km²
The time period is: 2015 – 1990 = 25 years
Therefore, the mean rate of decrease per year is: 1,200 km² ÷ 25 years = 48 km² per year
This means that on average, the Earth lost 48 square kilometers of rainforest each year during this period.
5 (a)(ii)
Detailed Explanation:
An increase in atmospheric carbon dioxide gas has several negative effects on the environment:
First, carbon dioxide is a greenhouse gas that contributes significantly to the greenhouse effect. This means it traps heat in the Earth’s atmosphere, leading to global warming and an overall increase in Earth’s temperature.
This temperature rise causes polar ice caps and glaciers to melt, which in turn leads to rising sea levels. Higher sea levels can cause flooding in coastal areas, resulting in habitat loss for both human and animal populations.
Additionally, increased CO₂ levels contribute to climate change, which alters weather patterns worldwide. This can result in more frequent and severe extreme weather events such as storms, droughts, and desertification, making some regions less habitable and disrupting agricultural systems.
The changing climate also affects ecosystems, leading to extinctions as species struggle to adapt to new conditions. It can change the distribution of organisms, force migrations, spread pests, and disrupt food chains.
Another significant effect is ocean acidification. When CO₂ dissolves in seawater, it forms carbonic acid, lowering the ocean’s pH. This acidification harms marine life, particularly organisms with calcium carbonate shells or skeletons, and can lead to coral reef bleaching.
5 (b)(i)
Detailed Explanation:
Microorganisms play essential roles in converting organic waste into nitrate ions through the process of decomposition and the nitrogen cycle.
Decomposers, primarily bacteria and fungi, break down organic waste material containing nitrogen compounds like proteins. Through the process of ammonification, these decomposers convert the nitrogen in organic matter into ammonia (NH₃) or ammonium ions (NH₄⁺).
Next, specific nitrifying bacteria convert ammonium into nitrite ions (NO₂⁻). Another group of nitrifying bacteria then oxidize these nitrite ions into nitrate ions (NO₃⁻), which is the form most readily absorbed by plants.
This entire process, known as nitrification, is crucial for making nitrogen available to plants and maintaining the nutrient cycle in aquatic ecosystems like rivers.
5 (b)(ii)
Detailed Explanation:
Recording only the number of different animal species does not provide a complete measure of biodiversity because it ignores several important factors:
This measure doesn’t account for the population sizes or abundance of each species. An ecosystem might have many species but be dominated by just one or two of them, which isn’t reflected in a simple species count.
It also fails to consider other kingdoms of organisms such as plants, bacteria, fungi, and protoctists, which are all important components of ecosystem biodiversity.
Additionally, some species may be seasonal or migratory, meaning they’re only present at certain times of year. A survey conducted at one time might miss these species, giving an incomplete picture of the true biodiversity.
5 (b)(iii)
Detailed Explanation:
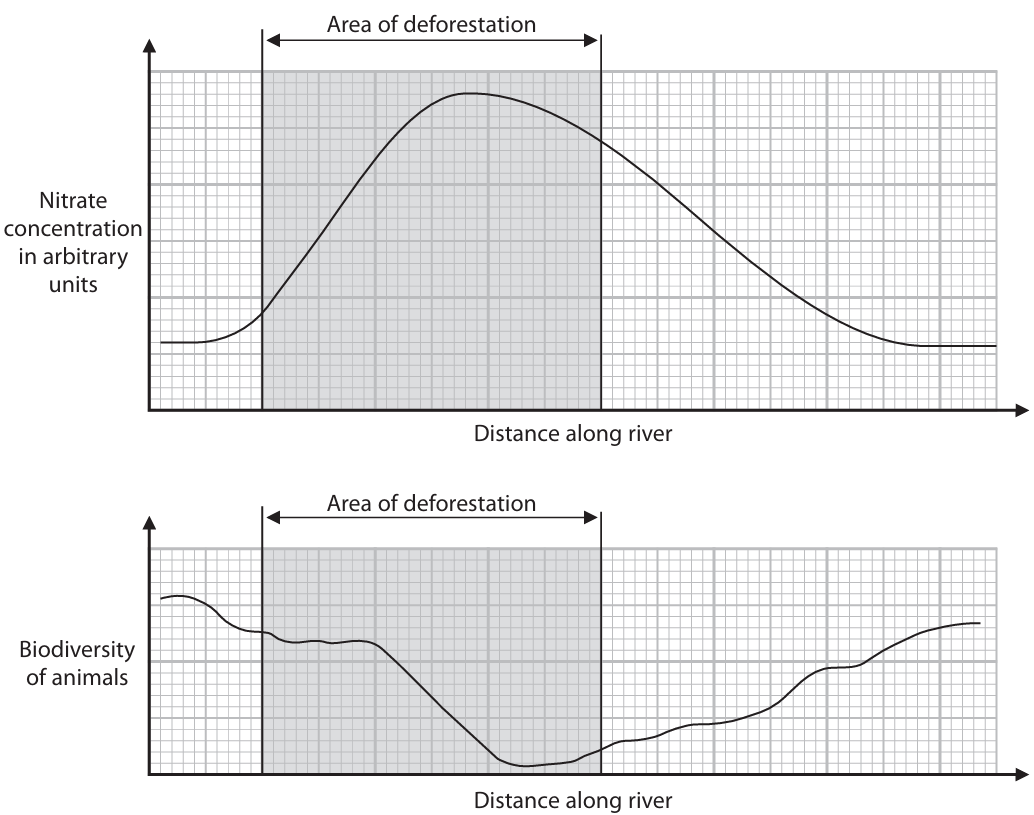
The graphs show that as nitrate concentration increases (particularly after the deforested area), biodiversity of animals in the river decreases. This relationship can be explained through a process called eutrophication.
Deforestation leads to soil erosion and runoff, which carries minerals and organic waste into the river. This includes nitrates from decomposed organic matter and possibly fertilizers from agricultural activities following deforestation.
The increased nitrate levels act as nutrients, causing excessive growth of algae and aquatic plants in a process called eutrophication. The algal growth forms blooms on the water surface that block light penetration to deeper water.
With reduced light, submerged plants cannot photosynthesize effectively and eventually die. The dead plant material, along with the algae (which also eventually die), provides more organic matter for decomposers.
As bacteria decompose this increased organic matter, they respire, consuming oxygen from the water. This leads to oxygen depletion in the river.
The low oxygen levels cause fish and other animal species to die because they cannot respire adequately. This results in decreased biodiversity as more sensitive species disappear from the ecosystem.
Additionally, deforestation may directly cause habitat loss and disruption of food chains, further contributing to the decline in biodiversity observed in the graph.
▶️ Answer/Explanation
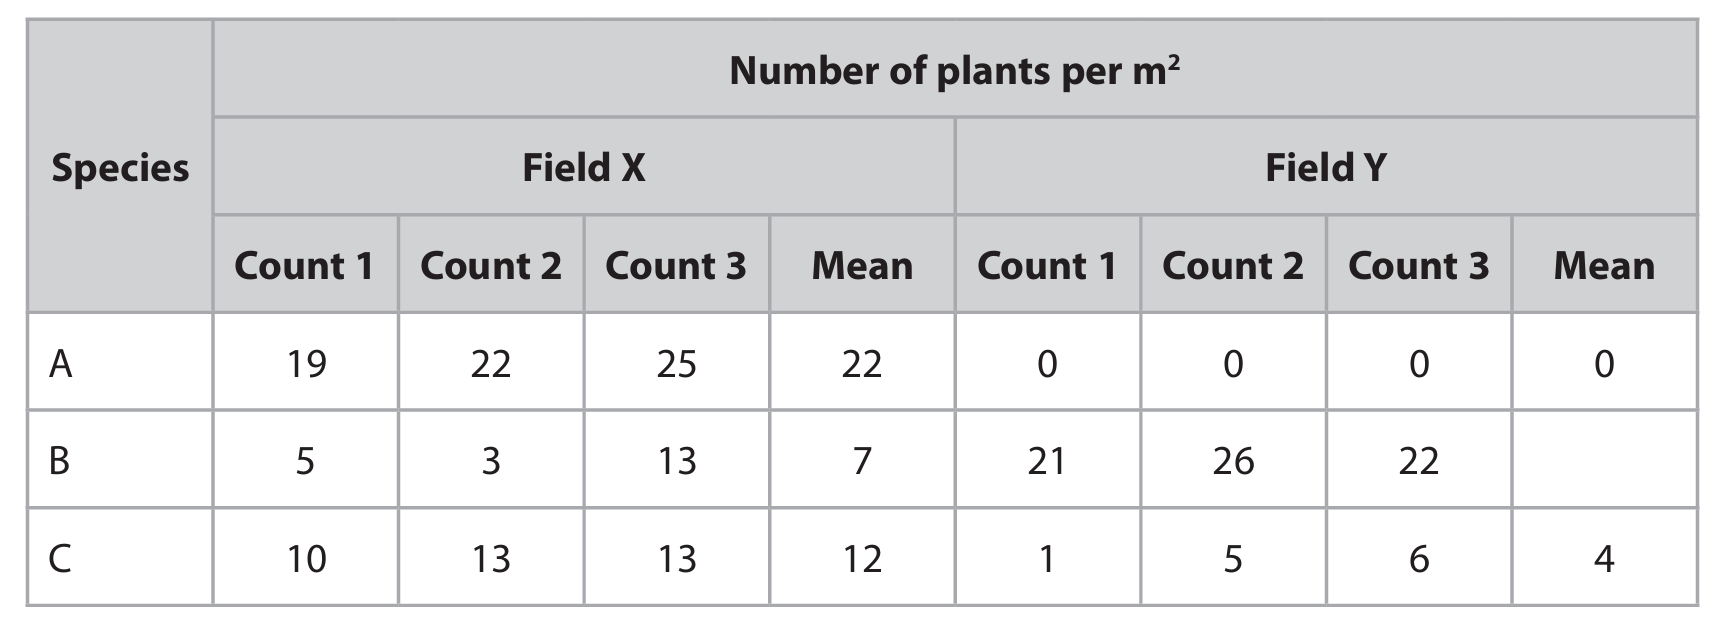
(a)(i) 23 per m²
Explanation: To calculate the mean number of plants of species B in Field Y, we add the three count values and divide by 3:
Mean = (21 + 26 + 22) ÷ 3 = 69 ÷ 3 = 23 plants per m²
(a)(ii)
Explanation: Scientists could determine the number of each plant species per m² by using a quadrat sampling method. First, they would place a quadrat (typically a square frame of known area, often 1m²) randomly in the field using random number generators or coordinates to ensure unbiased sampling. Within each quadrat, they would count the number of individuals of each plant species present. This process would be repeated multiple times in different random locations to get a representative sample. Finally, they would calculate the average number of plants per m² for each species by dividing the total count by the number of quadrats used and then by the area of each quadrat.
(b)
Explanation: The results show distinct differences in species distribution and biodiversity between the two fields. Field X contains all three species (A, B, and C), while Field Y lacks species A entirely and has only species B and C. This indicates that Field X has greater species richness.
In terms of distribution, Field X shows relatively consistent numbers for species A (mean 22, with counts 19, 22, 25) and species C (mean 12, with counts 10, 13, 13), suggesting even distribution. However, species B in Field X shows more variation (counts 5, 3, 13) with a mean of 7, indicating uneven distribution.
In Field Y, species B is dominant with a high and consistent mean of 23 (counts 21, 26, 22), showing even distribution. Species C in Field Y has a lower mean of 4 with more variation (counts 1, 5, 6), indicating uneven distribution.
Overall, Field X has greater biodiversity as it contains more species with relatively even distribution, while Field Y has lower biodiversity dominated by species B with limited presence of species C and absence of species A.
(c) Temperature / Water / Sunlight / Wind speed / Mineral ions / Soil pH
Explanation: Abiotic factors are non-living environmental factors that can influence plant distribution. Temperature affects enzyme activity and metabolic rates; water availability is crucial for photosynthesis and transport; sunlight provides energy for photosynthesis; wind speed affects transpiration rates and physical damage; mineral ions in the soil are essential for plant growth and development; soil pH affects nutrient availability and enzyme function.
▶️ Answer/Explanation
(a) Plants that have been dug up and transported are at most risk of drying out because their roots (and root hair cells) are damaged or not in soil/exposed. This means water cannot be absorbed or taken up effectively. Additionally, water continues to be lost through transpiration or evaporation from the leaves, creating a water deficit that the damaged root system cannot replenish.
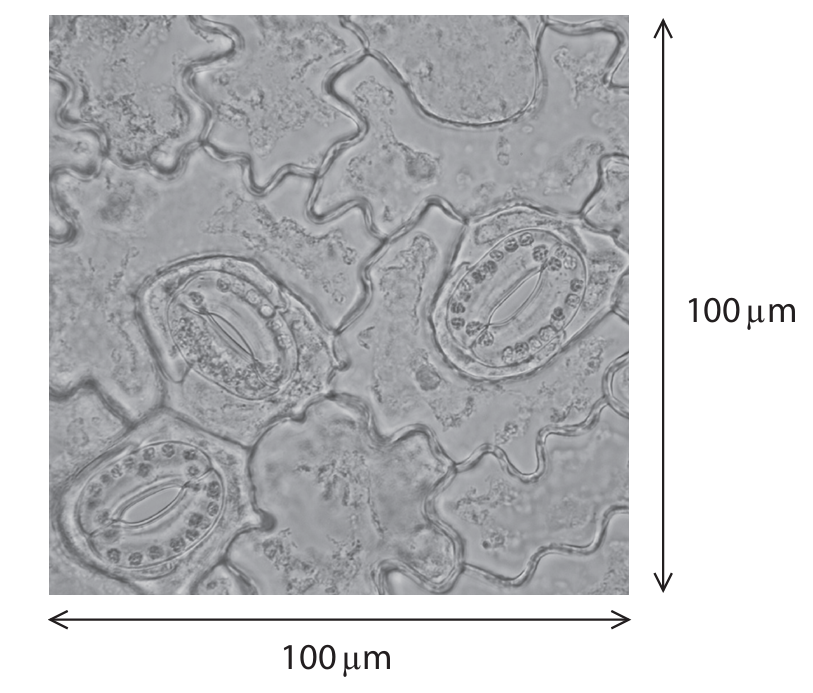
(b) number of stomata per mm² = 300
Explanation: The photograph shows an area of 100 μm × 100 μm, which contains 3 stomata. To find the number per mm²:
1 mm = 1000 μm, so 1 mm² = 1000 μm × 1000 μm = 1,000,000 μm².
The area of the photograph is 100 μm × 100 μm = 10,000 μm².
So, the number of stomata per mm² = (number in photo ÷ area of photo) × area of 1 mm² = (3 ÷ 10,000) × 1,000,000 = 300.
(c) Stomatal regulators reduce photosynthesis because they cause the stomatal pores to close or become smaller. This reduces the amount of carbon dioxide that can diffuse into the leaf. Since carbon dioxide is a key reactant in photosynthesis, a reduced supply limits the rate at which photosynthesis can occur.
(d)(i) Reflective compounds should only be applied to the upper surface of a leaf because the stomata are mainly or only located on the lower surface in most plants. Applying the coating only to the upper surface ensures the stomatal pores are not blocked, allowing gas exchange (carbon dioxide absorption and oxygen release) to continue uninterrupted. Additionally, the upper surface receives the most direct sunlight, so applying the reflective coating there is most effective at reducing heat absorption.
(d)(ii) Reducing leaf temperature reduces the transpiration rate because lower temperatures decrease the kinetic energy of water molecules. With less energy, water molecules move more slowly and are less likely to evaporate from the leaf surface (especially from the stomata). This reduces the rate of diffusion of water vapor out of the leaf, thereby lowering the transpiration rate.
(e) Nitrate ions (NO₃⁻) play a crucial role in plant growth. They are absorbed from the soil and are used by the plant to synthesize amino acids. These amino acids are then built up into proteins, which are essential for growth (e.g., enzymes for metabolic reactions, structural proteins for cell walls) and development.
Alternatively, magnesium ions (Mg²⁺) are a key component of chlorophyll, the pigment that absorbs light energy for photosynthesis. Without sufficient magnesium, chlorophyll production is impaired, leading to reduced photosynthesis and stunted growth.
(f) Water is transported from the soil to the leaves through the following process:
1. Water is absorbed from the soil by root hair cells through osmosis. Root hairs increase the surface area for absorption.
2. Osmosis occurs because the soil water is a dilute solution (higher water potential) compared to the concentrated cell sap inside the root hair cells (lower water potential).
3. Once inside the root, water moves across the cortex and into the xylem vessels.
4. Water is then transported upwards through the xylem to the leaves due to transpiration pull. This is a suction force created by the evaporation of water from the surfaces of mesophyll cells in the leaves and its subsequent diffusion out of the stomata.
5. The cohesion (water molecules sticking together) and adhesion (water molecules sticking to the xylem walls) properties of water help maintain a continuous column of water from the roots to the leaves.
▶️ Answer/Explanation
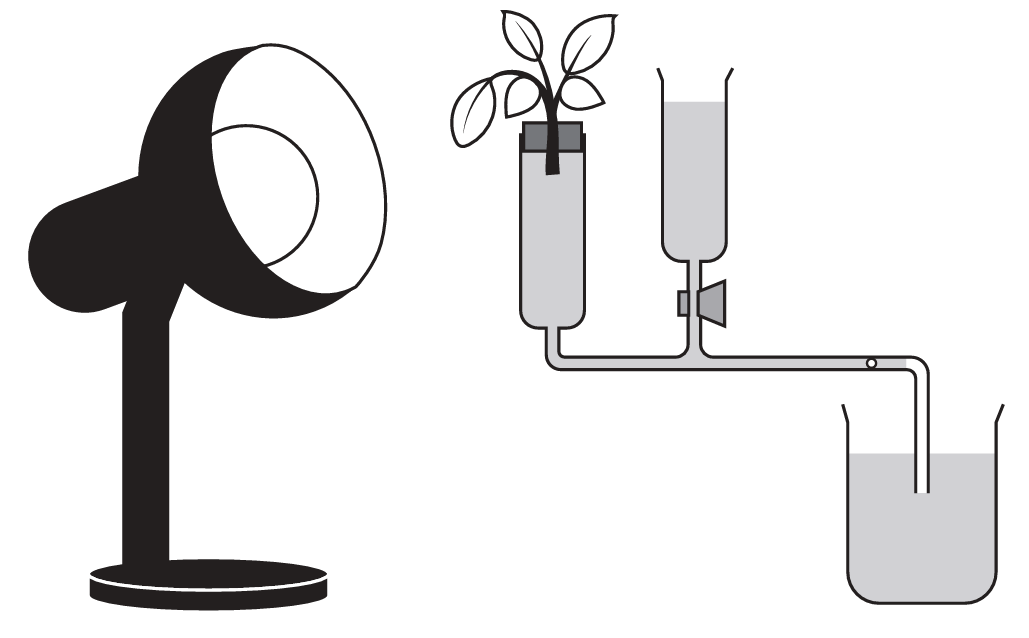
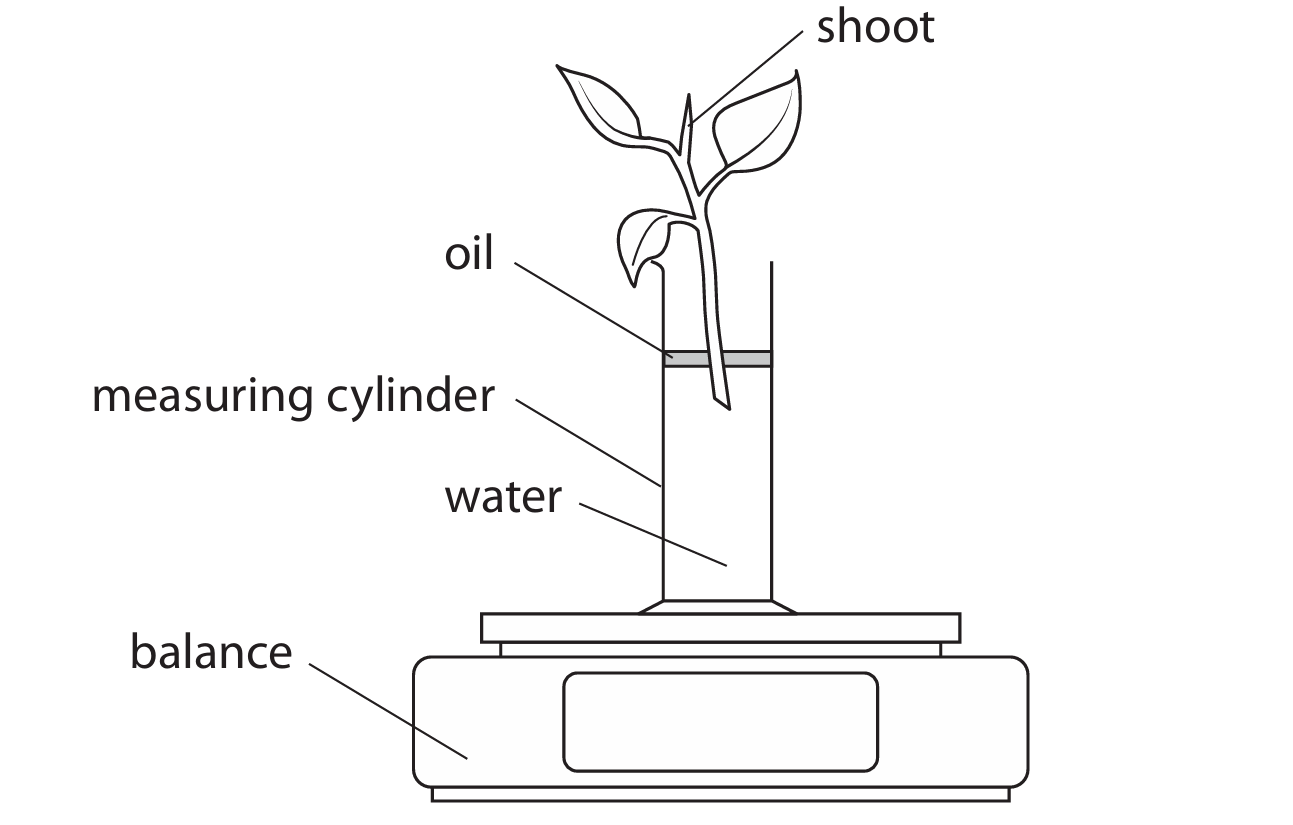
(a) To prevent evaporation from the surface of the water.
Explanation: The oil creates a physical barrier on top of the water surface. This prevents water molecules from evaporating into the air, ensuring that any changes in water volume in the measuring cylinder are due to water uptake by the plant shoot rather than evaporation. Without this oil layer, we wouldn’t be able to accurately measure how much water the plant is actually taking up.
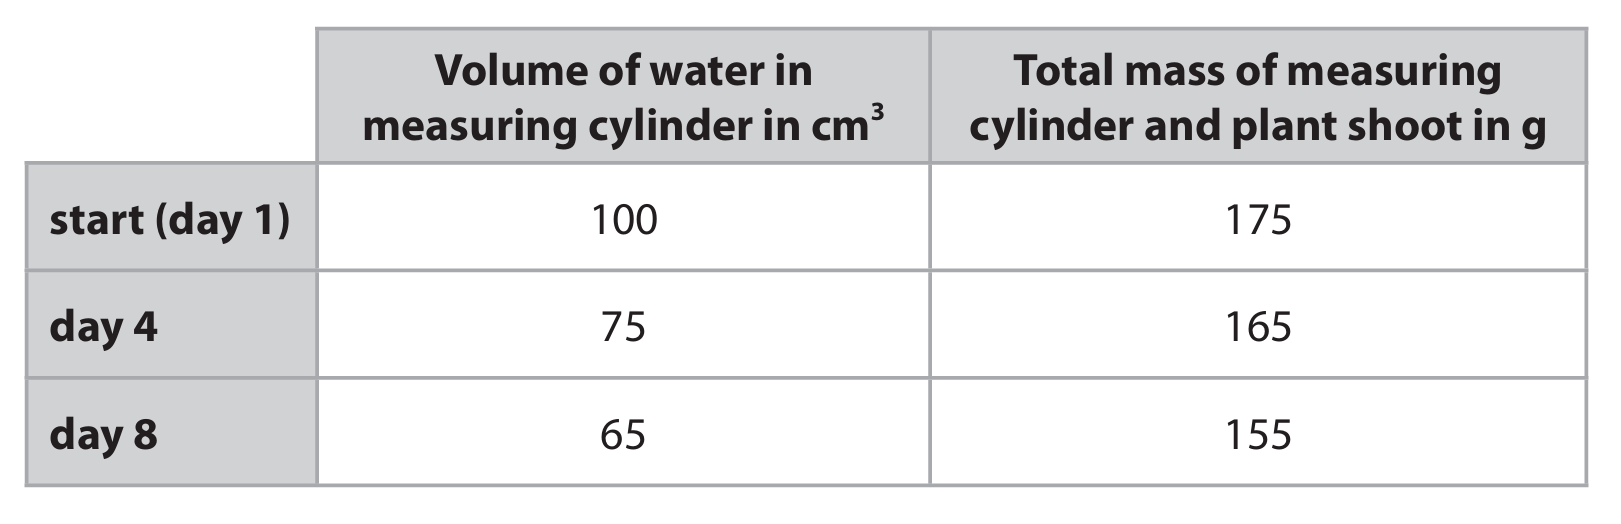
(b)(i) Mean rate = 4.4 cm³ per day
Explanation: To calculate the mean rate of water uptake:
Total water uptake = Initial volume – Final volume = 100 cm³ – 65 cm³ = 35 cm³
Total time = 8 days
Mean rate = Total water uptake ÷ Total time = 35 cm³ ÷ 8 days = 4.375 cm³/day
Rounded to one decimal place, this gives us 4.4 cm³ per day.
(b)(ii) Both the volume of water and the total mass decrease over time, but the volume decreases more than the mass.
Explanation: Looking at the data, we can see that after 8 days, the water volume decreased by 35 cm³ (from 100 cm³ to 65 cm³), while the total mass decreased by only 20 g (from 175 g to 155 g). This difference occurs because not all water taken up by the plant is lost through transpiration – some is retained within the plant cells for maintaining turgor pressure, some is used in photosynthesis, and some is stored. The plant is essentially accumulating water while simultaneously losing it through transpiration. Between days 4 and 8, both water uptake and water loss occur at similar rates, as indicated by the parallel changes in volume and mass.
(c) The rate of water loss would increase with a fan.
Explanation: A working fan would increase the rate of transpiration (water loss) from the plant. This happens because the fan moves air across the leaf surface, which carries away water vapor that has evaporated through the stomata. This maintains a steeper concentration gradient between the moist air inside the leaf and the drier air outside, accelerating diffusion. Additionally, the fan disrupts the still, humid boundary layer of air that typically forms around leaves, replacing it with drier air that can accept more water vapor. All these factors combined would result in increased water loss from the plant shoot.
▶️ Answer/Explanation
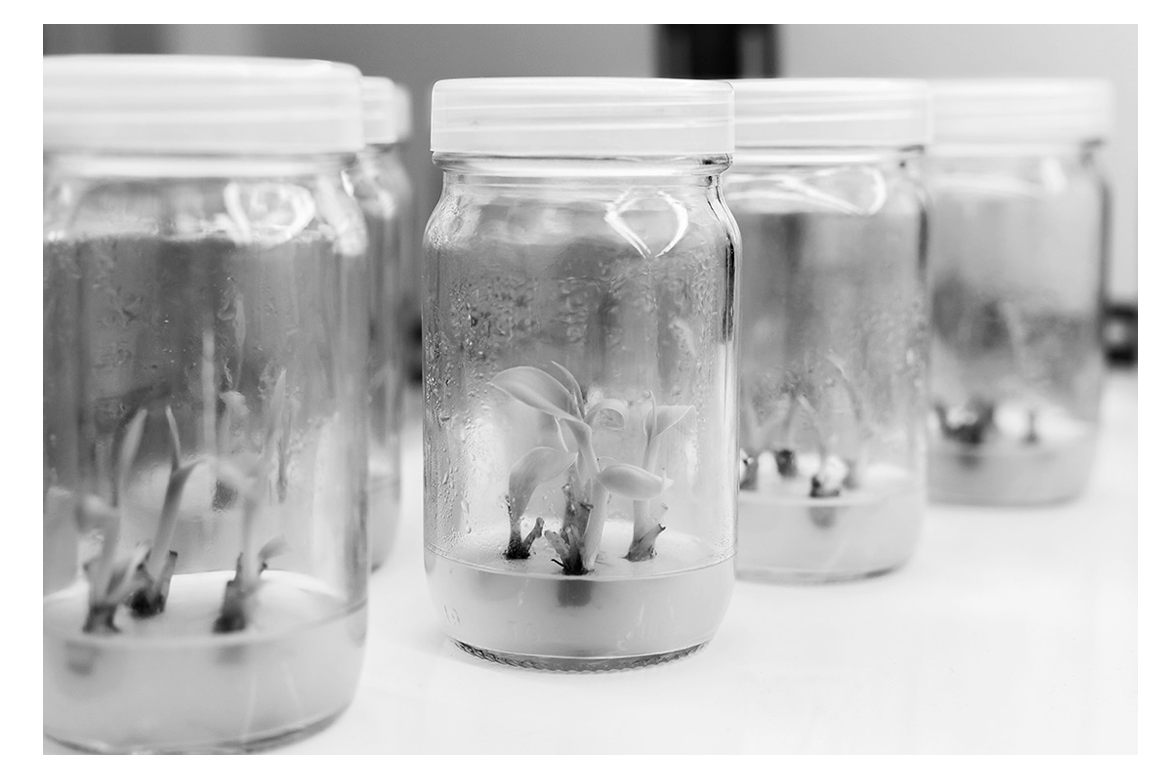
(a) In a test tube / culture dish / jar / glass / petri dish / container / in culture solution / in a lab / outside a living organism.
Explanation: The term “in vitro” literally means “in glass” in Latin, referring to biological processes that are conducted outside of a living organism in an artificial laboratory environment, such as in test tubes or petri dishes. This contrasts with “in vivo” experiments which are conducted within living organisms.
(b) Plant cells can differentiate into all/different types of tissues or specialized cells throughout the plant’s life and can form/regenerate a whole new plant.
Explanation: Plant cells exhibit totipotency, meaning that even mature, differentiated plant cells retain the ability to dedifferentiate and then redifferentiate into any cell type needed to regenerate an entire plant. This is why you can grow a new plant from a cutting. In contrast, human cells have much more limited differentiation capabilities. While stem cells can differentiate into various cell types, most human cells become permanently specialized during development and cannot revert back or form entirely new organisms.
(c)
1. Nitrate – for making amino acids/proteins/DNA/nucleic acids
2. Magnesium – for making chlorophyll/chloroplasts/photosynthesis
Explanation: Plant tissue culture media must contain essential minerals that support plant growth and development. Nitrate is crucial as it provides nitrogen, which is a fundamental component of amino acids, proteins, and nucleic acids (DNA and RNA). Without adequate nitrogen, plants cannot synthesize these essential biomolecules. Magnesium is a central component of the chlorophyll molecule, which is vital for photosynthesis as it captures light energy. Without magnesium, plants cannot produce chlorophyll effectively, leading to chlorosis (yellowing of leaves) and impaired photosynthesis.
(d) Enzymes are affected by pH/ work best at optimum pH. If pH changes, the shape of the active site can change/be denatured so substrates can no longer bind.
Explanation: Maintaining a constant pH is critical because enzymes, which catalyze all biochemical reactions in plant cells, are highly sensitive to pH changes. Each enzyme has an optimal pH range where it functions most efficiently. If the pH deviates from this range, the enzyme’s three-dimensional structure can be altered, changing the shape of its active site. This prevents substrates from binding properly, effectively denaturing the enzyme and halting the metabolic reactions it catalyzes. This would severely disrupt plant growth and development in the culture media.
(e) Place a shoot in light from one side/unidirectional light and another shoot in darkness/light all around. Leave both for a stated time/use shoots of same type/same temperature/other control variable. Observe/measure bending or growing towards light.
Explanation: To demonstrate phototropism (growth response to light), you would set up two identical young plant shoots. One would be placed in a location with light coming from only one direction (e.g., near a window), while the control would be placed in either complete darkness or with light evenly distributed from all sides. Both plants should be kept under the same temperature and watering conditions to ensure any differences are due to light direction only. After a few days, you would observe that the shoot exposed to unilateral light has bent toward the light source. This bending occurs because auxin hormone accumulates on the shaded side of the stem, promoting more cell elongation on that side and causing the stem to curve toward the light.
(f) To maintain biodiversity/reduce damage to ecosystems and to prevent extinction/keep species for future generations/for medicinal properties.
Explanation: Conserving endangered plant species is crucial for several reasons. Firstly, it maintains biodiversity, which ensures ecosystem stability and resilience. Each plant species plays a unique role in its ecosystem, and losing one can disrupt food webs and ecological balance. Secondly, it prevents extinction, preserving genetic diversity that might be valuable for future breeding programs, especially as climate changes. Many plants contain compounds with medicinal properties; for example, aspirin originated from willow bark. By conserving endangered species, we preserve potential future medicines and genetic resources that could be vital for human well-being.
(g) Agitation mixes contents/mixes oxygen/with plant cells. Light is for photosynthesis. Suitable temperature is for enzyme action.
Explanation: Suspension cultures require specific conditions to mimic optimal natural environments. Agitation (shaking or stirring) ensures that cells and nutrients are evenly distributed throughout the liquid media, preventing sedimentation. It also promotes gas exchange, ensuring oxygen (needed for respiration) is available and carbon dioxide (a product of respiration) is removed. Light is essential for photosynthetic plant cells to produce their own energy through photosynthesis. Maintaining a suitable temperature is critical because temperature affects enzyme activity; most plant enzymes function optimally around 25-30°C. Temperatures that are too high can denature enzymes, while temperatures that are too low can slow down metabolic processes to inadequate levels.

▶️ Answer/Explanation
(a) C (UAAGGCUCA)
Explanation: To find the complementary mRNA sequence, we need to remember two key rules: RNA uses uracil (U) instead of thymine (T), and the base pairing rules are A→U, T→A, C→G, and G→C. Starting with the DNA strand ATTCCGAGT, we pair A with U, T with A, T with A, C with G, C with G, G with C, A with U, G with C, and T with A. This gives us the mRNA sequence UAAGGCUCA.
Option A is incorrect because it contains T (thymine), which is not found in RNA. Option B is simply the original DNA strand and also contains T. Option D has the incorrect complementary sequence (it should be UAAGGCUCA, not AUUCCGAGU).
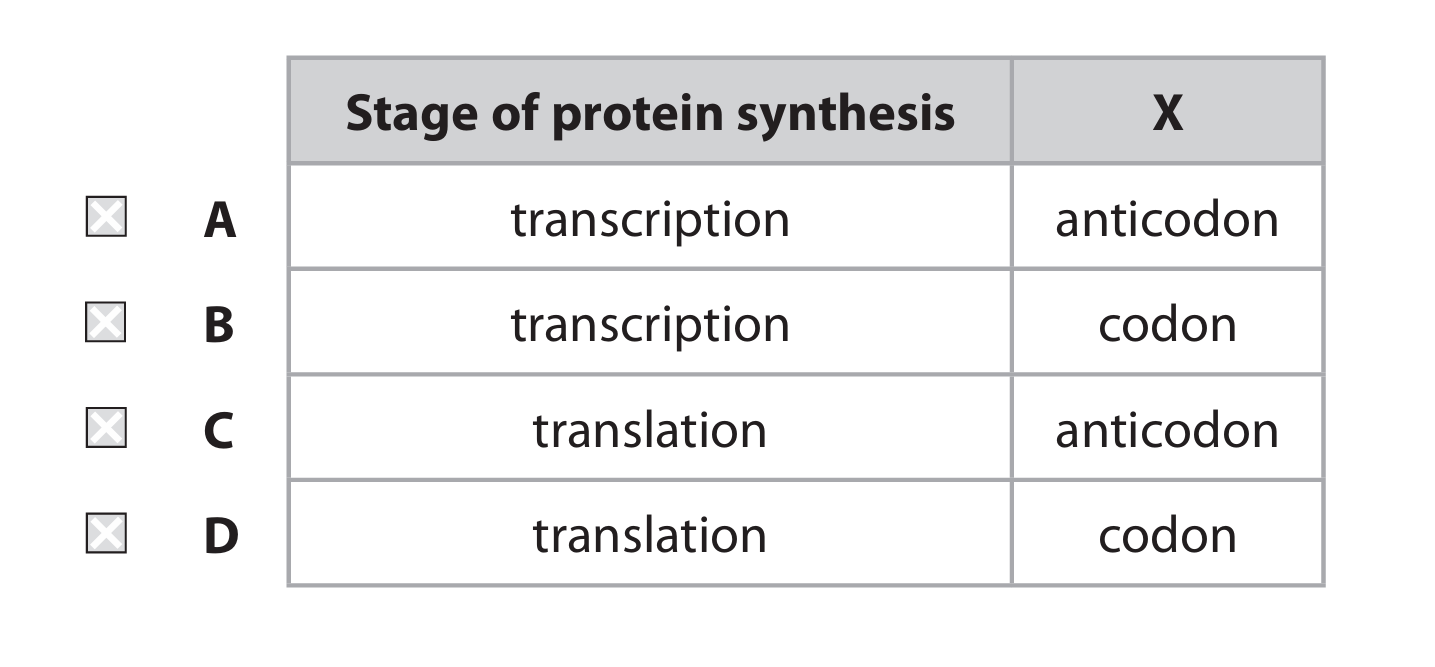
(b) C (translation, anticodon)
Explanation: The diagram shows protein synthesis occurring at a ribosome, which is the site of translation – the process where mRNA is decoded to build a protein. The sequence of bases labelled X is part of a tRNA molecule, specifically the anticodon region that pairs with the complementary codon on the mRNA strand.
Options A and B are incorrect because transcription is the process of making mRNA from DNA in the nucleus, not what’s shown here. Option D is incorrect because while it correctly identifies translation, the sequence X is an anticodon (on tRNA), not a codon (on mRNA).
(c)
Explanation: A mutation is a rare, random change in the DNA sequence that can affect an organism’s phenotype in several ways. First, the mutation changes the sequence of nucleotides in the DNA. This altered DNA sequence is transcribed into mRNA, and since the genetic code is read in triplets (codons), this can change which amino acids are incorporated into the resulting protein during translation.
If the protein is an enzyme, the mutation might change the shape of its active site, making it less effective or completely non-functional. Since enzymes control metabolic reactions, this could disrupt normal cellular processes. The changed protein structure and function ultimately leads to an altered phenotype – the observable characteristics of the organism. The effect can range from beneficial to harmful to neutral, depending on the specific mutation and environmental conditions.
(d)(i)
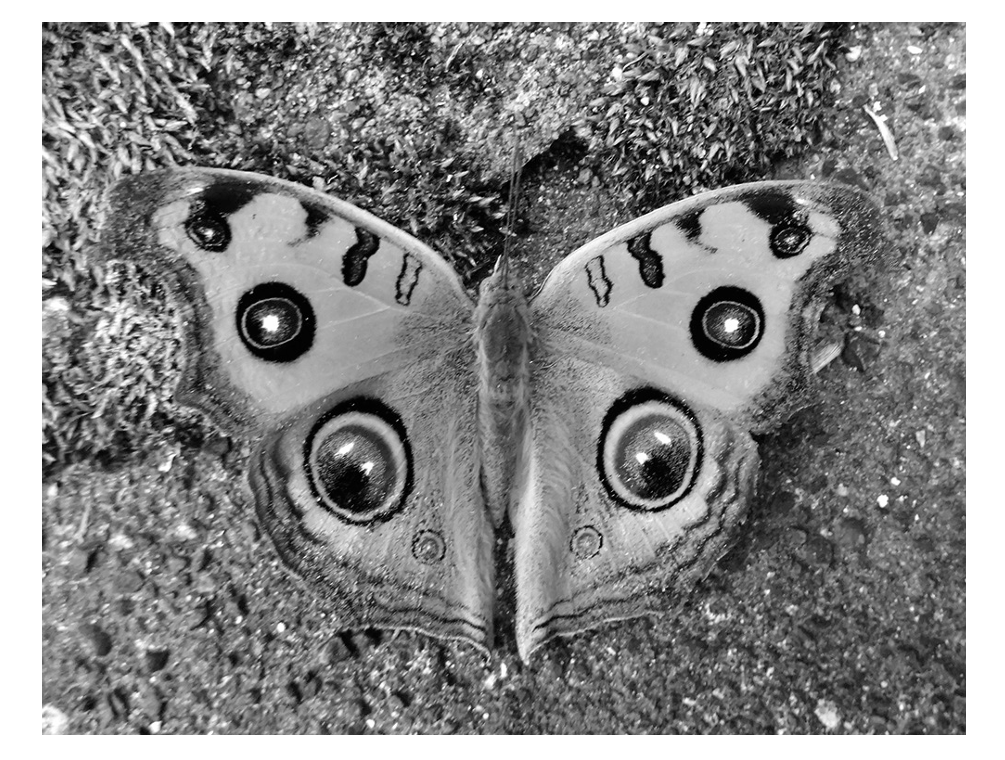
Explanation: The scientists likely used a systematic sampling method to ensure their sample was representative of the entire butterfly population. They might have divided the area into a grid using quadrats and randomly selected coordinates within this grid to sample from. At each selected location, they would count the number of butterflies present, carefully capturing them for examination.
To ensure reliability, they would repeat this process multiple times in different randomly selected areas and calculate means to account for natural variation. They would also need to sample at different times of day since butterfly activity varies. This method ensures the sample isn’t biased toward areas that are easier to access or more visible.
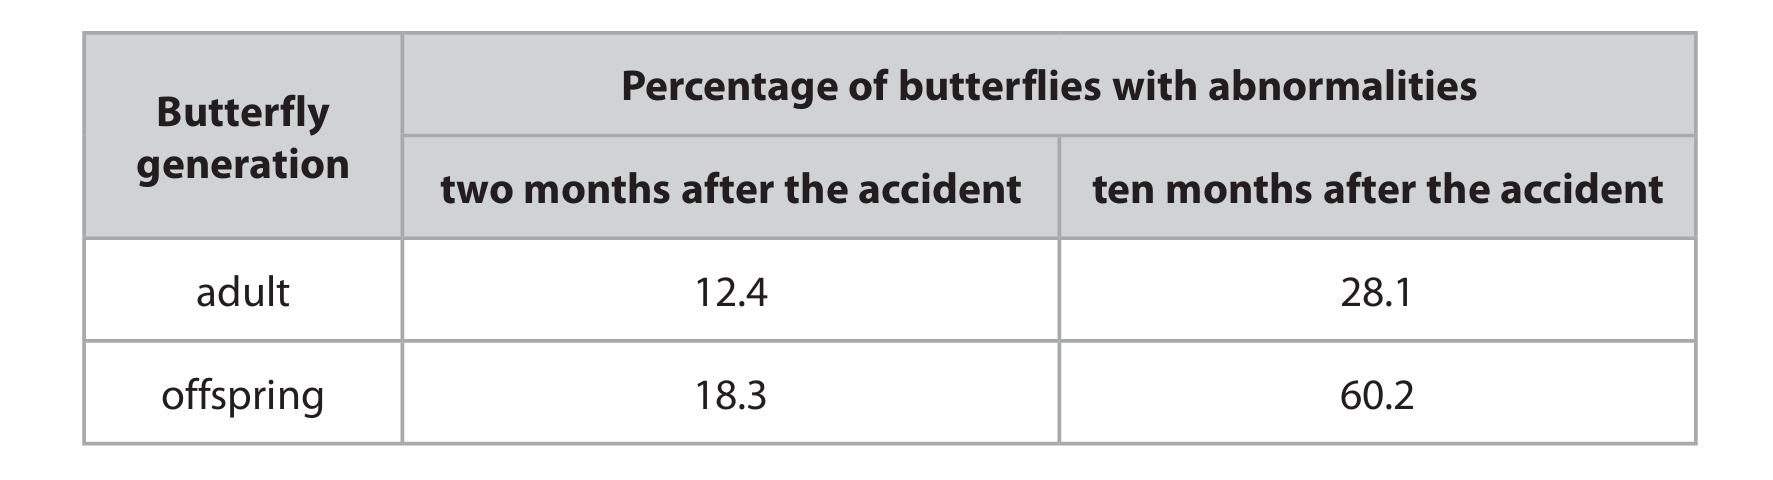
(d)(ii)
Explanation: The data provides compelling but not conclusive evidence supporting the scientists’ conclusion. Looking at the table, we see a clear increase in abnormalities over time: adult abnormalities rose from 12.4% to 28.1%, and offspring abnormalities increased dramatically from 18.3% to 60.2% between the two-month and ten-month samples.
The particularly large increase in offspring abnormalities (41.9% increase compared to 15.7% in adults) suggests mutations are being inherited. This makes sense because DNA mutations in reproductive cells can be passed to offspring. The longer exposure time (10 months vs 2 months) likely allowed more mutations to accumulate, explaining the higher abnormality rates.
However, there are limitations to this conclusion. We don’t have baseline data from before the accident or from uncontaminated areas for comparison. Other environmental factors like pesticides or diseases could also cause abnormalities. The sample size isn’t specified, and we don’t know if the radioactivity levels were consistent over time. While the data strongly suggests radioactive exposure caused genetic mutations, we cannot rule out other contributing factors without additional controlled experiments.
▶️ Answer/Explanation
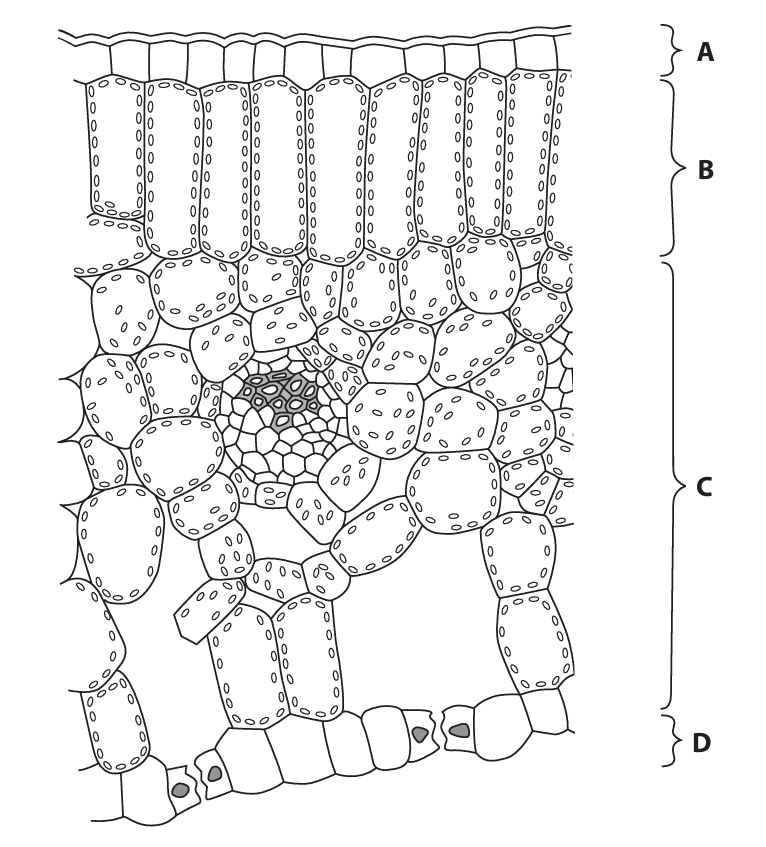
(a) (i) B
Explanation: The palisade mesophyll layer is typically found just below the upper epidermis in a leaf. It consists of tightly packed, columnar cells rich in chloroplasts, which are the main sites for photosynthesis. In a standard leaf cross-section diagram, this layer is labeled as B.
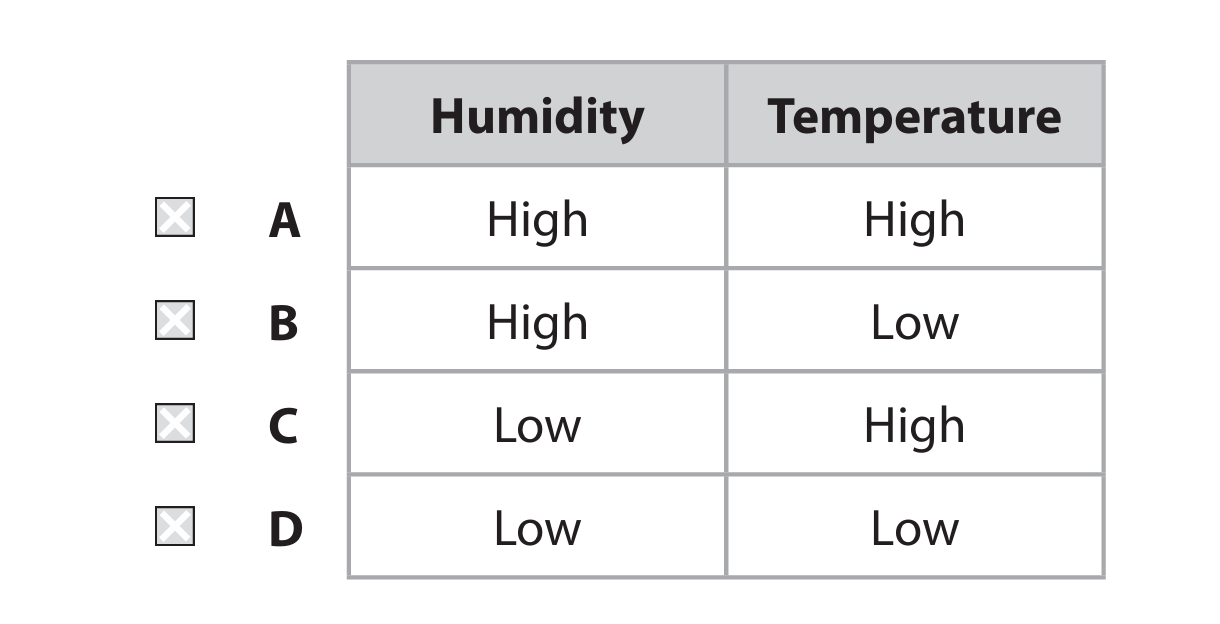
(a) (ii) Low humidity, High temperature
Explanation: Transpiration is the loss of water vapor from the leaves. Its rate is influenced by environmental factors. Low humidity creates a steeper concentration gradient for water vapor between the leaf’s interior and the outside air, favoring faster diffusion. High temperature increases the kinetic energy of water molecules, leading to more evaporation. Therefore, the combination of low humidity and high temperature provides the most favorable conditions for the fastest transpiration rate.
(b) (i) Concentration of carbon dioxide
Explanation: The independent variable is the factor that the scientist deliberately changes or manipulates in an experiment. Here, the scientists are growing plants in “different concentrations of carbon dioxide,” so that is the independent variable.
(b) (ii) Any two from: temperature, light, mineral ions/pH/soil, water/humidity
Explanation: Abiotic factors are the non-living chemical and physical parts of the environment. To ensure a fair test where only the independent variable (CO₂ concentration) affects the results, other abiotic factors that could influence plant growth or stomatal density must be kept constant. Examples include temperature, light intensity, water availability, humidity, and soil mineral content or pH.
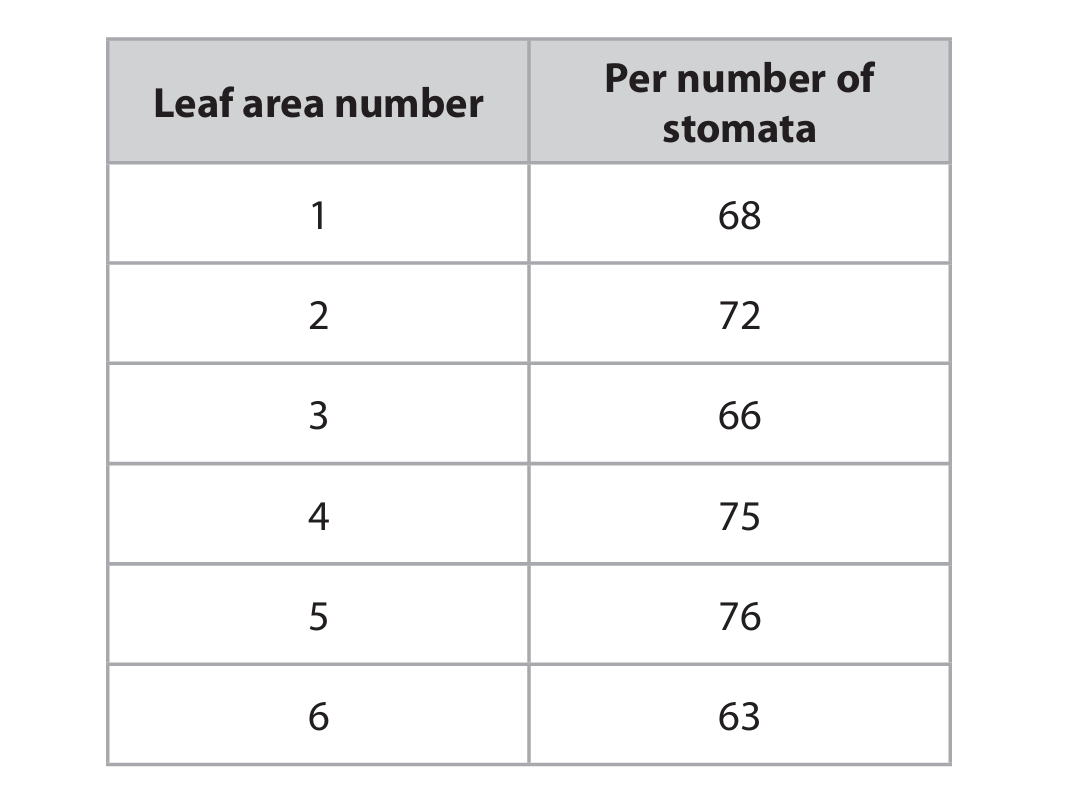
(b) (iii) 140 stomata per mm²
Explanation:
First, calculate the total number of stomata counted: 68 + 72 + 66 + 75 + 76 + 63 = 420.
Next, find the mean number of stomata per circular area: 420 ÷ 6 = 70.
Then, calculate the area of one circular sampling region using the formula \(\pi r^2\). The radius \(r\) is 0.40 mm.
Area = 3.14 × (0.40)² = 3.14 × 0.16 = 0.5024 mm².
Finally, calculate the mean density: Mean number of stomata per area = 70 ÷ 0.5024 ≈ 139.3.
Rounded to a sensible figure, this gives a mean density of approximately 140 stomata per mm².
(b) (iv) Discussion points include:
- Carbon dioxide is essential for photosynthesis.
- Fewer stomata may reduce the uptake of CO₂, potentially limiting photosynthesis.
- However, with increased external CO₂ concentration, the diffusion gradient is steeper, so fewer stomata might still allow sufficient CO₂ intake.
- A major advantage of fewer stomata is a significant reduction in water loss through transpiration.
- In hot, dry areas, conserving water is crucial to prevent wilting and maintain turgor.
- Reduced transpiration can also mean less transport of minerals from roots to shoots and less evaporative cooling of the leaf, which could be a disadvantage.
- The conclusion is generally supported as water conservation is often the limiting factor for survival in such environments, making the trade-off beneficial.
Explanation: The scientist’s conclusion links high CO₂, low stomatal density, and an advantage in hot, dry climates. The core of the discussion revolves around the trade-off between gas exchange (for photosynthesis) and water conservation. In high CO₂ conditions, the plant’s demand for stomatal openings for CO₂ intake might be lower because the driving force for diffusion is stronger. This allows the plant to afford having fewer stomata. The primary benefit of fewer stomata is a substantial reduction in transpirational water loss, which is a critical survival advantage in arid environments where water is scarce. While there might be minor drawbacks like reduced mineral transport or slightly lower photosynthetic rates, the overwhelming benefit of water conservation in a hot, dry habitat makes the scientist’s conclusion reasonable. The data from the investigation directly supports the first part of this chain by showing that high CO₂ leads to lower stomatal density.
▶️ Answer/Explanation
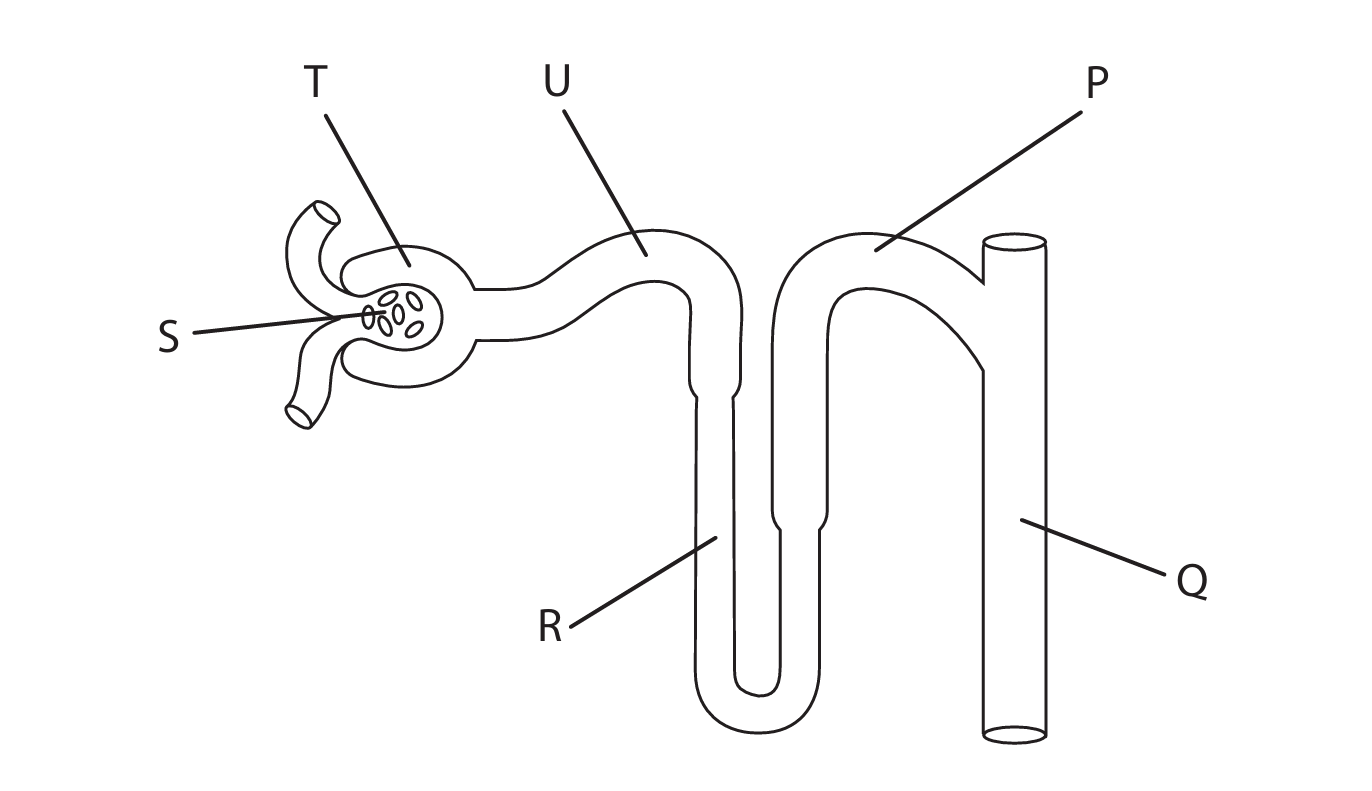
(a)(i) D S
Explanation: The structure labelled S is the glomerulus, which is a network of capillaries where ultrafiltration occurs. Blood pressure forces water, ions, and small molecules out of the blood and into the Bowman’s capsule, forming the filtrate.
(a)(ii) D U
Explanation: The structure labelled U is the proximal convoluted tubule (PCT). This is where the majority of glucose reabsorption takes place through active transport, returning this valuable nutrient to the bloodstream.
(a)(iii) B R
Explanation: The structure labelled R is the loop of Henle. This hairpin-shaped section of the nephron creates a concentration gradient in the kidney medulla, which is essential for water reabsorption and urine concentration.
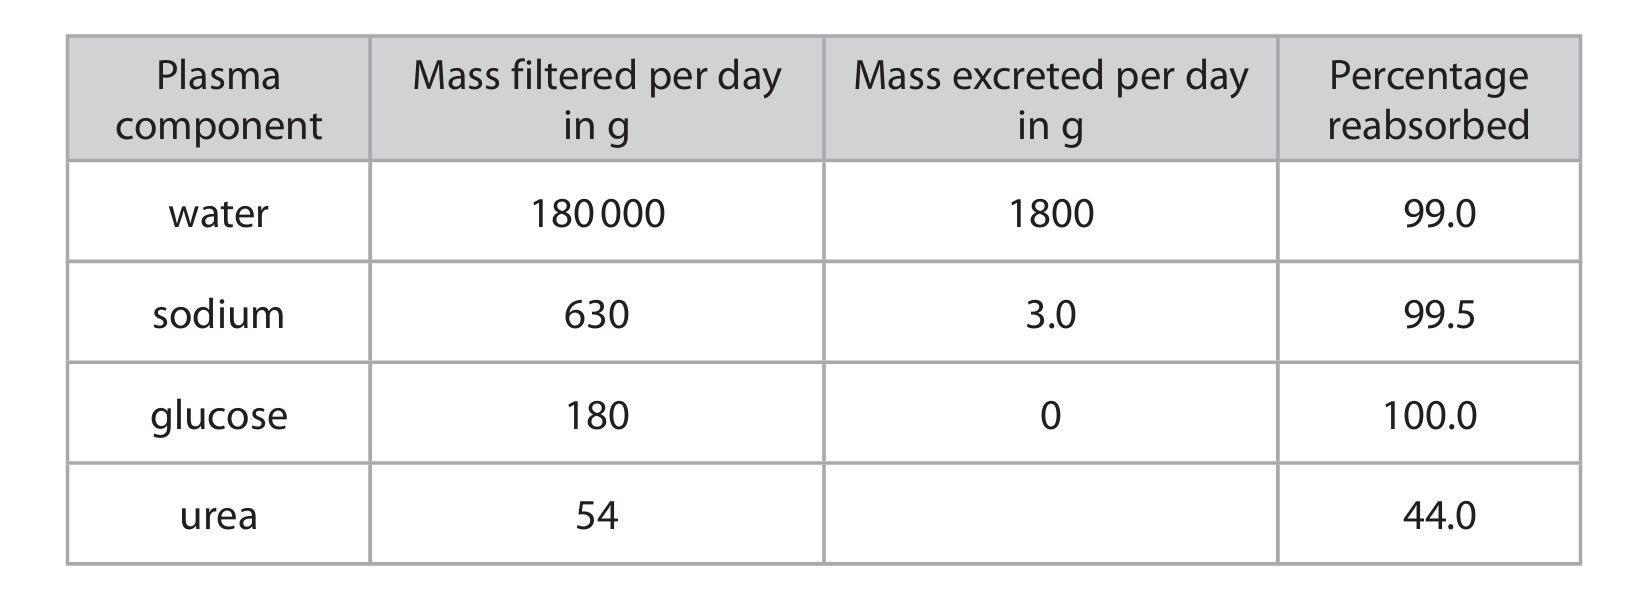
(b)(i) Substances/chemicals present in solution/dissolved/carried in the liquid part of the blood/plasma.
Explanation: Plasma components refer to the various dissolved substances found in blood plasma, which is the liquid matrix of blood. These include water, electrolytes (like sodium), nutrients (like glucose), waste products (like urea), hormones, and proteins.
(b)(ii) 30.24 g
Explanation: The calculation is based on the percentage reabsorbed. If 44% of urea is reabsorbed, then 56% is excreted. The mass excreted per day is therefore 56% of the mass filtered: \( \frac{56}{100} \times 54 = 30.24 \) g.
(b)(iii) To prevent glucose from being excreted/lost from the body and to maintain blood glucose levels for respiration/energy release.
Explanation: Glucose is a vital energy source for cells. The body carefully regulates blood glucose levels. Reabsorbing glucose in the nephron ensures that this important fuel is not wasted in urine and is kept in the bloodstream to be used for cellular respiration, which releases the energy needed for all bodily functions.
(b)(iv)
Explanation: A high-protein, high-salt meal with low water intake would have several effects. The breakdown of excess protein increases urea production, leading to a higher concentration of urea in the plasma and subsequently more urea being filtered and excreted. The high salt intake increases the sodium concentration in the blood, lowering its water potential. This is detected by osmoreceptors, which signal the pituitary gland to release more Anti-Diuretic Hormone (ADH). ADH makes the walls of the collecting duct more permeable to water. As a result, more water is reabsorbed back into the blood from the filtrate, producing a smaller volume of more concentrated urine to conserve water and excrete the excess salts and urea.

▶️ Answer/Explanation
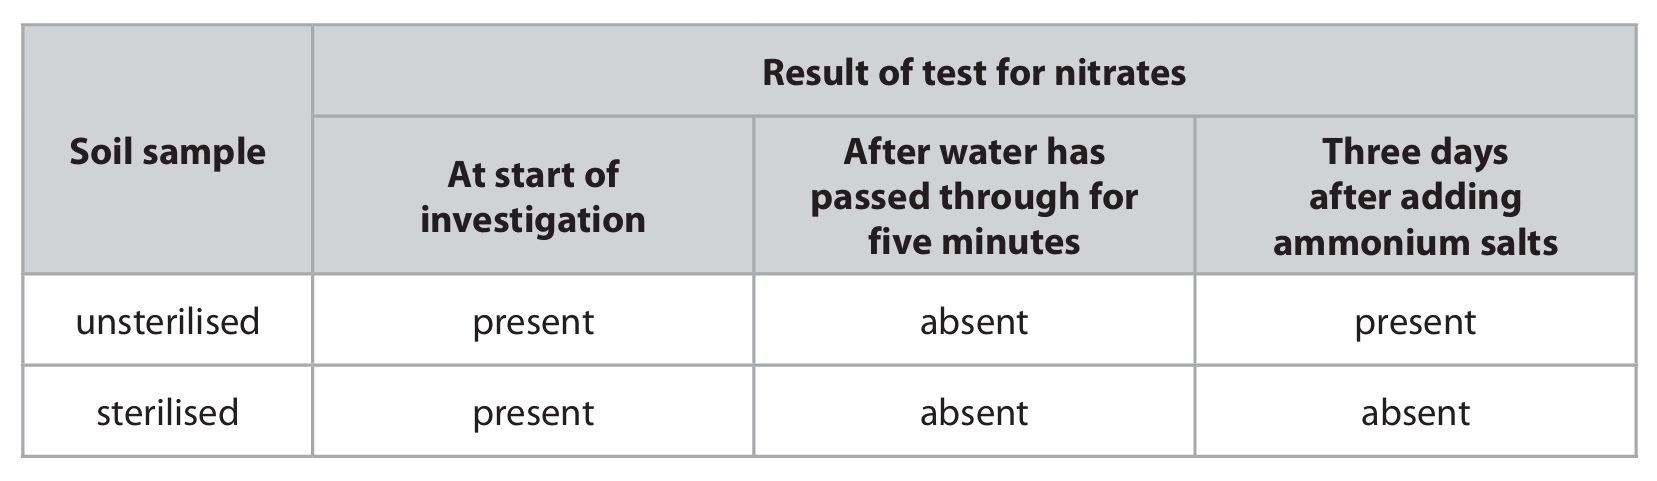
(a) Whether the soil sample was sterilised or unsterilised / The presence or absence of bacteria.
Explanation: The independent variable is the factor that the investigator deliberately changes. In this experiment, the student intentionally sterilized one soil sample (by heating it) while leaving the other unsterilized. This manipulation directly alters the presence of living microorganisms, particularly bacteria, in the soil, which is the key factor being tested for its effect on the nitrogen cycle (specifically, the conversion of ammonium to nitrate).
(b)(i) To remove or wash away any nitrates that were initially present in the soil. This ensures that any nitrate detected after adding the ammonium salts must have been produced from the ammonium during the investigation, making the test fair and valid.
Explanation: The initial tests showed that nitrate was present in both soil samples at the start. By thoroughly rinsing the soil with water for five minutes, the student aimed to leach out these pre-existing nitrates. This step is crucial for the validity of the experiment. If nitrates were not removed, it would be impossible to tell if nitrates found later came from the original soil or were newly produced from the added ammonium salts. This washing step creates a “clean slate,” ensuring that any nitrate detected after the ammonium addition is indeed a product of the processes being studied.
(b)(ii)
- Nitrates are present in the unsterilised soil but absent in the sterilised soil three days after adding ammonium salts.
- This shows that nitrates were produced in the unsterilised soil from the added ammonium salts.
- The conversion of ammonium to nitrate is called nitrification and is carried out by nitrifying bacteria.
- The sterilised soil, which was heated, had its bacteria killed, so no nitrification could occur, and thus no nitrates were produced.
Explanation: The contrasting results for the two soil samples three days after adding ammonium salts are very revealing. The unsterilised soil tested positive for nitrates, indicating that the ammonium ions \( (NH_4^+) \) were converted into nitrate ions \( (NO_3^-) \). This biological process, known as nitrification, is performed by specific types of bacteria called nitrifying bacteria (e.g., Nitrosomonas and Nitrobacter). In contrast, the sterilised soil, which was heated to 100°C, tested negative for nitrates. The heating process killed all living bacteria. The absence of nitrate production in this sample provides strong evidence that living bacteria are essential for the nitrification process to occur. The experiment effectively demonstrates the role of microorganisms in this crucial stage of the nitrogen cycle.
▶️ Answer/Explanation
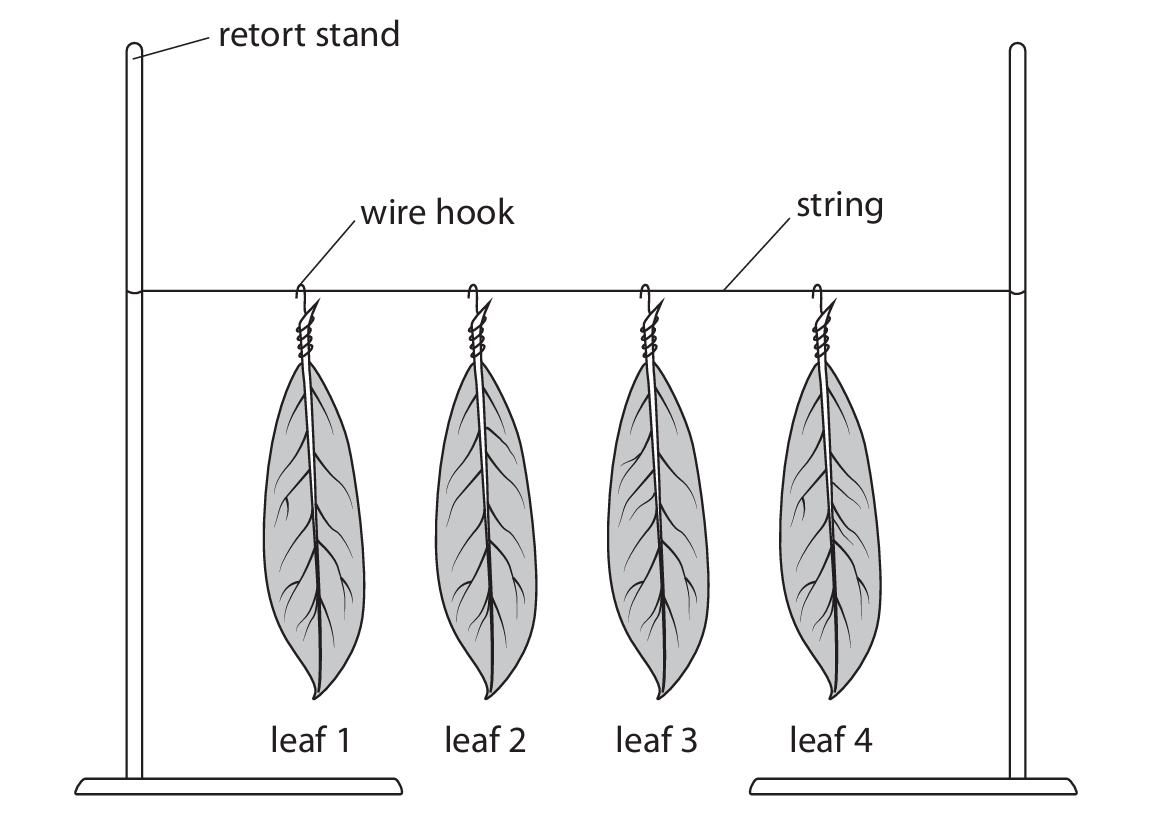
(a)(i) B (leaf surface covered)
Explanation: The independent variable is the factor deliberately changed. Here, the student varies which leaf surfaces are covered with petroleum jelly.
(a)(ii) To ensure a fair test / because different species may have different transpiration rates / different stomatal densities / eq.
Explanation: Using the same species controls for biological variation, ensuring observed differences are due to the treatment and not species-specific traits.
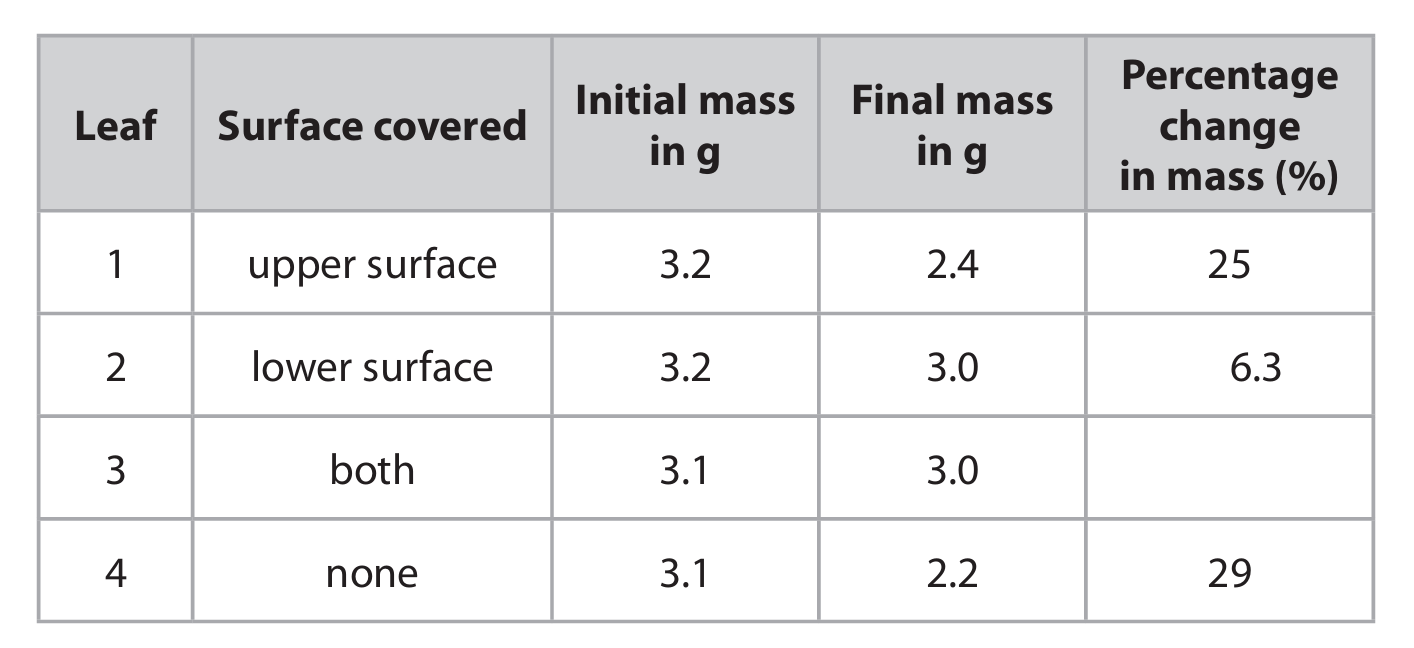
(b)(i) 3.2%
Explanation: Percentage change = [(Initial mass – Final mass) / Initial mass] × 100% = [(3.1 – 3.0) / 3.1] × 100% = 3.2258% ≈ 3.2%.
(b)(ii) An explanation linking water loss to stomatal location and the effect of petroleum jelly:
- Leaf 4 (uncovered) lost most water (29%) because stomata on both surfaces were open.
- Leaf 1 (upper covered) lost 25%, indicating many stomata are on the lower surface.
- Leaf 2 (lower covered) lost only 6.3%, showing most stomata are on the lower surface.
- Leaf 3 (both covered) lost least (3.2%) because petroleum jelly blocked almost all stomata.
This demonstrates that transpiration occurs mainly through stomata, which are more abundant on the lower leaf surface.
▶️ Answer/Explanation
(a)
Explanation:
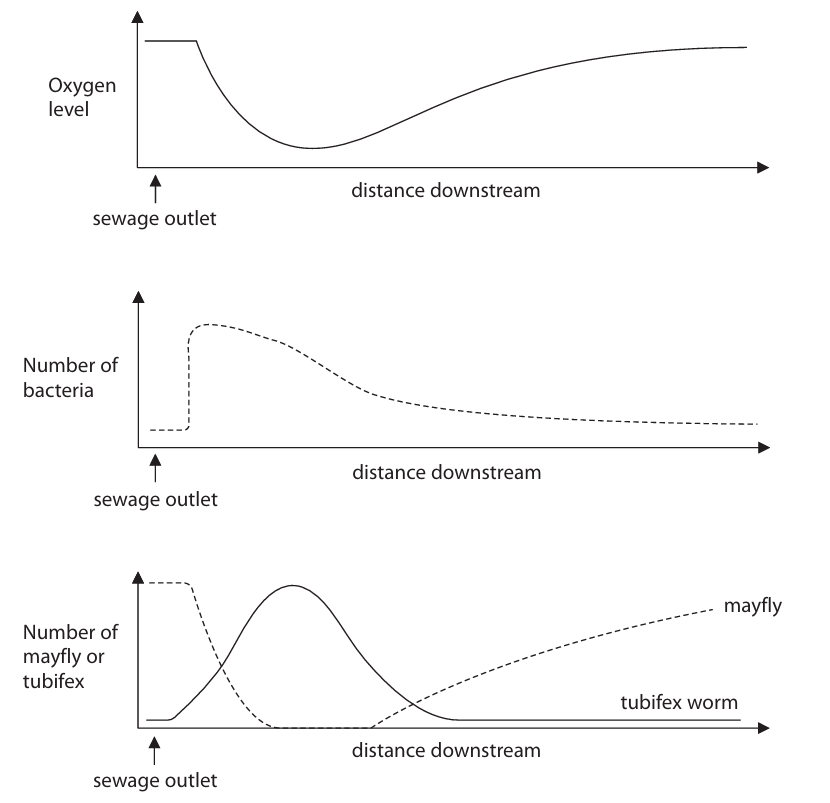
As the distance from the sewage outlet increases, several key changes occur in the river ecosystem, as shown by the graphs and understood through ecological principles.
Initially, right at the sewage outlet, the oxygen level in the water is low. This is because the sewage acts as a rich source of nutrients for bacteria. The bacterial population increases dramatically as they feed on this organic matter. These bacteria respire, consuming a large amount of the dissolved oxygen in the water, leading to oxygen depletion.
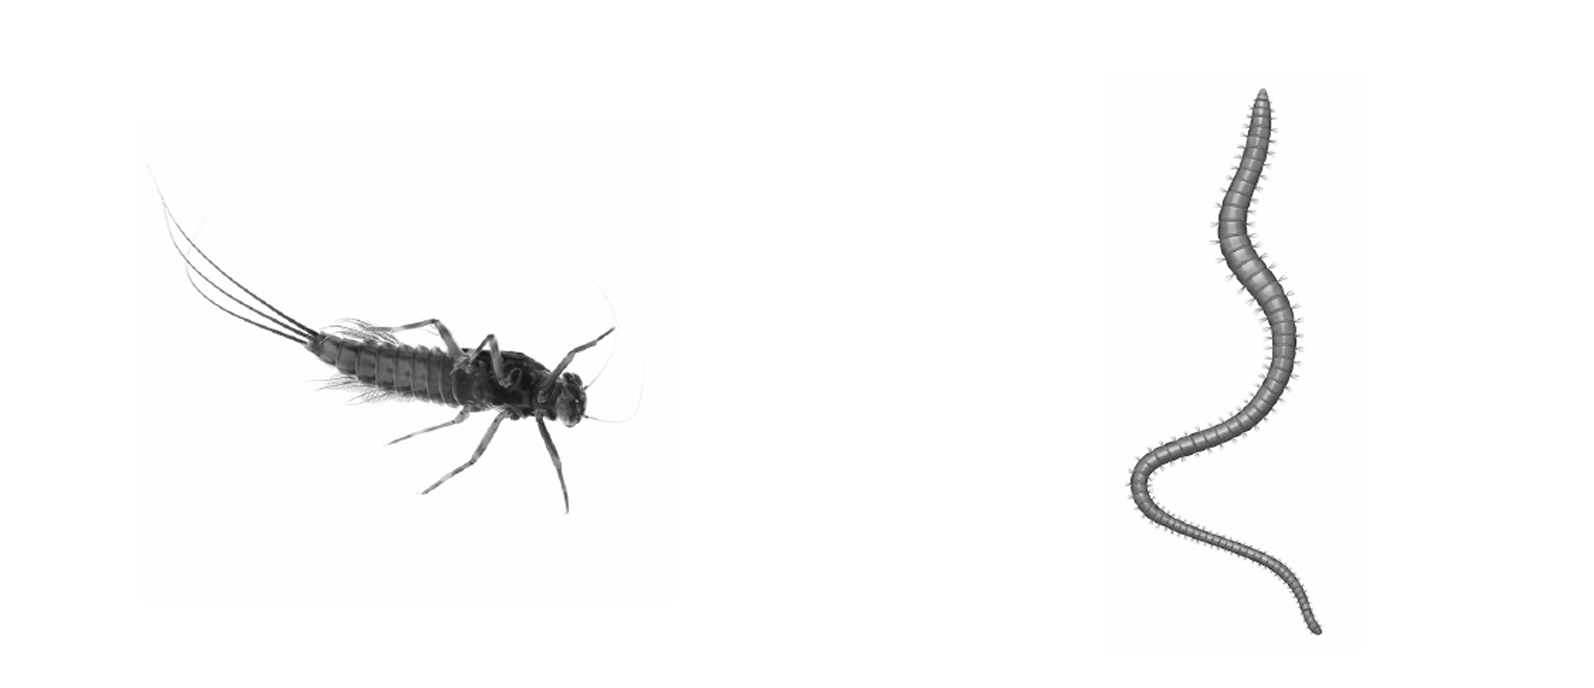
This low-oxygen environment has a direct impact on the larger organisms. Mayfly nymphs, which require high levels of dissolved oxygen to survive, cannot tolerate these conditions. Consequently, their numbers drop to zero near the outlet.
In contrast, tubifex worms are more tolerant of polluted conditions and can survive in water with very low oxygen levels. They thrive by feeding directly on the sewage and the bacteria, so their numbers are high near the outlet.
Further downstream, the concentration of sewage nutrients becomes diluted. With less food available, the bacterial population begins to decrease. As bacterial respiration reduces, the consumption of oxygen decreases, allowing the oxygen levels in the water to gradually recover.
As the oxygen levels return to normal, the habitat becomes suitable again for mayfly nymphs, and their numbers start to increase. Conversely, the conditions become less ideal for tubifex worms, and their numbers begin to decline as the pollution level decreases.
(b)(i)
Explanation:
Biodiversity refers to the variety of life found in a particular ecosystem or habitat. It encompasses two main concepts. First, it refers to the number of different species present (species richness). Second, it considers the relative abundance of individuals within each of those species (species evenness). A habitat with high biodiversity has many different species, each with a healthy population size, indicating a stable and healthy ecosystem.
(b)(ii)
Explanation:
Mayfly nymphs and tubifex worms have different tolerances to pollution, making them excellent bio-indicators.
Mayfly nymphs are very sensitive to pollution and low oxygen levels. Therefore, a high number of mayfly nymphs indicates clean, well-oxygenated, and unpolluted water. If mayfly nymphs are absent or present in very low numbers, it is a strong indicator that the water is polluted.
Tubifex worms, on the other hand, are very tolerant of pollution and can survive in low-oxygen conditions that would kill other organisms. A high number of tubifex worms suggests that the water is polluted and oxygen-depleted. In clean water, their numbers would be very low or zero.
By surveying the relative populations of these two organisms, scientists can get a quick and reliable indication of the pollution level in a river. The presence of mayflies and absence of tubifex worms points to clean water, while the opposite indicates pollution.
▶️ Answer/Explanation
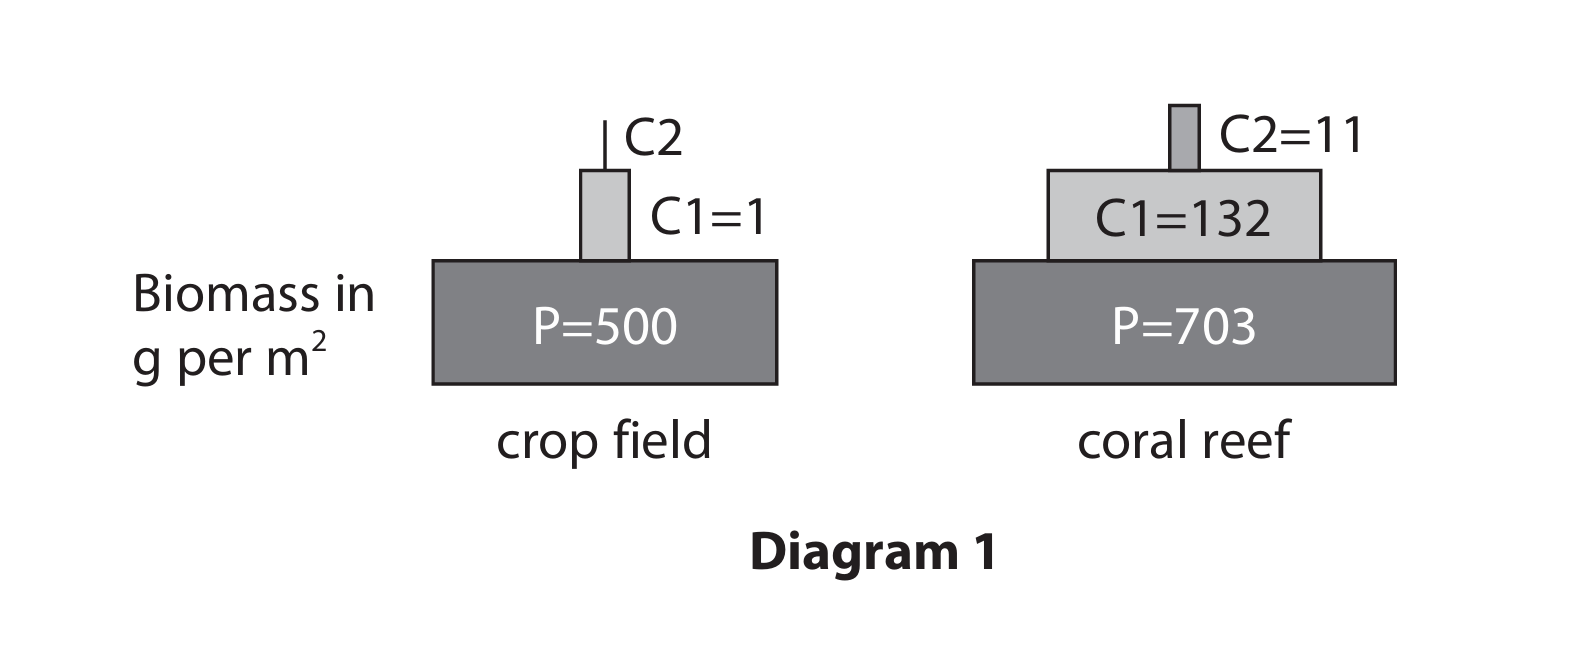
(a)(i) 18.8% (or approximately 19%)
Explanation: The efficiency of biomass transfer from producers (P) to primary consumers (C1) is calculated using the formula:
\[ \text{Efficiency} = \frac{\text{Biomass at C1}}{\text{Biomass at P}} \times 100\% \]
For the coral reef: P = 703 g/m², C1 = 132 g/m².
\[ \text{Efficiency} = \frac{132}{703} \times 100\% \approx 18.8\% \]
This means about 18.8% of the biomass produced by the coral reef’s producers is transferred to the primary consumers.
(a)(ii) 0.01 g per m²
Explanation: The efficiency from primary consumers (C1) to secondary consumers (C2) is given as 1%. For the crop field, C1 biomass is 1 g/m².
\[ \text{C2 Biomass} = 1\% \text{ of } 1 = 0.01 \times 1 = 0.01 \text{ g/m²} \]
So, the biomass of the secondary consumers is only 0.01 grams per square meter.
(a)(iii) The biomass transfer is more efficient in the coral reef because more of the producer biomass is consumed, and there is less energy loss due to factors like heat or movement in the aquatic environment.
Explanation: In aquatic ecosystems like coral reefs, organisms often have lower energy requirements for support and movement compared to terrestrial ecosystems. Additionally, a larger proportion of the primary producers (like algae and phytoplankton) are typically consumed by herbivores, leading to a more efficient transfer of biomass up the food chain.
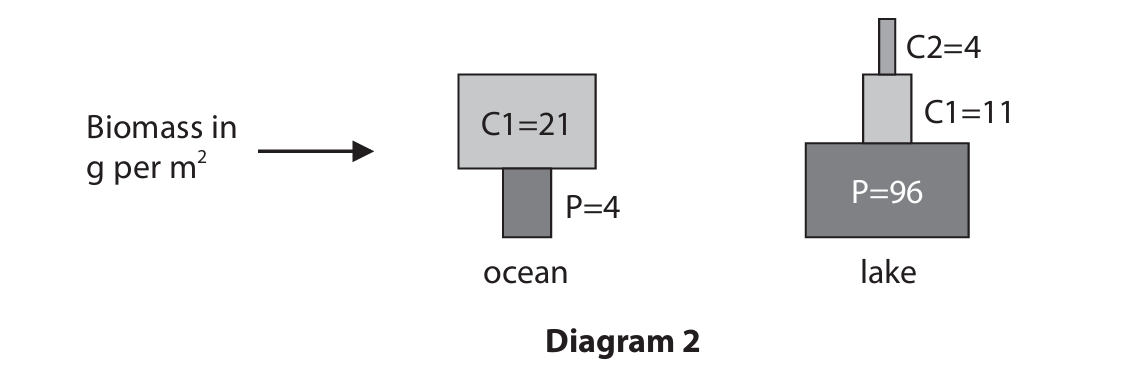
(b) The pyramid of biomass for the ocean is inverted because the producers (phytoplankton) have a very high reproduction rate and are consumed rapidly, so their standing biomass at any one time is low, while the consumers (zooplankton and fish) accumulate more biomass over time.
Explanation: In the ocean, the base of the food chain consists of phytoplankton. These tiny organisms reproduce extremely quickly and are eaten almost as fast as they are produced. This means that although they have a high turnover rate (produce a lot of biomass over time), their actual biomass present at any single moment (standing crop) is low. The consumers that feed on them, like zooplankton and small fish, may have a larger total biomass because they live longer and are not consumed as rapidly. This results in an inverted pyramid of biomass, where the higher trophic levels appear to have more biomass than the producers below them.
(c) Scientists could estimate the energy by sampling the producers using quadrats, collecting the plant material, and then burning it in a calorimeter to measure the heat energy released.
Explanation: To estimate the energy content of the producers in a specific area like 1 m² of a crop field, scientists would first need to collect a representative sample of the plants. They might use a quadrat to randomly select several 1 m² areas within the field. All the plant material (producers) from within these quadrats would be harvested, dried to remove water content (as water doesn’t contain usable energy), and then weighed to get the dry biomass. This dry plant material would then be burned in a device called a bomb calorimeter. The calorimeter measures the heat released when the plant material is completely combusted. This heat energy, measured in joules or calories, gives a direct estimate of the chemical energy stored in the producers’ tissues for that square meter of land.
▶️ Answer/Explanation
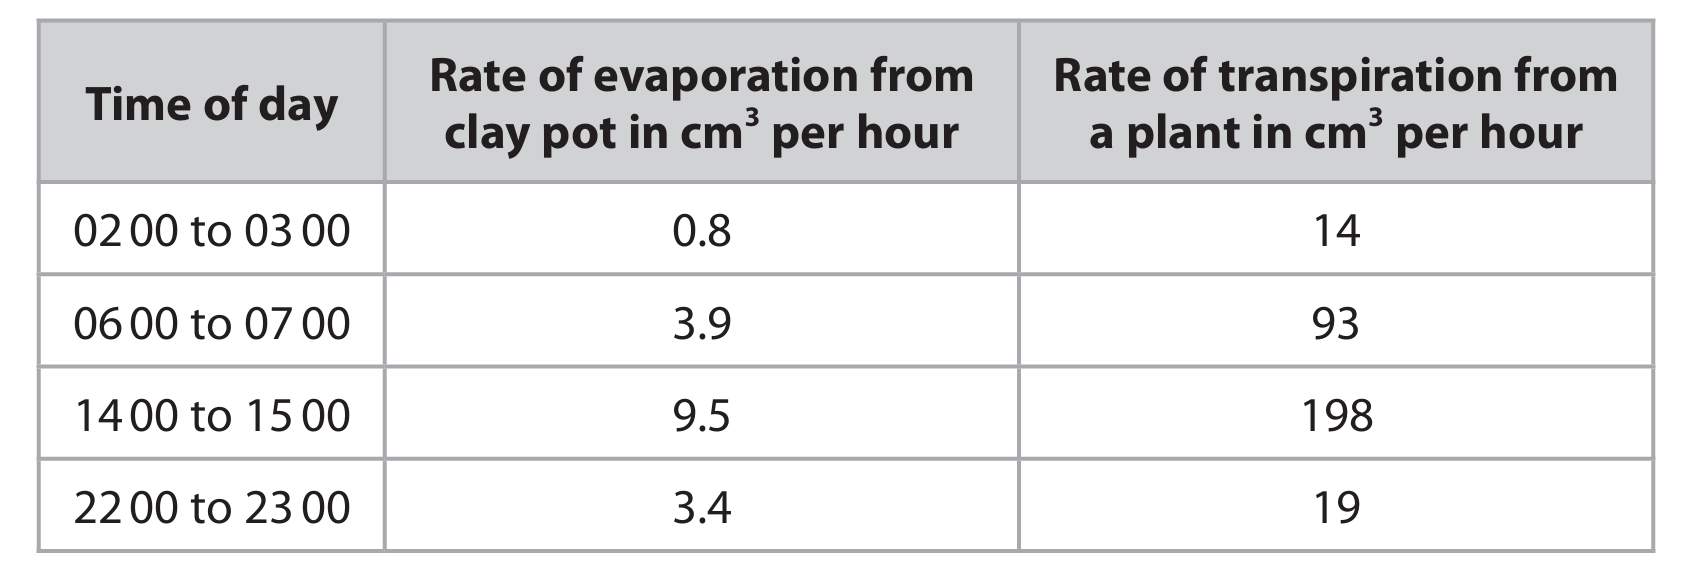
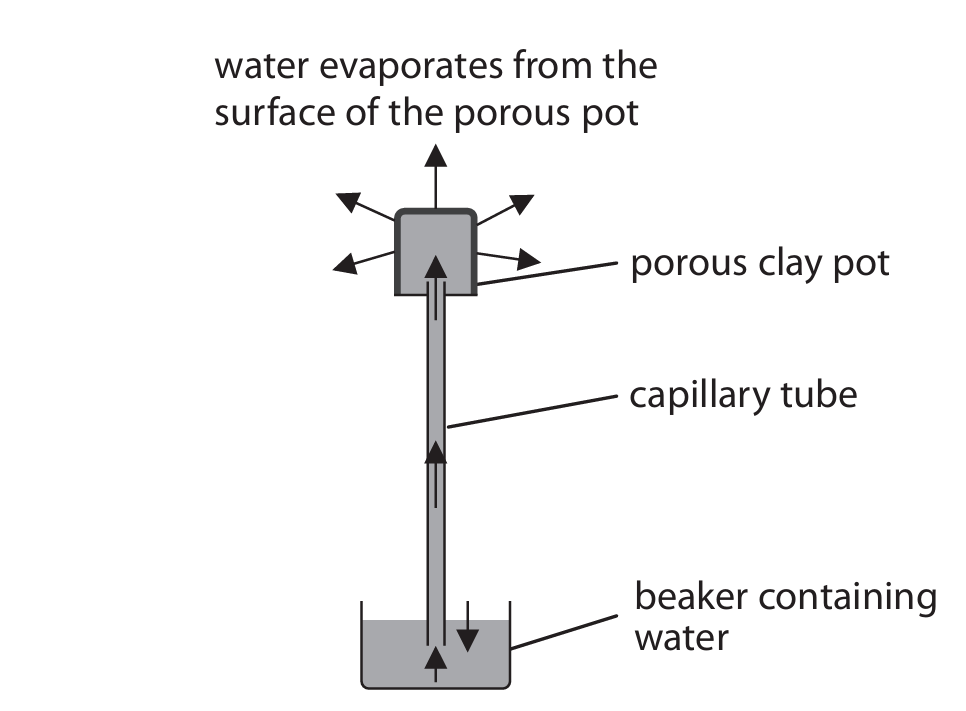
(a)(i) The rate of evaporation increases when the temperature is higher and decreases when the temperature is lower. This is because higher temperatures give water molecules more kinetic energy, allowing them to escape from the liquid surface more easily and become water vapor.
Explanation: Looking at the data, the evaporation rate is lowest at night (0.8 cm³/h at 02:00-03:00) and highest in the afternoon (9.5 cm³/h at 14:00-15:00). This pattern follows the typical daily temperature cycle, where temperatures are coolest at night and warmest in the afternoon. The increased kinetic energy of water molecules at higher temperatures enables more molecules to overcome surface tension and evaporate.
(a)(ii) The student could measure the rate by: 1. Using a scale on the beaker or capillary tube to measure the volume of water lost or the distance moved by a bubble 2. Using a clock to measure the time period 3. Dividing the volume change or distance by the time to get the rate in cm³ per hour
Explanation: To measure evaporation rate quantitatively, the student would need to track how much water is lost over a specific time period. They could mark the starting water level in the beaker or capillary tube, then after a measured time interval (say one hour), check how much the water level has dropped. Alternatively, if using a bubble in the capillary tube, they could measure how far the bubble moves in a given time. The rate is then calculated as volume lost (or distance moved) divided by time.
(b)(i) Light intensity affects transpiration but not evaporation from the clay pot. Light causes stomata to open in plants, allowing more water vapor to escape, whereas the clay pot has no biological structures that respond to light.
Explanation: Plants have specialized cells called guard cells that control the opening and closing of stomata. In bright light, these cells swell with water, causing the stomata to open wider and increasing transpiration rate. The clay pot, being an inanimate object, has no such regulatory mechanism – its evaporation rate depends solely on physical factors like temperature, humidity, and air movement.
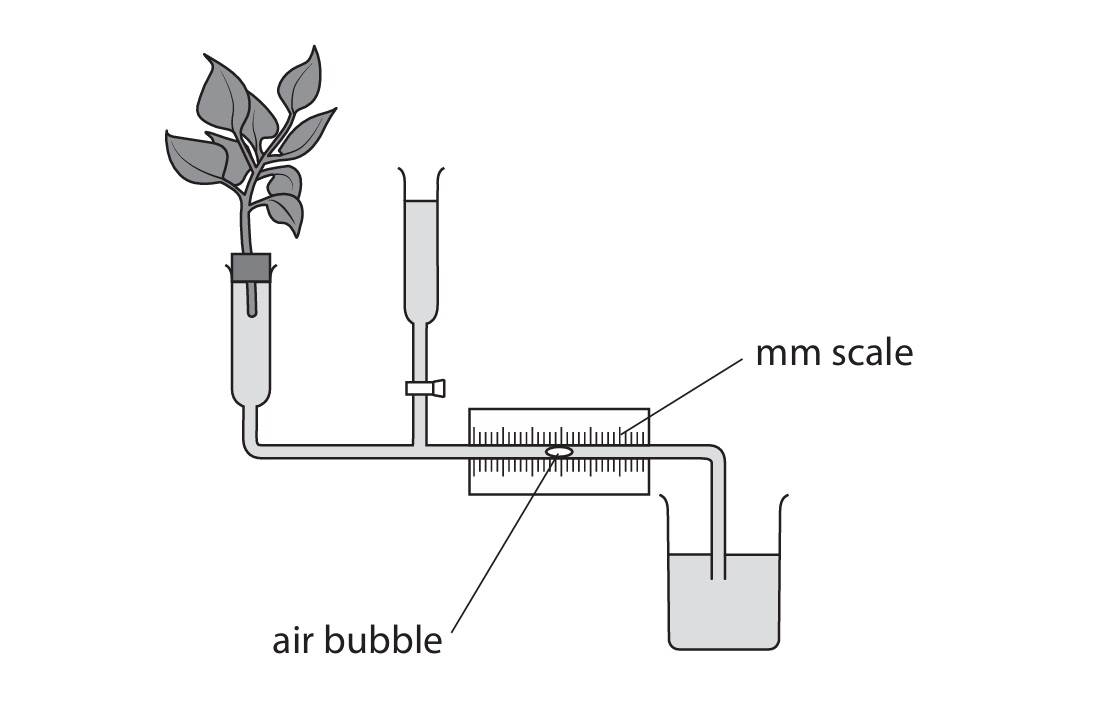
(b)(ii) The student could use a potometer. A labeled diagram should include: – A plant with its stem inserted through a seal (cork or bung) – A capillary tube with a scale/ruler – A bubble or meniscus in the capillary tube – A water reservoir
Explanation: A potometer measures water uptake by plants, which closely correlates with transpiration rate. The apparatus consists of a plant stem securely sealed into a system containing a capillary tube. As the plant transpires, it draws water through the capillary tube, and the movement of a bubble or meniscus along the scaled tube can be timed to calculate the rate of water uptake. The seal prevents water loss from anywhere except through the plant’s leaves, ensuring accurate measurement of transpiration.

▶️ Answer/Explanation
(a) Population
Explanation: The term “population” refers specifically to the total number of individuals of a single species living in a particular habitat at a specific time. It is a fundamental concept in ecology used to measure the size of a species group within an ecosystem.
(b)(i)
The completed table is as follows:
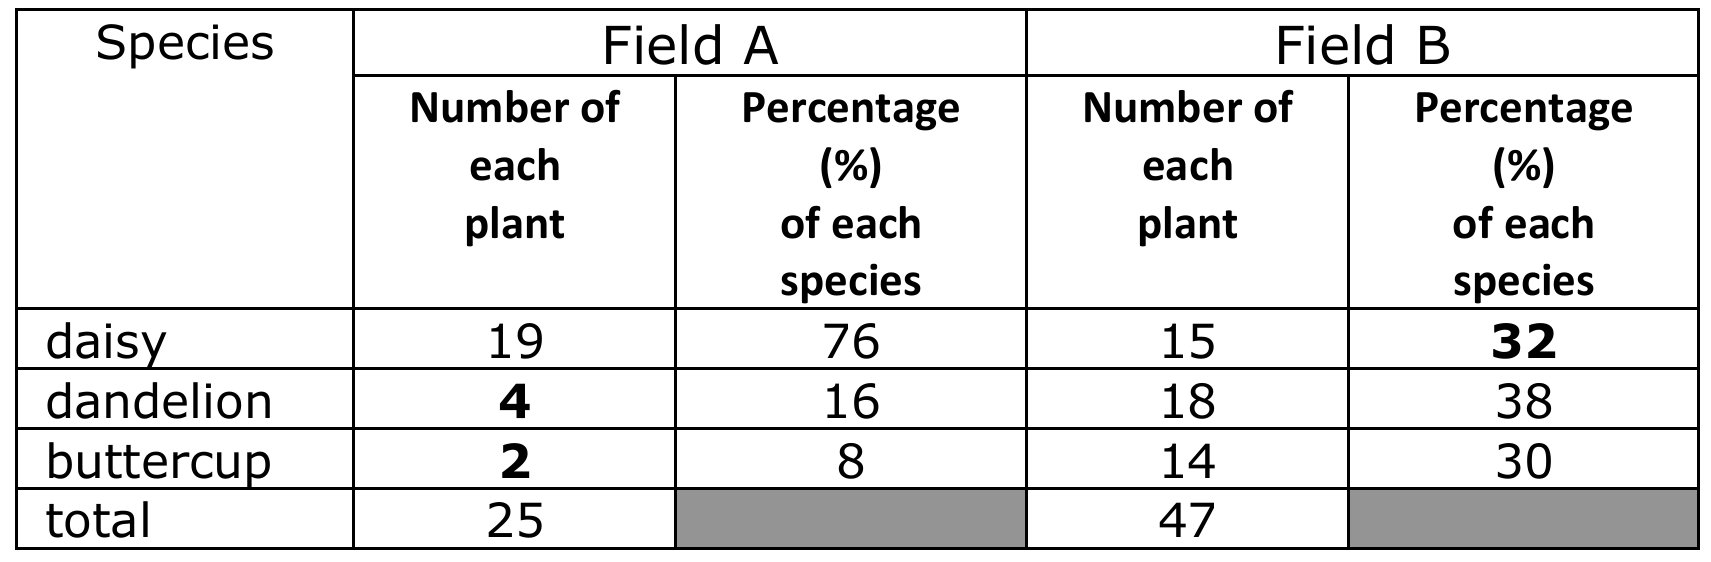
Explanation: For Field A, the number of dandelions is calculated as 16% of 25, which is 4 plants. The number of buttercups is 8% of 25, which is 2 plants. For Field B, the percentage for daisies is calculated as (15 / 47) × 100, which is approximately 32%.
(b)(ii) Field B has the greater biodiversity.
Explanation: Although both fields contain the same three species, biodiversity is not just about the number of different species (species richness) but also about how evenly the individuals are distributed among those species (species evenness). Field B has a more balanced distribution of individuals across the three species (32%, 38%, 30%) compared to Field A, which is heavily dominated by daisies (76%). A more even distribution indicates a healthier, more stable ecosystem with greater biodiversity.
(c) A shortage of nitrates could affect plant size.
Explanation: Nitrates are essential minerals absorbed by plant roots from the soil. They are a key component needed for the synthesis of amino acids, which are the building blocks of proteins. Proteins are crucial for many plant growth processes, including cell division and enlargement. A shortage of nitrates would limit protein production, thereby stunting plant growth and resulting in smaller plants with potentially yellowed leaves due to reduced chlorophyll production.
▶️ Answer/Explanation
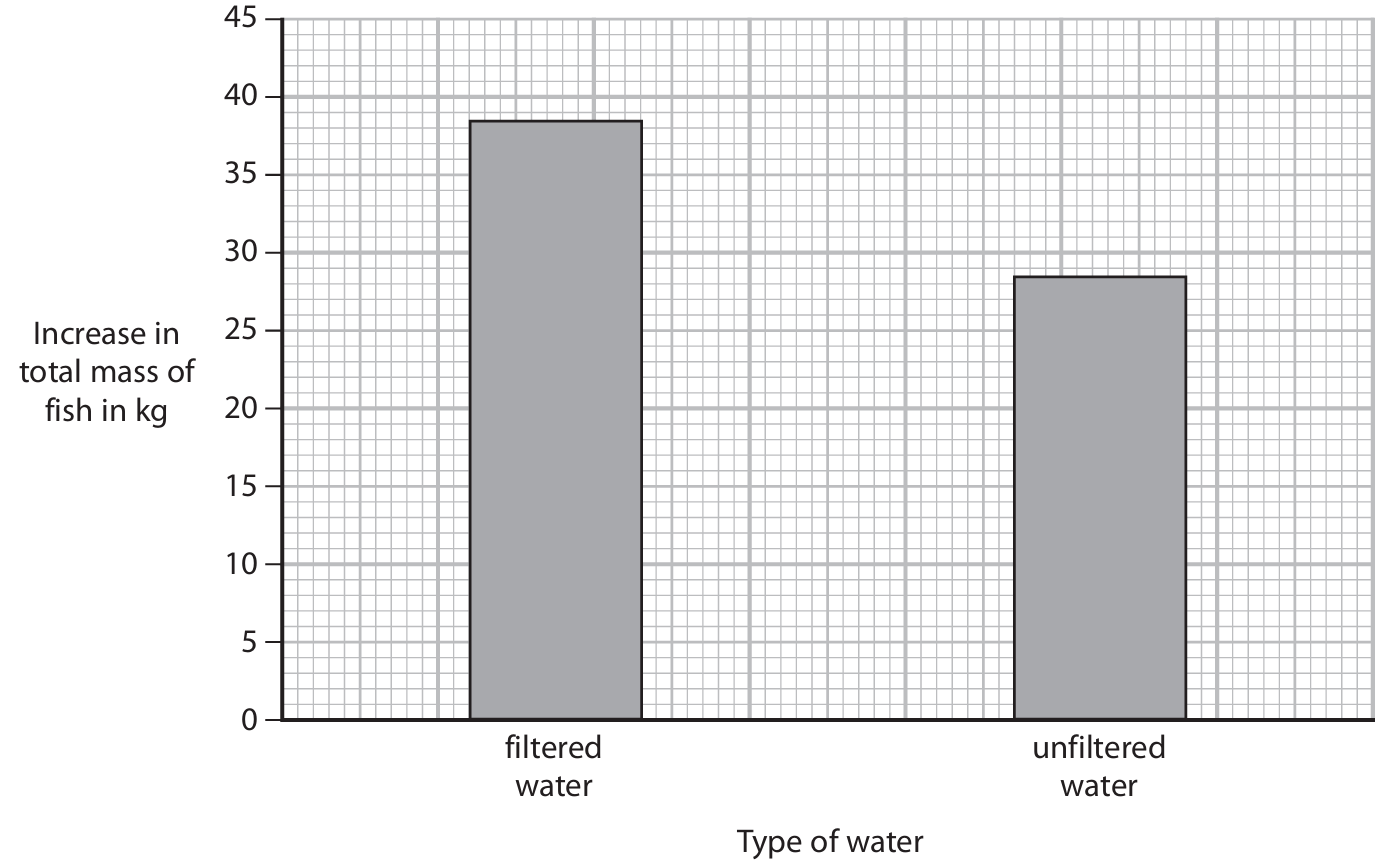
(a) 0.056 kg per day
Explanation:
First, we need to find the mean rate of increase for the fish in the unfiltered water. From the graph, the total increase in mass for unfiltered water is 28.5 kg over 180 days.
Mean rate for unfiltered water = Total mass increase / Number of days = 28.5 kg / 180 days = 0.1583 kg/day (approximately 0.158 kg/day).
The mean rate for filtered water is given as 0.214 kg/day.
Difference = Mean rate (filtered) – Mean rate (unfiltered) = 0.214 kg/day – 0.158 kg/day = 0.056 kg/day.
So, the difference in the mean rate of increase is 0.056 kg per day.
(b)
Explanation:
Unfiltered water, containing more bacteria, can negatively impact fish growth in several ways. Firstly, bacteria are living organisms that respire. An increase in bacterial population leads to higher rates of respiration in the water, which consumes more dissolved oxygen. This results in less oxygen being available for the fish.
Secondly, with less oxygen available, the fish cannot respire as effectively. Respiration provides energy for all life processes, including growth. Reduced respiration means less energy is available for growth, leading to a smaller increase in mass.
Finally, some bacteria can be pathogenic (disease-causing). A higher bacterial load increases the risk of the fish contracting diseases, which can damage tissues like the gills (impairing gas exchange) and divert energy away from growth towards fighting infection.
(c) Species / type of fish OR Mass of fish (at the start)
Explanation:
A biotic variable is a living factor. The scientist controlled biotic variables by using the same species of fish and placing the same mass of fish in each pond at the beginning of the investigation. This ensures that any difference in growth is due to the water quality (the independent variable) and not because of differences in the type or initial size of the fish used.
(d) Use a net / cage OR Shoot predators OR Make noise
Explanation:
Interspecific predation is when one species (a predator) hunts and eats another species (the prey). In this case, predators from other species might eat the fish in the ponds. To control this, the scientist could physically separate the fish from potential predators by placing them inside a protective net or cage within the pond. Alternatively, more direct methods like shooting predators or using deterrents like making noise to scare them away could be employed to prevent them from preying on the fish.
▶️ Answer/Explanation
(a)(i) The root hair cell has a long, thin extension (root hair) that increases its surface area, allowing for more efficient absorption of water from the soil.
Explanation: Root hair cells are specialized for absorption. Their elongated, hair-like projections significantly increase the surface area in contact with the soil water. This larger surface area maximizes the rate at which water can be absorbed via osmosis.
(a)(ii) Osmosis specifically involves the movement of water molecules, while diffusion can involve the movement of any type of molecule or ion.
Explanation: The key distinction is the substance being moved. Osmosis is a special case of diffusion that is exclusively concerned with the passive movement of water molecules across a partially permeable membrane from a region of higher water potential to a region of lower water potential. Diffusion, on the other hand, refers to the net movement of any particles (like oxygen, carbon dioxide, or ions) from a region of higher concentration to a region of lower concentration, and it may or may not involve a membrane.
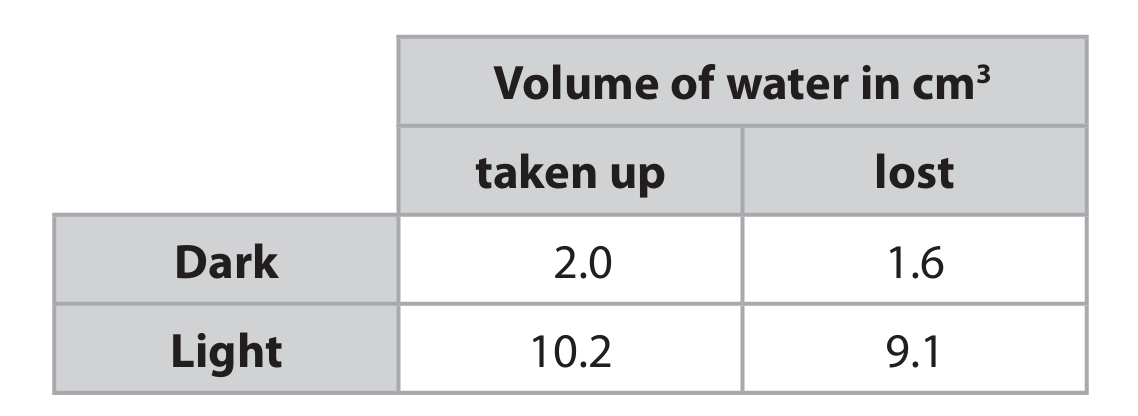
(b)(i) In the light, both water uptake and water loss are much greater than in the dark. More water is taken up than is lost in both conditions.
Explanation: In the light, the plant’s stomata are open to allow gas exchange for photosynthesis. This opening also increases the rate of transpiration (water loss) from the leaves. The loss of water by transpiration creates a transpiration pull, which draws more water up through the xylem from the roots, leading to the higher uptake. The small difference between uptake and loss (e.g., 10.2 – 9.1 = 1.1 cm³ in light) represents water used for processes like photosynthesis and maintaining cell turgor. In the dark, stomata are mostly closed, drastically reducing both transpiration and, consequently, water uptake.
(b)(ii) 1. Temperature
2. Humidity
Explanation: To ensure a fair test and that the results are solely due to the change in light intensity, other abiotic (non-living) factors that affect transpiration and water uptake must be kept constant. Temperature influences the rate of evaporation. Humidity affects the concentration gradient for water vapor loss; lower humidity increases transpiration. Other valid answers include air movement (wind) and the time allowed for the experiment.
(c)(i) Potometer
Explanation: The apparatus shown in the diagram, designed to measure the rate of water uptake by a plant shoot, is called a potometer. It is important to note that it actually measures the rate of water uptake, which is assumed to be closely related to the rate of transpiration.
(c)(ii) The student should introduce an air bubble into the capillary tube and use the stop clock to measure the time taken for the bubble to move a certain distance along the scale. The distance moved is converted to a volume using the known cross-sectional area of the tube. The rate is calculated as volume divided by time, and the experiment is repeated to find a mean rate.
Detailed Description:
1. Set up the potometer with the plant shoot underwater to ensure no air enters the system.
2. Introduce a single air bubble into the capillary tube.
3. Start the stop clock as the bubble passes a starting point on the scale.
4. Stop the stop clock when the bubble passes a finishing point, and record the time taken.
5. Measure the distance the bubble traveled along the scale.
6. Since the capillary tube has a uniform diameter, the volume of water taken up is equal to the distance moved multiplied by the cross-sectional area of the tube (volume = πr² × distance, where r is the radius).
7. Calculate the rate of water uptake for that single run using: Rate = Volume / Time.
8. Reset the bubble using the reservoir (if available) and repeat the process several times.
9. Calculate the mean (average) rate of water uptake from all the repeat readings to improve reliability.
▶️ Answer/Explanation
(a) To obtain random samples, the students should first set up a coordinate system for the field. This can be done by placing two long tape measures at right angles along two edges of the field, creating an X and Y axis. Then, they should use a random number generator (like from a calculator, computer, or random number tables) to generate pairs of coordinates. Each pair of coordinates (X, Y) specifies the precise location where the quadrat should be placed for sampling. This method ensures that every part of the field has an equal chance of being sampled, preventing bias.
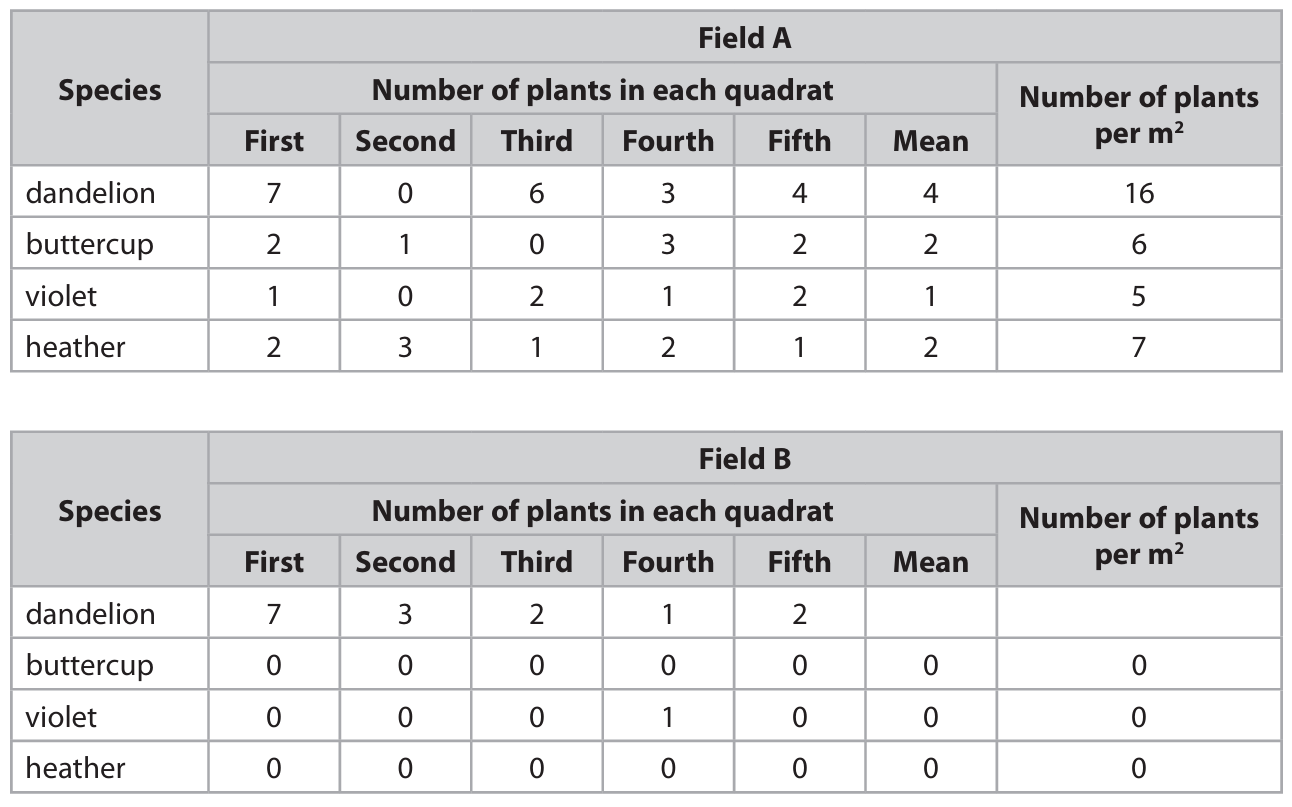
(b)(i) The mean number of dandelions per quadrat in field B is calculated by adding up the number of dandelions from all five quadrats and dividing by the number of quadrats (5).
Calculation: \( (7 + 3 + 2 + 1 + 2) \div 5 = 15 \div 5 = 3 \)
Mean number = 3
(b)(ii) To find the number of dandelions per square meter, we first need the area of one quadrat. The quadrat is 0.5 m by 0.5 m, so its area is \( 0.5 \times 0.5 = 0.25 \, \text{m}^2 \). If there is a mean of 3 dandelions per \( 0.25 \, \text{m}^2 \), then in one full square meter, there would be \( 3 \times 4 = 12 \) dandelions.
Calculation: \( 3 \, \text{dandelions} \div 0.25 \, \text{m}^2 = 12 \, \text{dandelions/m}^2 \)
Number of dandelions per m² = 12
(c) There are significant differences in species distribution between the two fields. Field A has a much higher biodiversity; it contains all four species surveyed (dandelion, buttercup, violet, and heather), whereas Field B only has dandelions and a single violet. Field A also has a much higher total number of plants and a more even distribution of individuals across the different species. In contrast, Field B is dominated almost entirely by dandelions, indicating lower species richness and lower species evenness.
(d) To investigate the link between poor water drainage and the absence of buttercups, the students could design an experiment focusing on soil water content. One effective method would be to use a soil moisture probe or take soil samples, dry them in an oven, and calculate the percentage water content. They should take multiple, repeated measurements at random locations or along a transect line across both fields. By comparing the average soil water content in Field B (where buttercups are absent) to that in Field A (where they are present), they can see if there is a correlation between high soil moisture and the lack of buttercups. To make it a more controlled experiment, they could also plant buttercup seeds in pots with soil that has good drainage and in pots with soil that has poor drainage, ensuring all other conditions like light, temperature, and mineral content are kept the same, and then monitor the growth and survival of the buttercups in each set of conditions.
▶️ Answer/Explanation
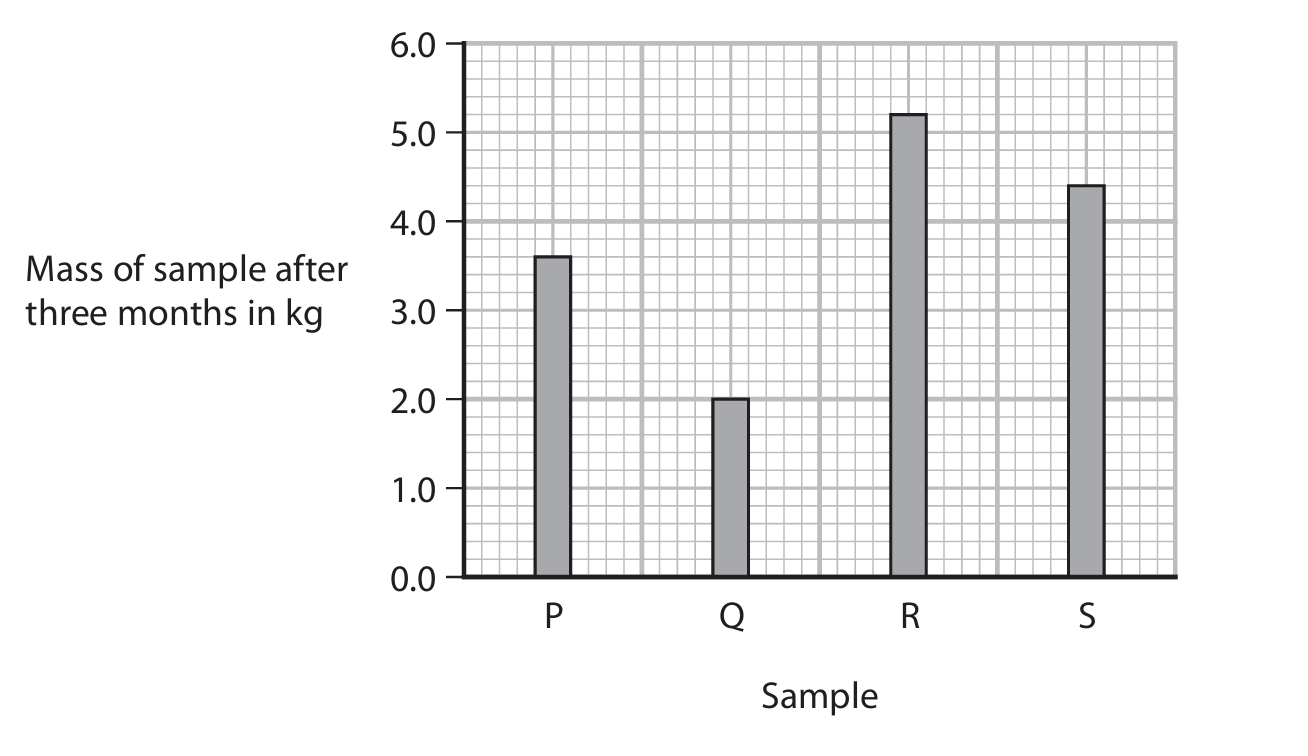
(a) An explanation that makes reference to four of the following points:
- more (decomposition) / faster with warmer temperatures / eq (1)
(allow mass remains high in low temp) - enzymes (1)
- more (decomposition) / faster with cut material / eq (1)
(allow mass remains high in uncut) - more surface area (1)
- fungi / bacteria (1)
(allow converse)
Example answer: Decomposition is faster at \(20^\circ C\) (samples Q and S) than at \(10^\circ C\) (samples P and R) because enzymes in decomposers like fungi and bacteria work more efficiently at higher temperatures. Cutting the leaves into small pieces (samples P and Q) increases the surface area available for decomposers and their enzymes to act on, leading to faster decomposition compared to uncut leaves (samples R and S) at the same temperature.
(b) Calculation:
- Mass loss for P: \(6.0 – 3.6 = 2.4 \text{ kg}\)
- Rate for P: \(2.4 \div 3 = 0.8 \text{ kg per month}\)
- Mass loss for Q: \(6.0 – 2.0 = 4.0 \text{ kg}\)
- Rate for Q: \(4.0 \div 3 = 1.333… \text{ kg per month}\)
- Difference: \(1.333… – 0.8 = 0.533… \text{ kg per month}\)
Answer: \(0.53\) (allow \(0.5\), \(0.53\), \(0.533\), etc.) kg per month
Award full marks for correct numerical answer without working.
(c) An answer that makes reference to two of the following points:
- species / type of leaves / plant (1)
- age of plant / leaves (1)
(ignore volume of leaves) - same (number of) / type of decomposers / eq (1)
- insects or organisms that might consume leaf / eq (1)
Example answer: 1. The species/type of leaf used. 2. The presence/absence of specific decomposers (e.g., fungi, bacteria).