
Food Chains, Food Webs & Ecological Pyramids
🌱 Food Chains
Definition
- A food chain is a simple diagram that shows how food and energy pass from one organism to another in a single feeding pathway.
- The arrows in a food chain show the direction of energy flow, not the direction in which an organism moves.
- Energy always flows from the organism being eaten to the organism that eats it.
Parts of a Food Chain
A food chain usually includes: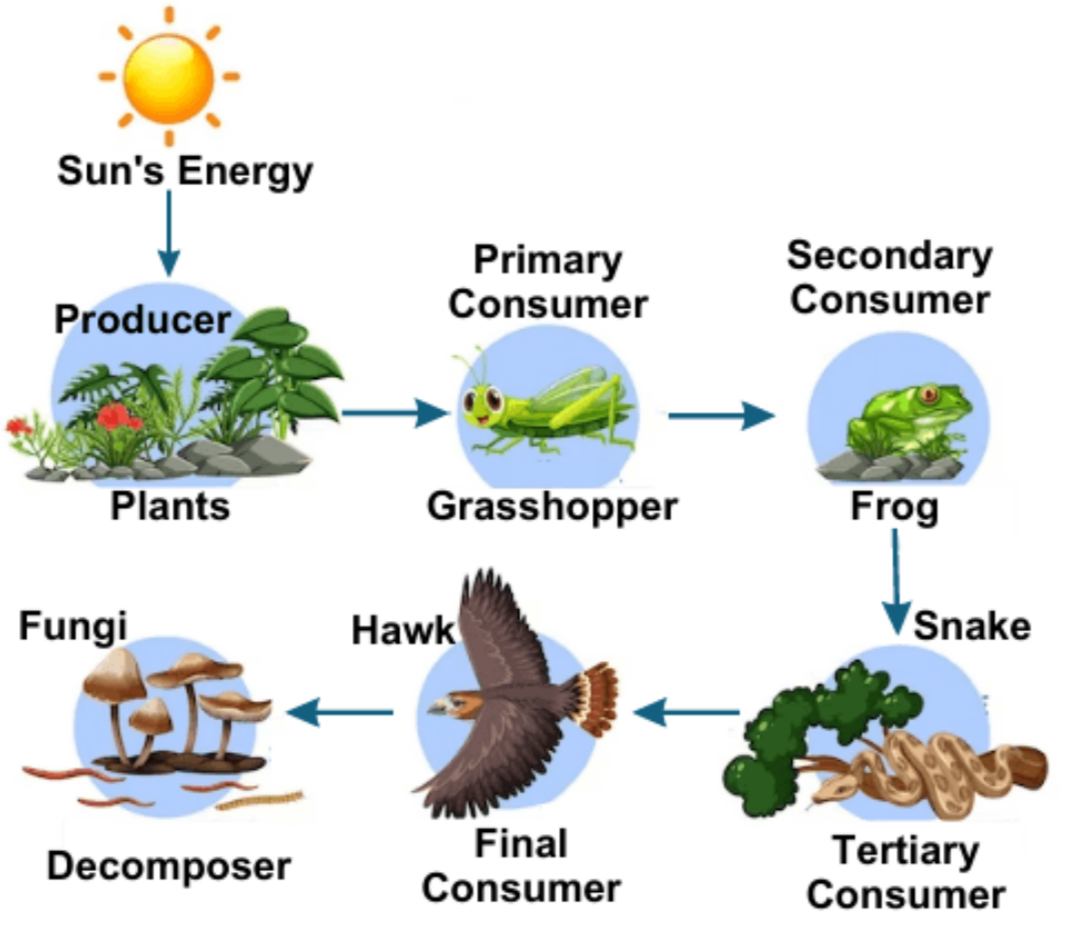
- Producer
- Primary consumer
- Secondary consumer
- Tertiary consumer
Some food chains may have fewer or more trophic levels depending on the ecosystem.
Example of a Food Chain
Grass → Grasshopper → Frog → Snake → Eagle
Explanation:
- Grass makes its own food by photosynthesis, so it is the producer.
- Grasshopper eats grass, so it is the primary consumer.
- Frog eats grasshopper, so it is the secondary consumer.
- Snake eats frog, making it the tertiary consumer.
- Eagle is the top predator in this food chain.
Important Features of a Food Chain
- Shows only one feeding pathway.
- Starts with a producer.
- Arrows always point towards the organism receiving energy.
- Shows how energy moves from one trophic level to the next.
- Does not show all feeding relationships in an ecosystem.
🕸️ Food Webs
Definition
- A food web is a network of interconnected food chains that shows all the feeding relationships in an ecosystem.
- Most organisms eat more than one type of food, so food webs give a more realistic picture than a single food chain.
Why Food Webs are More Realistic
In nature:
- One animal may eat several different organisms.
- One organism may be eaten by many different predators.
- Organisms may belong to more than one food chain.
Food webs show these multiple feeding relationships.
Example of a Food Web
In a grassland ecosystem:
- Grass is eaten by rabbits, grasshoppers and mice.
- Rabbits may be eaten by foxes and hawks.
- Mice may be eaten by snakes and owls.
- Grasshoppers may be eaten by frogs and birds.
- Snakes may be eaten by hawks.
All these food chains connect to form a food web.
Importance of Food Webs
Food webs help us understand:
- How organisms depend on each other.
- How energy flows through an ecosystem.
- The effect of removing one species.
Example
If rabbit numbers decrease:
- Foxes may have less food.
- Hawks may eat more mice instead.
- Grass may increase because fewer rabbits are eating it.
One change can affect many other organisms.
📊 Pyramids of Numbers
Definition
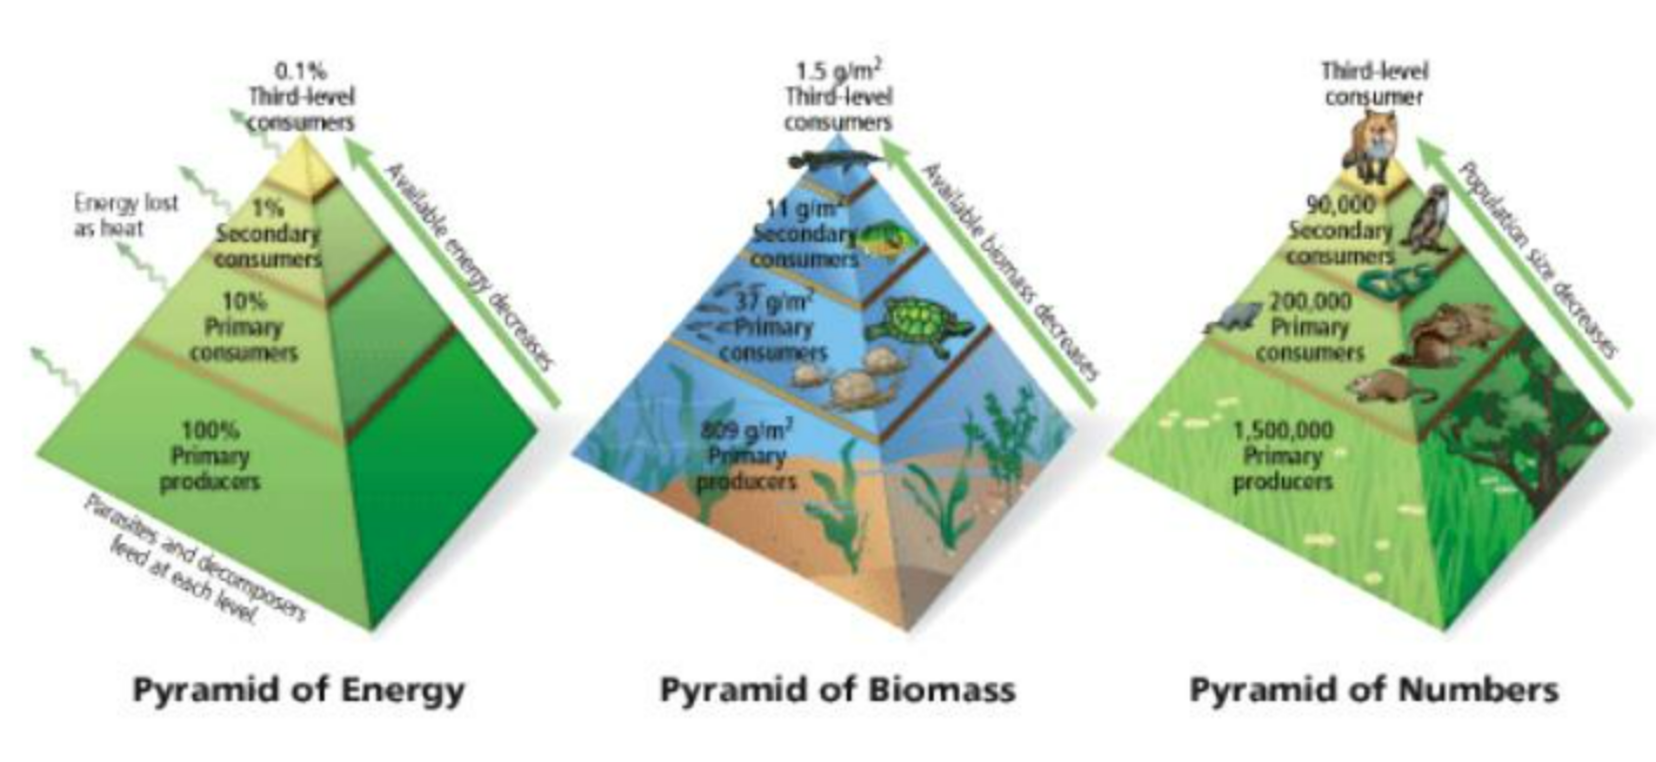
- A pyramid of numbers shows the number of organisms present at each trophic level in a food chain.
- It does not show the size or mass of the organisms.
Features
- Producers usually have the largest number of organisms.
- The number of organisms usually decreases at higher trophic levels.
- Each level is drawn as a bar.
Example
| Trophic Level | Approximate Number |
|---|---|
| Grass | 10,000 plants |
| Rabbits | 200 |
| Foxes | 5 |
The pyramid becomes narrower towards the top because fewer predators are supported.
Inverted Pyramid of Numbers
Sometimes the pyramid is not pyramid-shaped.
Example
One large oak tree → Hundreds of insects → Thousands of parasites
- One tree can support many insects.
- Many insects can support even more parasites.
This produces an inverted pyramid of numbers.
Advantages
- Simple to construct.
- Shows how the number of organisms changes between trophic levels.
Limitations
- Does not show the size of organisms.
- One large tree counts the same as one tiny plant.
- Does not show how much food or energy is available.
🌾 Pyramids of Biomass
Definition
- A pyramid of biomass shows the total dry mass of living organisms at each trophic level.
- Biomass is measured after removing water because water content varies greatly between organisms.
What is Biomass?
- Biomass is the total dry mass of living material in organisms.
- It is usually measured in:
grams per square metre (g/m²)
or
kilograms per square metre (kg/m²)
Features
- Producers usually have the greatest biomass.
- Biomass decreases at each higher trophic level.
- Gives a more accurate picture than a pyramid of numbers.
Example
| Trophic Level | Biomass |
|---|---|
| Grass | 8000 g/m² |
| Rabbits | 1000 g/m² |
| Foxes | 80 g/m² |
Although there may be fewer trees than insects, trees usually have a much greater biomass.
Why Biomass Decreases
Not all food eaten becomes new body tissue.
Some food is:
- Used in respiration.
- Lost as heat.
- Lost in waste materials.
- Not completely digested.
As a result, less biomass is available for the next trophic level.
Advantages
- Takes organism size into account.
- Gives a better estimate of the amount of living material.
- Helps compare ecosystems more accurately.
⚡ Pyramids of Energy Transfer
Definition
- A pyramid of energy transfer shows the amount of energy available at each trophic level over a period of time.
- It shows how much energy is passed from one trophic level to the next.
Features
- Energy is measured in units such as kilojoules per square metre per year (kJ/m²/year).
- The producer always contains the greatest amount of energy.
- Each higher trophic level contains less energy.
- Energy pyramids are always upright.
Why Energy Decreases at Each Trophic Level
A large amount of energy is lost before it reaches the next trophic level.
Energy is lost because organisms:
- Carry out respiration.
- Release heat to the surroundings.
- Move from place to place.
- Maintain body temperature.
- Excrete waste materials such as urine and faeces.
- Leave some food uneaten or undigested.
Only a small amount of energy becomes new body tissue and can be passed to the next trophic level.
Example
| Trophic Level | Energy Available |
|---|---|
| Grass | 20,000 kJ |
| Rabbit | 2,000 kJ |
| Fox | 200 kJ |
| Eagle | 20 kJ |
The amount of energy becomes smaller at each trophic level.
Importance of Energy Pyramids
They help explain:
- Why food chains usually have only a few trophic levels.
- Why there are fewer top predators.
- Why large numbers of producers are needed to support consumers.
🌍 Comparison of Food Chains and Food Webs
| Food Chain | Food Web |
|---|---|
| Shows one feeding pathway. | Shows many connected feeding pathways. |
| Simple to understand. | More complex but more realistic. |
| Each organism usually has one food source. | Organisms often have several food sources. |
| Does not show all interactions. | Shows how organisms are interconnected in an ecosystem. |
📊 Comparison of Ecological Pyramids
| Pyramid of Numbers | Pyramid of Biomass | Pyramid of Energy Transfer |
|---|---|---|
| Shows the number of organisms at each trophic level. | Shows the total dry mass of organisms at each trophic level. | Shows the amount of energy available at each trophic level. |
| Does not consider organism size. | Considers the size and mass of organisms. | Shows energy flow through the ecosystem. |
| May be upright or inverted. | Usually upright. | Always upright. |
| Units: Number of organisms. | Units: g/m² or kg/m². | Units: kJ/m²/year. |
📝 Quick Recap
Food chain = single pathway, food web = network.
Pyramids:
• Numbers → count of organisms.
• Biomass → total dry mass.
• Energy → energy transfer, always upright.
Energy flow = one way obeys 10% rule.
Food webs = more stable than chains.