Interpreting Graphs
Graphs are used to show how one quantity changes compared to another.
You must be able to read information from both linear (straight line) and non-linear (curved) graphs.
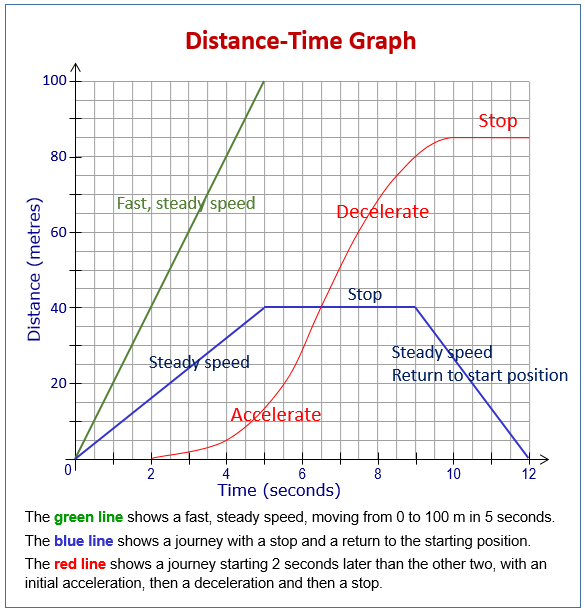
Distance–Time Graphs
A distance–time graph shows how distance changes over time.
Key interpretations:
- Horizontal line → object is stationary
- Straight sloping line → constant speed
- Steeper line → faster speed
- Curve → changing speed
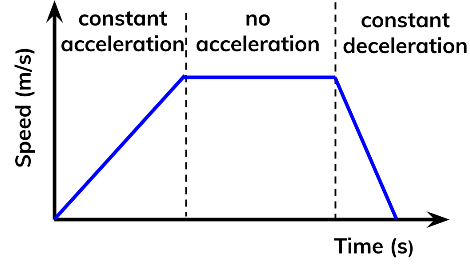
Speed–Time Graphs
A speed–time graph shows how speed changes over time.
Key interpretations:
- Horizontal line → constant speed
- Upward slope → acceleration
- Downward slope → deceleration
- Area under graph → distance travelled
Non-Linear Graphs
Curved graphs show the rate of change is not constant.
- Curve getting steeper → increasing rate
- Curve flattening → decreasing rate
Example 1:
A distance–time graph is horizontal between 10 minutes and 20 minutes. What does this mean?
▶️ Answer/Explanation
Distance is not changing.
Conclusion: The object is stationary.
Example 2:
On a speed–time graph, the line slopes upward. What does this show?
▶️ Answer/Explanation
Speed is increasing with time.
Conclusion: The object is accelerating.
Example 3:
A curve on a graph becomes steeper over time. What does this mean?
▶️ Answer/Explanation
The rate of change is increasing.
Conclusion: The quantity is increasing faster and faster.
Rectangular Cartesian Coordinates
The Cartesian coordinate system is a grid used to show positions on a graph.
It is formed by two perpendicular number lines called axes.
Horizontal axis → \( x \)-axis
Vertical axis → \( y \)-axis
The Origin
The point where the axes cross is called the origin.
Coordinates of the origin: \( (0,0) \)
Coordinates
Every point on the grid is written as an ordered pair:
\( (x, y) \)
The first number is the horizontal movement.
The second number is the vertical movement.
Quadrants
The axes divide the grid into four regions called quadrants.
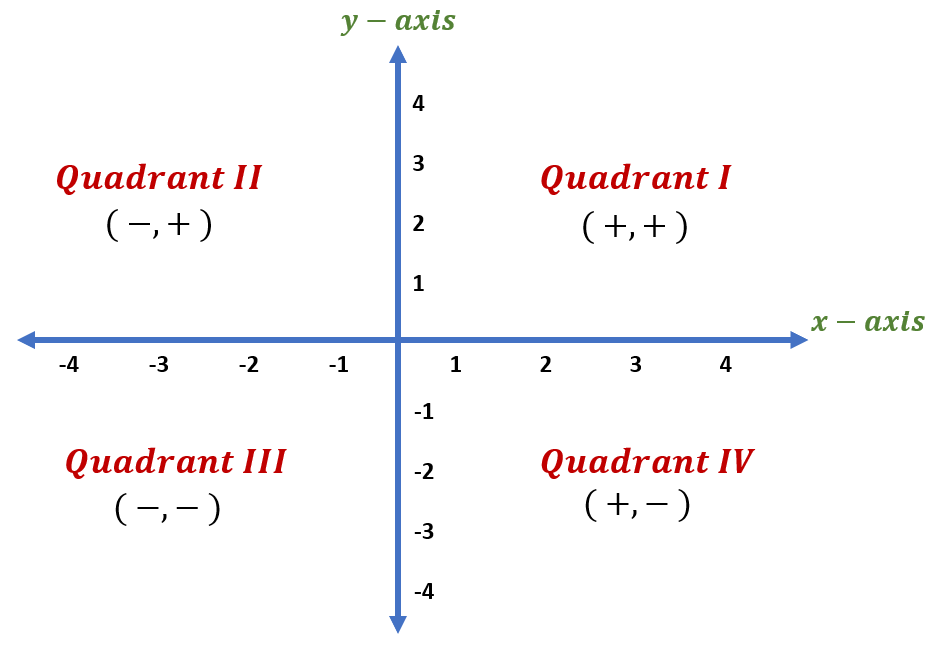
Quadrant I: \( x>0,\; y>0 \)
Quadrant II: \( x<0,\; y>0 \)
Quadrant III: \( x<0,\; y<0 \)
Quadrant IV: \( x>0,\; y<0 \)
Key Idea
Move along the \( x \)-axis first, then move along the \( y \)-axis.
Example 1:
State the coordinates of the origin.
▶️ Answer/Explanation
Axes intersect at \( (0,0) \).
Conclusion: \( (0,0) \).
Example 2:
Which quadrant contains the point \( (4, -3) \)?
▶️ Answer/Explanation
\( x \) is positive and \( y \) is negative.
Conclusion: Quadrant IV.
Example 3:
Which quadrant contains the point \( (-2, 5) \)?
▶️ Answer/Explanation
\( x \) negative, \( y \) positive.
Conclusion: Quadrant II.
Plotting Points and Locating Coordinates
Points on a graph are written as ordered pairs: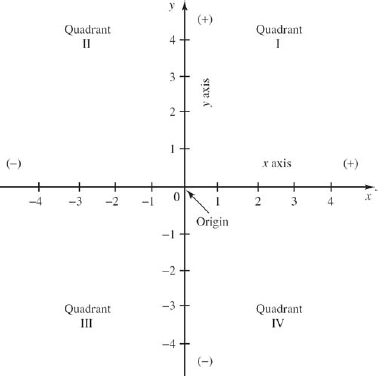
\( (x, y) \)
To plot a point:
1. Move along the \( x \)-axis first (left or right).
2. Then move along the \( y \)-axis (up or down).
Remember
Right → positive \( x \)
Left → negative \( x \)
Up → positive \( y \)
Down → negative \( y \)
All Four Quadrants
Points can lie in any of the four quadrants depending on the signs of \( x \) and \( y \).
Example 1:
Plot the point \( (3, 2) \).
▶️ Answer/Explanation
Move 3 units right, then 2 units up.
Conclusion: The point lies in Quadrant I.
Example 2:
Plot the point \( (-4, 1) \).
▶️ Answer/Explanation
Move 4 units left, then 1 unit up.
Conclusion: The point lies in Quadrant II.
Example 3:
A point is 2 units to the right and 5 units down from the origin. Write its coordinates.
▶️ Answer/Explanation
Right → positive \( x \)
Down → negative \( y \)
\( (2, -5) \)
Conclusion: Coordinates are \( (2, -5) \).
Finding Coordinates from Geometrical Information
Sometimes a point is not given directly. Instead, we are told information about its position on a diagram.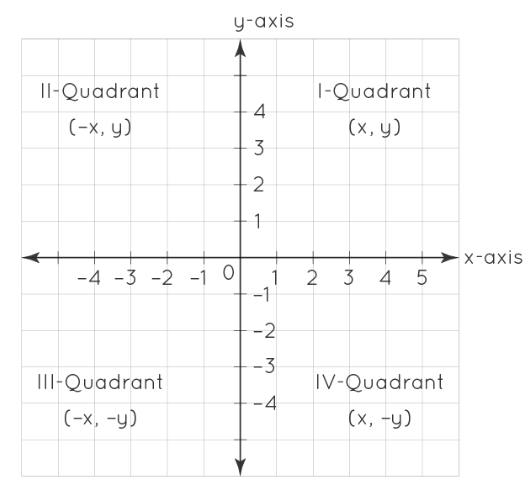
We use the properties of shapes and lines to determine its coordinates.
Important Ideas
Points on the \( x \)-axis have \( y = 0 \)
Points on the \( y \)-axis have \( x = 0 \)
Parallel lines keep the same direction
A square or rectangle has equal or perpendicular sides
Using the Axes
If a point lies on an axis, one coordinate is automatically known.
On \( x \)-axis → \( y=0 \)
On \( y \)-axis → \( x=0 \)
Using Shape Properties
For rectangles and squares, opposite sides are parallel and equal in length.
So matching horizontal movements keep the same \( y \)-coordinate, and matching vertical movements keep the same \( x \)-coordinate.
Example 1:
Point \( A \) lies on the \( x \)-axis directly below the point \( (4, 5) \). Find the coordinates of \( A \).
▶️ Answer/Explanation
Same vertical line → same \( x \)-coordinate.
On the \( x \)-axis → \( y = 0 \).
\( (4, 0) \)
Conclusion: \( A = (4, 0) \).
Example 2:
Point \( B \) lies on the \( y \)-axis level with the point \( (-3, 2) \). Find the coordinates of \( B \).
▶️ Answer/Explanation
Same horizontal line → same \( y \)-coordinate.
On the \( y \)-axis → \( x = 0 \).
\( (0, 2) \)
Conclusion: \( B = (0, 2) \).
Example 3:
A rectangle has vertices \( (1,1) \), \( (5,1) \), and \( (5,4) \). Find the fourth vertex.
▶️ Answer/Explanation
Horizontal sides share the same \( y \)-coordinate.
Vertical sides share the same \( x \)-coordinate.
Fourth point must have \( x = 1 \) and \( y = 4 \).
\( (1, 4) \)
Conclusion: The fourth vertex is \( (1, 4) \).
Midpoint of a Line Segment
The midpoint is the point exactly halfway between two points on a straight line.
To find the midpoint, we average the \( x \)-coordinates and the \( y \)-coordinates.
Midpoint Formula
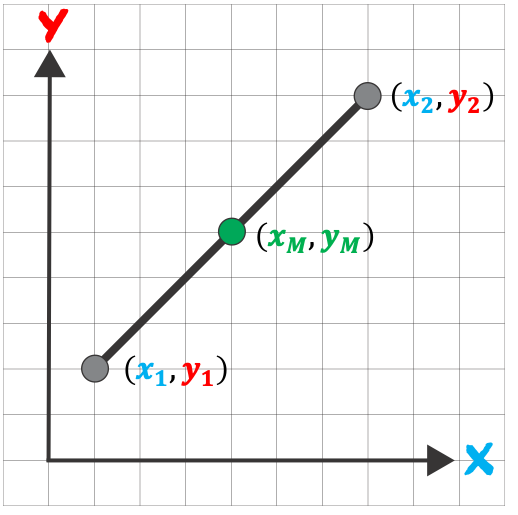
If the endpoints are \( (x_1, y_1) \) and \( (x_2, y_2) \)
Midpoint \( = \left( \dfrac{x_1 + x_2}{2},\; \dfrac{y_1 + y_2}{2} \right) \)
Key Idea
Add the coordinates, then divide by 2.
Example 1:
Find the midpoint of \( (2, 4) \) and \( (6, 8) \).
▶️ Answer/Explanation
\( x \)-coordinate:
\( \dfrac{2+6}{2} = 4 \)
\( y \)-coordinate:
\( \dfrac{4+8}{2} = 6 \)
Conclusion: Midpoint \( (4, 6) \).
Example 2:
Find the midpoint of \( (-3, 5) \) and \( (7, 1) \).
▶️ Answer/Explanation
\( \dfrac{-3+7}{2} = 2 \)
\( \dfrac{5+1}{2} = 3 \)
Conclusion: \( (2, 3) \).
Example 3:
The midpoint of a line is \( (5, 4) \). One endpoint is \( (2, 6) \). Find the other endpoint.
▶️ Answer/Explanation
Let the unknown point be \( (x, y) \).
\( \dfrac{2 + x}{2} = 5 \Rightarrow 2 + x = 10 \Rightarrow x = 8 \)
\( \dfrac{6 + y}{2} = 4 \Rightarrow 6 + y = 8 \Rightarrow y = 2 \)
Conclusion: The other endpoint is \( (8, 2) \).
Straight Line Conversion Graphs
A conversion graph is used to change one unit into another using a straight line graph.
Examples include currency, temperature and measurement conversions.
Because the quantities increase proportionally, the graph is a straight line passing through the origin.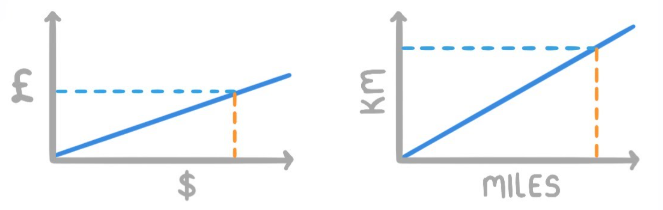
How to Draw a Conversion Graph
1. Choose suitable scales for both axes.
2. Label each axis with units.
3. Plot at least two correct conversion points.
4. Join the points with a straight line.
Using the Graph
To convert:
Move vertically to the line.
Then move horizontally to read the value.
Example Conversion
Suppose \( 1 \) USD \( = ₹80 \).
\( 0 \) USD → ₹0
\( 1 \) USD → ₹80
\( 5 \) USD → ₹400
Plot these points and join them with a straight line.
Key Idea
Straight line through origin → constant conversion rate.
Example 1:
If \( 1 \) USD \( = ₹80 \), how many rupees is \( 3 \) USD?
▶️ Answer/Explanation
\( 3 \times 80 = 240 \)
Conclusion: ₹240.
Example 2:
Using the same graph, convert ₹400 to USD.
▶️ Answer/Explanation
\( 400 \div 80 = 5 \)
Conclusion: \( 5 \) USD.
Example 3:
A graph shows \( 2 \) kg corresponds to ₹300. Find the cost of \( 5 \) kg.
▶️ Answer/Explanation
Find unit rate:
₹300 ÷ 2 = ₹150 per kg
₹150 × 5 = ₹750
Conclusion: ₹750.
Gradient of a Straight Line
The gradient describes how steep a straight line is.
It shows how much the graph rises vertically for a horizontal movement.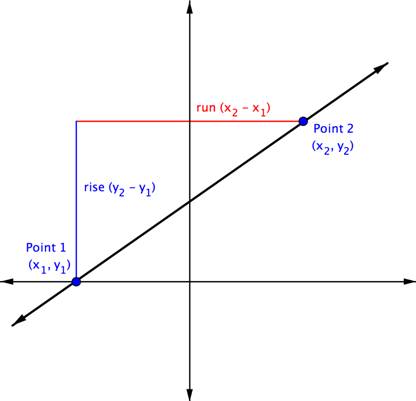
Gradient Formula
Gradient \( = \dfrac{\text{increase in } y}{\text{increase in } x} \)
Using two points \( (x_1, y_1) \) and \( (x_2, y_2) \):
\( \text{gradient} = \dfrac{y_2 – y_1}{x_2 – x_1} \)
Types of Gradient
Positive gradient → line rises left to right
Negative gradient → line falls left to right
Zero gradient → horizontal line
Key Idea
Gradient measures steepness, not height.
Example 1:
Find the gradient between \( (1,2) \) and \( (5,10) \).
▶️ Answer/Explanation
\( \dfrac{10-2}{5-1} = \dfrac{8}{4} = 2 \)
Conclusion: Gradient \( = 2 \).
Example 2:
Find the gradient between \( (-2,4) \) and \( (3,-1) \).
▶️ Answer/Explanation
\( \dfrac{-1-4}{3-(-2)} = \dfrac{-5}{5} = -1 \)
Conclusion: Gradient \( = -1 \).
Example 3:
A line passes through \( (0,3) \) and \( (4,3) \). Find the gradient.
▶️ Answer/Explanation
\( \dfrac{3-3}{4-0} = 0 \)
Conclusion: Gradient \( = 0 \) (horizontal line).
Equations of Straight Line Graphs
Straight line graphs can be written in the form: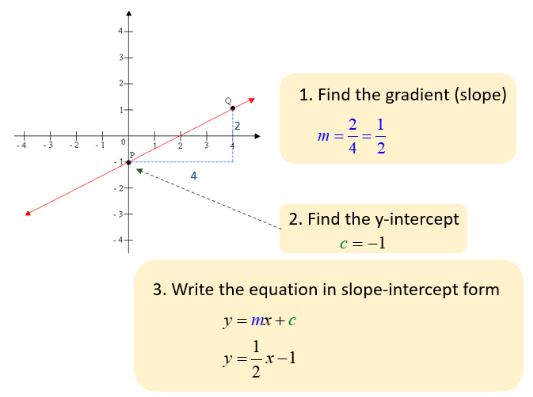
\( y = mx + c \)
Meaning of the Symbols
\( m \) = gradient (slope of the line)
\( c \) = \( y \)-intercept (where the line crosses the \( y \)-axis)
The graph always crosses the \( y \)-axis at the point:
\( (0, c) \)
Identifying the Gradient and Intercept
From the equation, the number in front of \( x \) is the gradient and the constant number is the intercept.
Example: \( y = 3x + 5 \)
Gradient \( = 3 \)
\( y \)-intercept \( = (0,5) \)
Forming an Equation
If the gradient and intercept are known, substitute them into \( y = mx + c \).
Gradient \( 6 \), intercept \( 2 \)
\( y = 6x + 2 \)
Key Idea
Gradient tells steepness.
Intercept tells starting value.
Example 1:
Write down the gradient and \( y \)-intercept of \( y = 3x + 5 \).
▶️ Answer/Explanation
Gradient \( = 3 \)
Intercept \( = (0,5) \)
Conclusion: Gradient \( 3 \), intercept \( (0,5) \).
Example 2:
Write the equation of the line with gradient \( 6 \) passing through \( (0,2) \).
▶️ Answer/Explanation
Point \( (0,2) \) is the intercept, so \( c = 2 \).
\( y = 6x + 2 \)
Conclusion: \( y = 6x + 2 \).
Example 3:
Find the \( y \)-intercept of \( y = -2x + 4 \).
▶️ Answer/Explanation
\( c = 4 \)
Intercept point \( (0,4) \)
Conclusion: \( (0,4) \).
Plotting Linear and Quadratic Graphs
We can draw graphs of functions by calculating values and plotting points.
We usually make a table of values, then plot the coordinates.
Linear Graphs
A linear graph is a straight line.
Example forms:
\( y = x \)
\( y = 2x + 1 \)
\( x = k \) (vertical line)
\( y = c \) (horizontal line)
Quadratic Graphs
A quadratic graph contains \( x^2 \) and forms a curve called a parabola.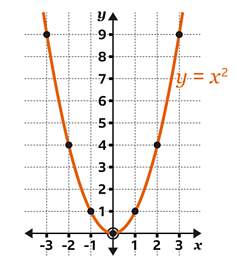
Example: \( y = x^2 \)
Steps to Plot
1. Choose several \( x \)-values.
2. Substitute into the equation.
3. Write coordinates \( (x,y) \).
4. Plot the points.
5. Join smoothly.
Equations of the Form \( ax + by = c \)
Rearrange into \( y = mx + c \).
Example:
\( 2x + y = 6 \)
\( y = -2x + 6 \)
Example 1:
Complete the table for \( y = x \) when \( x = -2,-1,0,1,2 \).
▶️ Answer/Explanation
\( y=x \), so values are:
\( (-2,-2),(-1,-1),(0,0),(1,1),(2,2) \)
Conclusion: Straight line through the origin.
Example 2:
Plot \( y = x^2 \) for \( x = -2,-1,0,1,2 \).
▶️ Answer/Explanation
\( y = 4,1,0,1,4 \)
Points:
\( (-2,4),(-1,1),(0,0),(1,1),(2,4) \)
Conclusion: A U-shaped parabola.
Example 3:
Plot the graph of \( 2x + y = 6 \).
▶️ Answer/Explanation
Rearrange:
\( y = -2x + 6 \)
Choose values:
If \( x=0 \), \( y=6 \)
If \( x=3 \), \( y=0 \)
Points \( (0,6) \) and \( (3,0) \)
Conclusion: Straight line through these points.