Two-Way Tables
A two-way table is used to organise data that can be classified in two different ways at the same time.
For example, students may be grouped by gender and by favourite subject.
Rows usually show one category and columns show the other category.
Totals
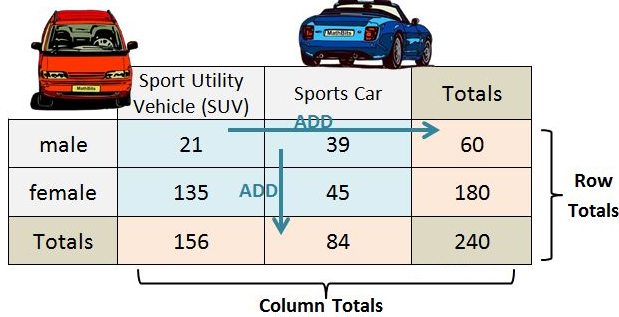
Two-way tables normally include totals:
- Row totals
- Column totals
- Grand total
Important Rule
The total of all row totals must equal the total of all column totals.
Example 1:
A survey recorded whether students preferred Football or Cricket.
Boys: 12 football, 8 cricket
Girls: 7 football, 13 cricket
Represent this in two way table
▶️ Answer/Explanation
Football total:
\( 12 + 7 = 19 \)
Cricket total:
\( 8 + 13 = 21 \)
Boys total:
\( 12 + 8 = 20 \)
Girls total:
\( 7 + 13 = 20 \)
Grand total:
\( 40 \)
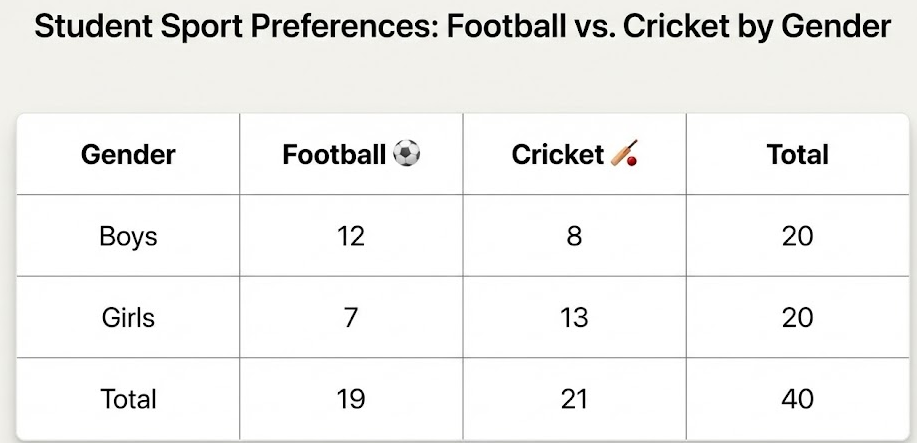
Conclusion: Completed two-way table.
Example 2:
In a class of 30 students, 18 are boys and 12 are girls. 10 boys like maths. How many boys do not like maths?
▶️ Answer/Explanation
\( 18 – 10 = 8 \)
Conclusion: 8 boys.
Example 3:
The total number of students who like science is 22. If 9 are girls, how many are boys?
▶️ Answer/Explanation
\( 22 – 9 = 13 \)
Conclusion: 13 boys.