Language of Probability
Probability measures how likely something is to happen.
We describe chance using special terms.
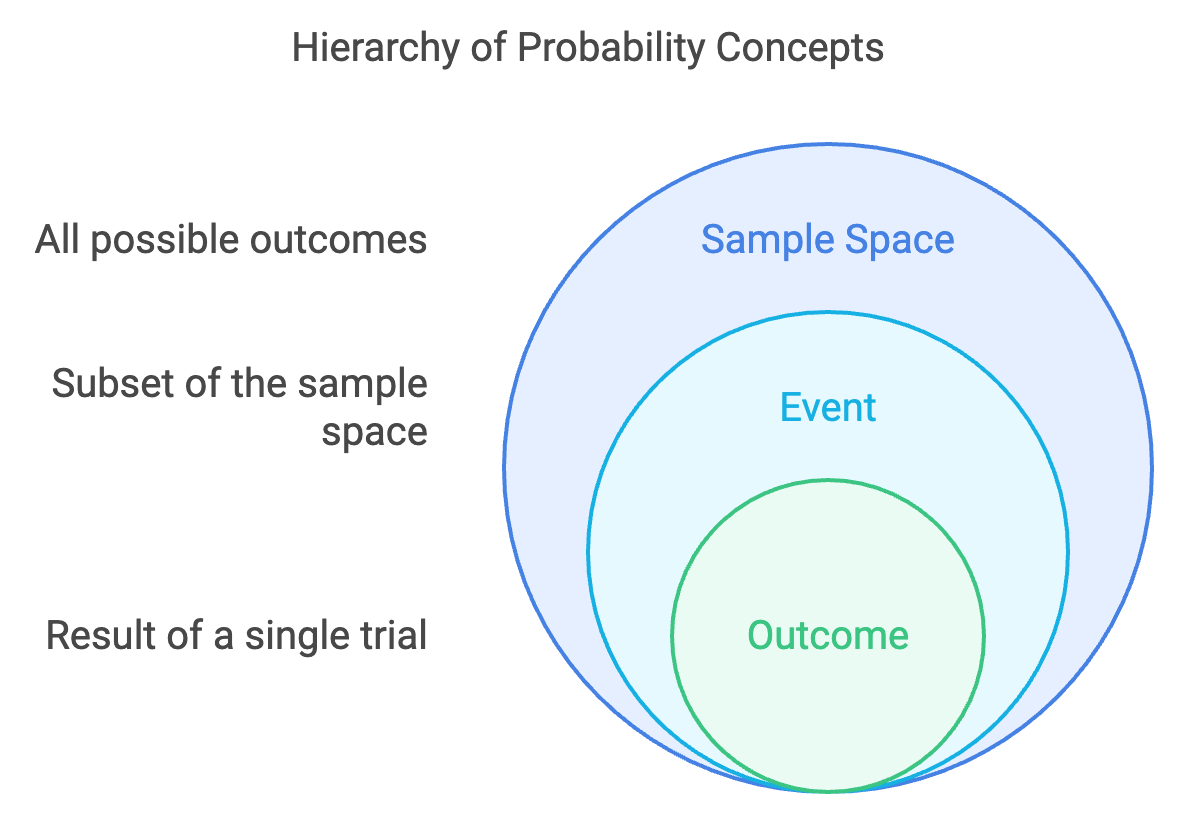
Outcome
An outcome is a possible result of an experiment.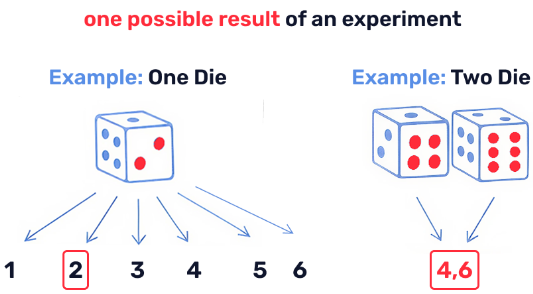
Example: Tossing a coin → Heads or Tails
Event
An event is one or more outcomes.
Example: Getting a head when tossing a coin
Random
A random experiment has no predictable result.
Example: Rolling a fair die
Equal Likelihood
Outcomes are equally likely when each outcome has the same chance of happening.
Example: Each number on a fair die has probability \( \dfrac{1}{6} \).
Key Idea
Probability compares favourable outcomes to total outcomes.
Example 1:
When tossing a coin, state the outcomes.
▶️ Answer/Explanation
Heads, Tails
Conclusion: Two outcomes.
Example 2:
Rolling a fair die, what is the event “getting an even number”?
▶️ Answer/Explanation
Even numbers: \( 2,4,6 \)
Conclusion: The event contains 3 outcomes.
Example 3:
Is choosing a card from a shuffled deck a random experiment?
▶️ Answer/Explanation
The result cannot be predicted.
Conclusion: Yes, it is random.
The Probability Scale
Probability is measured on a scale from 0 to 1.
It shows how likely an event is to happen.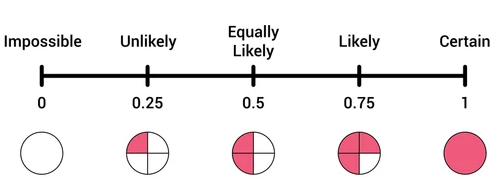
Key Values
\( P(\text{impossible}) = 0 \)
\( P(\text{certain}) = 1 \)
All probabilities lie between 0 and 1:
\( 0 \le P(A) \le 1 \)
Interpreting the Scale
Close to 0 → unlikely
Around 0.5 → even chance
Close to 1 → very likely
Important
Probability can also be written as a fraction, decimal or percentage.
Example 1:
What is the probability of rolling a 7 on a normal six-sided die?
▶️ Answer/Explanation
A die only has numbers 1 to 6.
Impossible event
Conclusion: \( P = 0 \).
Example 2:
What is the probability that the sun will rise tomorrow?
▶️ Answer/Explanation
This is considered certain.
Conclusion: \( P = 1 \).
Example 3:
A fair coin is tossed. What is the probability of getting a head?
▶️ Answer/Explanation
Two equally likely outcomes.
\( P(\text{Head}) = \dfrac{1}{2} = 0.5 \)
Conclusion: Even chance.
Theoretical Probability
When all outcomes are equally likely, probability can be calculated using a formula.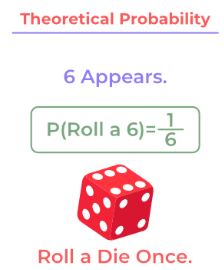
\( \text{Probability} = \dfrac{\text{Number of favourable outcomes}}{\text{Total number of possible outcomes}} \)
This is called theoretical probability because it is based on reasoning, not experiment.
Examples of Equally Likely Outcomes
- Tossing a fair coin
- Rolling a fair die
- Choosing a card from a well-shuffled deck
- Important
The probability must always be between 0 and 1.
Example 1:
Find the probability of rolling a 4 on a fair six-sided die.
▶️ Answer/Explanation
Total outcomes = 6
Favourable outcomes = 1
\( P(4) = \dfrac{1}{6} \)
Conclusion: \( \dfrac{1}{6} \).
Example 2:
A bag contains 3 red balls and 5 blue balls. One ball is chosen at random. Find the probability of choosing a red ball.
▶️ Answer/Explanation
Total balls = 8
Red balls = 3
\( P(\text{red}) = \dfrac{3}{8} \)
Conclusion: \( \dfrac{3}{8} \).
Example 3:
A spinner has 8 equal sections numbered 1 to 8. Find the probability of landing on an even number.
▶️ Answer/Explanation
Even numbers: \( 2,4,6,8 \)
Favourable outcomes = 4
Total outcomes = 8
\( P(\text{even}) = \dfrac{4}{8} = \dfrac{1}{2} \)
Conclusion: \( \dfrac{1}{2} \).
Probability from Venn Diagrams
A Venn diagram shows events using overlapping circles inside a rectangle (the sample space).
Each number inside the diagram represents the number of outcomes.
Key Terms
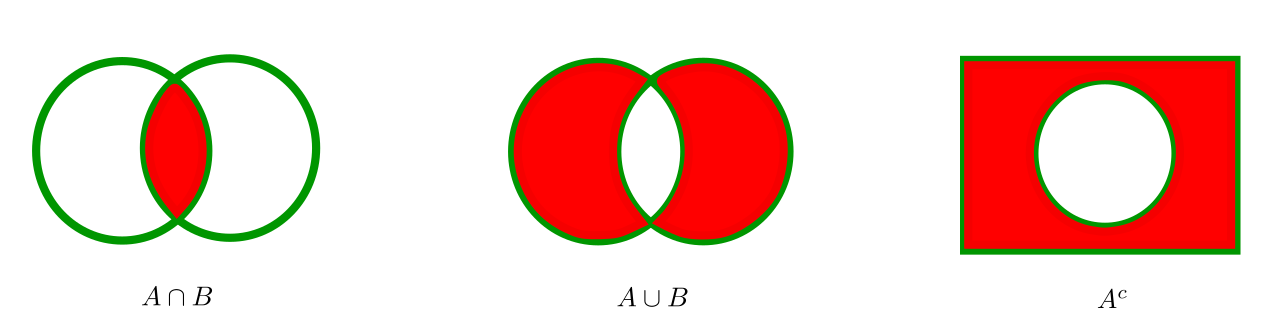
Intersection \( (A \cap B) \) → outcomes common to both sets
Union \( (A \cup B) \) → outcomes in either set
Outside both circles → neither event
Finding Probability
\( P(\text{event}) = \dfrac{\text{number in the event}}{\text{total number of outcomes}} \)
First find the total number of outcomes in the rectangle.
Example 1:
In a group of students:
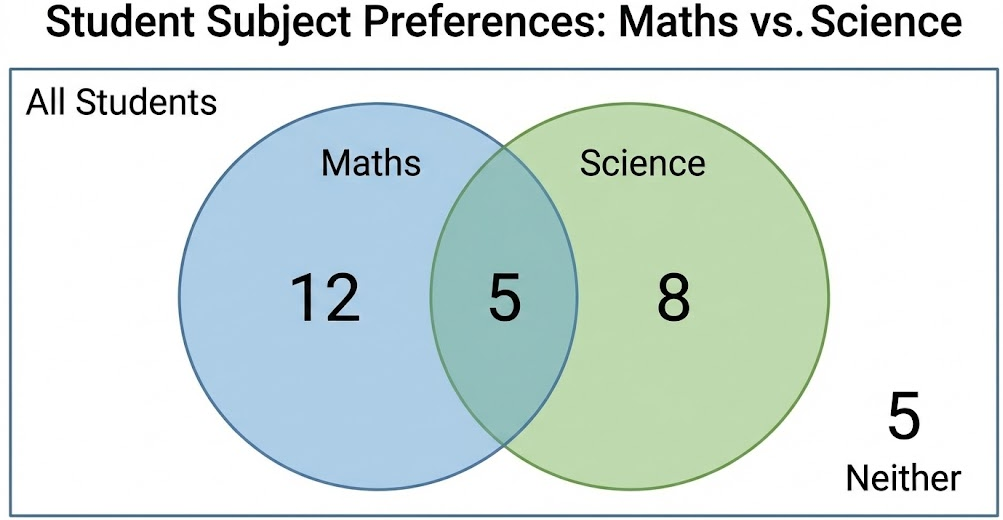
12 like Maths only
5 like both Maths and Science
8 like Science only
5 like neither
Find \( P(\text{Maths}) \).
▶️ Answer/Explanation
Students who like Maths:
\( 12 + 5 = 17 \)
Total students:
\( 12 + 5 + 8 + 5 = 30 \)
\( P(\text{Maths}) = \dfrac{17}{30} \)
Conclusion: \( \dfrac{17}{30} \).
Example 2:
Using the same data, find \( P(\text{both Maths and Science}) \).
▶️ Answer/Explanation
Favourable outcomes = 5
Total = 30
\( P = \dfrac{5}{30} = \dfrac{1}{6} \)
Conclusion: \( \dfrac{1}{6} \).
Example 3:
Find \( P(\text{neither subject}) \).
▶️ Answer/Explanation
Neither = 5
Total = 30
\( P = \dfrac{5}{30} = \dfrac{1}{6} \)
Conclusion: \( \dfrac{1}{6} \).
Sample Space and Events
The sample space is the list of all possible outcomes of a random experiment.
An event is one or more outcomes chosen from the sample space.
Notation
Sample space \( S \)
Event \( A \subseteq S \)
Finding Probability from a Sample Space
\( P(A) = \dfrac{\text{Number of outcomes in event }A}{\text{Total number of outcomes in }S} \)
Each outcome must be equally likely.
Example 1:
A coin is tossed once. Write the sample space.
▶️ Answer/Explanation
\( S = \{H, T\} \)
Conclusion: Two outcomes.
Example 2:
Two coins are tossed. List the sample space.
▶️ Answer/Explanation
\( S = \{(H,H), (H,T), (T,H), (T,T)\} \)
Conclusion: Four outcomes.
Example 3:
A die is rolled. Find the probability of getting an even number.
▶️ Answer/Explanation
Sample space:
\( S = \{1,2,3,4,5,6\} \)
Event (even numbers):
\( A = \{2,4,6\} \)
\( P(A) = \dfrac{3}{6} = \dfrac{1}{2} \)
Conclusion: \( \dfrac{1}{2} \).
Listing Outcomes Systematically
To find probabilities correctly, we must list all possible outcomes without missing any.
This is called listing outcomes systematically.
Single Events
A single event involves one experiment.
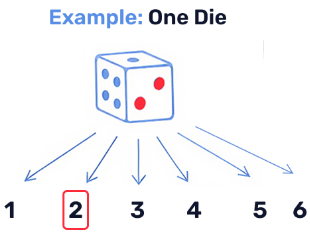
Example: Rolling one die
\( \{1,2,3,4,5,6\} \)
Two Successive Events
Two experiments happen one after the other.
We list outcomes in an ordered way so none are missed.
Example: Tossing two coins
\( (H,H), (H,T), (T,H), (T,T) \)
Tip
Fix the first outcome, then list all possibilities for the second outcome.
Example 1:
List all outcomes when a coin is tossed once.
▶️ Answer/Explanation
\( H, T \)
Conclusion: 2 outcomes.
Example 2:
List all outcomes when a die is rolled twice.
▶️ Answer/Explanation
Fix first number and vary second:
\( (1,1),(1,2),(1,3),(1,4),(1,5),(1,6) \)
\( (2,1),(2,2),(2,3),(2,4),(2,5),(2,6) \)
\( (3,1),(3,2),(3,3),(3,4),(3,5),(3,6) \)
\( (4,1),(4,2),(4,3),(4,4),(4,5),(4,6) \)
\( (5,1),(5,2),(5,3),(5,4),(5,5),(5,6) \)
\( (6,1),(6,2),(6,3),(6,4),(6,5),(6,6) \)
Conclusion: 36 outcomes.
Example 3:
Two coins are tossed. How many outcomes are possible?
▶️ Answer/Explanation
\( (H,H),(H,T),(T,H),(T,T) \)
Conclusion: 4 outcomes.
Estimating Probability from Data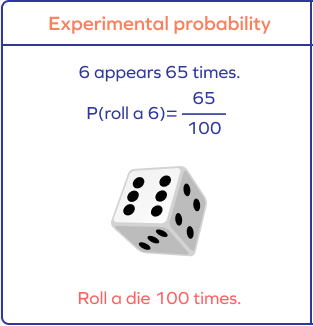
Probability can be estimated using results from an experiment.
This is called experimental probability.
\( \text{Estimated probability} = \dfrac{\text{Number of times the event occurs}}{\text{Total number of trials}} \)
The more trials carried out, the more reliable the estimate becomes.
Important
Experimental probability may not be exactly the same as theoretical probability, especially with a small number of trials.
Example 1:
A coin is tossed 40 times and lands on heads 18 times. Estimate the probability of getting a head.
▶️ Answer/Explanation
\( \dfrac{18}{40} = \dfrac{9}{20} = 0.45 \)
Conclusion: Estimated probability \( 0.45 \).
Example 2:
A die is rolled 60 times. A six appears 7 times. Estimate the probability of rolling a six.
▶️ Answer/Explanation
\( \dfrac{7}{60} \approx 0.117 \)
Conclusion: Approximately \( 0.117 \).
Example 3:
A spinner is spun 100 times. It lands on blue 28 times. Estimate the probability of landing on blue.
▶️ Answer/Explanation
\( \dfrac{28}{100} = 0.28 \)
Conclusion: Estimated probability \( 0.28 \).
Complement of an Event
The complement of an event means the event does not happen.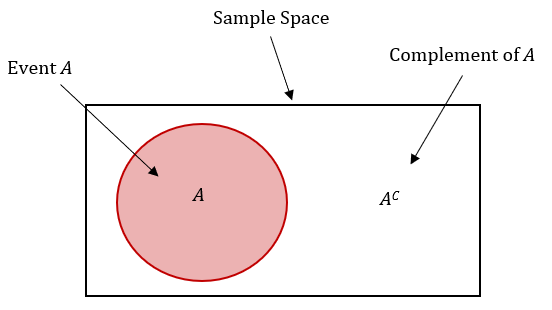
If event \( A \) happens, its complement is written \( A’ \).F
\( A’ \) = “not \( A \)”
Key Rule
\( P(A’) = 1 – P(A) \)
This works because either an event happens or it does not happen.
Important
The probabilities of an event and its complement always add to 1.
\( P(A) + P(A’) = 1 \)
Example 1:
The probability that it rains tomorrow is \( 0.3 \). Find the probability that it does not rain.
▶️ Answer/Explanation
\( P(\text{not rain}) = 1 – 0.3 = 0.7 \)
Conclusion: \( 0.7 \).
Example 2:
A bag contains only red and blue balls. The probability of choosing a red ball is \( \dfrac{2}{5} \). Find the probability of choosing a blue ball.
▶️ Answer/Explanation
\( P(\text{blue}) = 1 – \dfrac{2}{5} = \dfrac{3}{5} \)
Conclusion: \( \dfrac{3}{5} \).
Example 3:
The probability a student passes an exam is \( 0.82 \). Find the probability the student fails.
▶️ Answer/Explanation
\( 1 – 0.82 = 0.18 \)
Conclusion: \( 0.18 \).
Addition Rule for Mutually Exclusive Events
Two events are mutually exclusive if they cannot happen at the same time.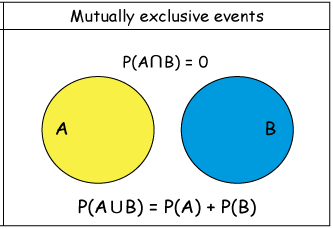
Example: When rolling a die, you cannot get both a 2 and a 5 in one roll.
Addition Rule
If events \( A \) and \( B \) are mutually exclusive:
\( P(A \text{ or } B) = P(A) + P(B) \)
This is the probability that either event occurs.
Important
Only use this rule when the events cannot occur together.
Example 1:
A fair die is rolled. Find the probability of getting a 1 or a 6.
▶️ Answer/Explanation
\( P(1) = \dfrac{1}{6} \)
\( P(6) = \dfrac{1}{6} \)
\( P(1 \text{ or } 6) = \dfrac{1}{6} + \dfrac{1}{6} = \dfrac{2}{6} = \dfrac{1}{3} \)
Conclusion: \( \dfrac{1}{3} \).
Example 2:
A card is chosen from a standard deck of 52 cards. Find the probability of getting a King or a Queen.
▶️ Answer/Explanation
Kings = 4
Queens = 4
\( P = \dfrac{4}{52} + \dfrac{4}{52} = \dfrac{8}{52} = \dfrac{2}{13} \)
Conclusion: \( \dfrac{2}{13} \).
Example 3:
A spinner has 10 equal sections numbered 1 to 10. Find the probability of landing on a multiple of 3 or a multiple of 5.
▶️ Answer/Explanation
Multiples of 3: \( 3,6,9 \) → 3 outcomes
Multiples of 5: \( 5,10 \) → 2 outcomes
Total favourable = 5
\( P = \dfrac{5}{10} = \dfrac{1}{2} \)
Conclusion: \( \dfrac{1}{2} \).