The Concept of Average
An average is a single value used to represent a set of data. It gives an idea of the “typical” value in the data.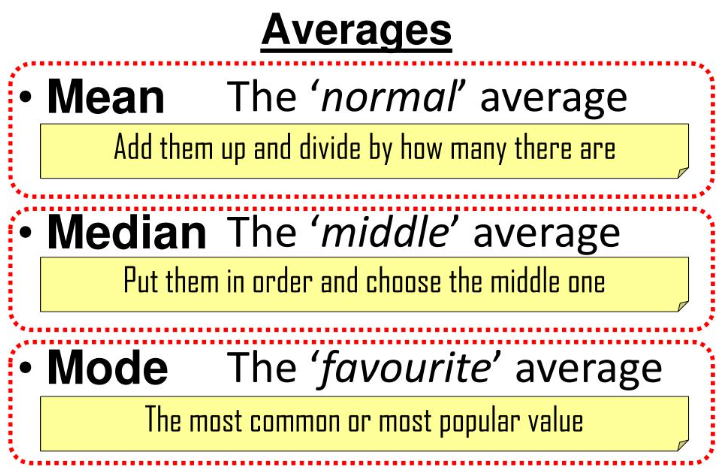
Averages help us:
- summarise data
- compare different groups
- understand general trends
There are three common types of averages:
- Mean
- Median
- Mode
Data in a List
Data may be given as a simple list of numbers.
Example: \( 2,\;5,\;3,\;6,\;4 \)
An average describes the centre of this data.
Data in a Table
Data may also be shown in a frequency table.
The table shows values and how often they occur.
Why Averages are Useful
For example, instead of listing all test scores, we can report one number that represents the performance of the class.
Important Idea
An average does not have to be one of the values in the data.
Example 1:
The marks are \( 5,\;7,\;6,\;8,\;4 \). What does an average represent?
▶️ Answer/Explanation
The average represents a typical mark for the group.
Conclusion: It shows the overall performance of the students.
Example 2:
Five students scored 3, 3, 4, 6, 9 in a quiz. Why is an average useful?
▶️ Answer/Explanation
It summarises all the scores using one value.
Conclusion: It helps describe the group performance easily.
Example 3:
A class has many heights recorded in a table. Why might we report an average height?
▶️ Answer/Explanation
To describe a typical height instead of listing every measurement.
Conclusion: The average gives a single representative value.
Mean, Median, Mode and Range (Discrete Data)
A discrete data set contains separate values, usually whole numbers such as number of goals, marks, or number of students.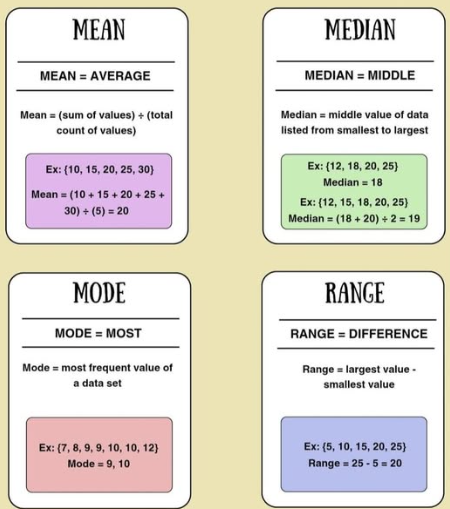
There are four important statistical measures:
- Mean
- Median
- Mode
- Range
Mean
The mean is the total of the values divided by the number of values.
\( \mathrm{Mean} = \dfrac{\mathrm{sum\ of\ values}}{\mathrm{number\ of\ values}} \)
Median
The median is the middle value when the data is written in order.
If there are two middle numbers, take their average.
Mode
The mode is the value that occurs most often.
Range
The range shows how spread out the data is.
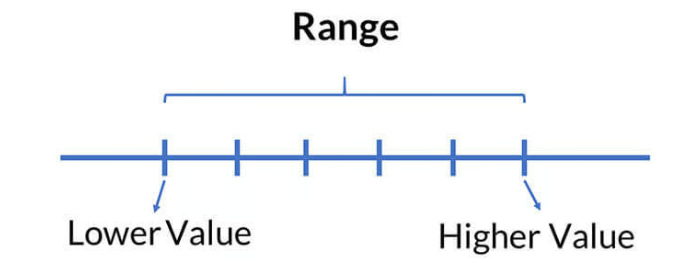
\( \mathrm{Range} = \mathrm{highest\ value} – \mathrm{lowest\ value} \)
Using a Frequency Table
If data is given in a table, multiply each value by its frequency and then divide by the total frequency to find the mean.
\( \mathrm{Mean} = \dfrac{\sum (x\times f)}{\sum f} \)
Example 1:
Find the mean of \( 4,\;6,\;7,\;3,\;5 \).
▶️ Answer/Explanation
Sum \( = 4+6+7+3+5=25 \)
Number of values \( =5 \)
\( \dfrac{25}{5}=5 \)
Conclusion: Mean \( =5 \).
Example 2:
Find the median and mode of \( 2,\;5,\;4,\;5,\;3,\;6,\;5 \).
▶️ Answer/Explanation
Arrange in order:
\( 2,\;3,\;4,\;5,\;5,\;5,\;6 \)
Middle value \( =5 \) → Median
Most frequent value \( =5 \) → Mode
Conclusion: Median \( =5 \), Mode \( =5 \).
Example 3:
The test scores are 3, 8, 6, 4, 9, 2. Find the range.
▶️ Answer/Explanation
Highest \( =9 \)
Lowest \( =2 \)
\( 9-2=7 \)
Conclusion: Range \( =7 \).
Estimate of the Mean for Grouped Data
Sometimes data is grouped into class intervals instead of listing every value.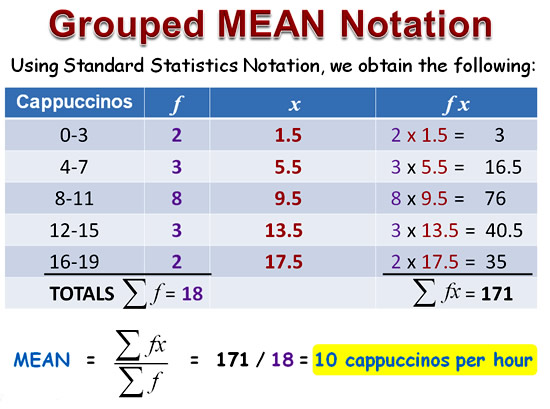
Example:
\( 0\text{–}10,\;10\text{–}20,\;20\text{–}30 \)
Because the exact values are unknown, we calculate an estimate of the mean.
Step 1: Find the Midpoint
The midpoint represents each class interval.
\( \mathrm{Midpoint} = \dfrac{\mathrm{lower\ limit}+\mathrm{upper\ limit}}{2} \)
For \( 10\text{–}20 \): \( \dfrac{10+20}{2}=15 \)
Step 2: Multiply by Frequency
Multiply each midpoint by its frequency.
\( x \times f \)
Step 3: Apply the Formula
\( \mathrm{Estimated\ mean} = \dfrac{\sum (x\times f)}{\sum f} \)
Important
This is only an estimate because we assume all values lie at the midpoint.
Example 1:
Find the midpoint of the class \( 20\text{–}30 \).
▶️ Answer/Explanation
\( \dfrac{20+30}{2}=25 \)
Conclusion: Midpoint \( =25 \).
Example 2:
The total of \( x\times f \) is 320 and total frequency is 20. Find the estimated mean.
▶️ Answer/Explanation
\( \dfrac{320}{20}=16 \)
Conclusion: Estimated mean \( =16 \).
Example 3:
A grouped table has total frequency \( 40 \) and \( \sum(xf)=600 \). Find the estimated mean.
▶️ Answer/Explanation
\( \dfrac{600}{40}=15 \)
Conclusion: Estimated mean \( =15 \).
Modal Class (Grouped Data)
When data is grouped into class intervals, we cannot always find the exact mode. Instead, we identify the modal class.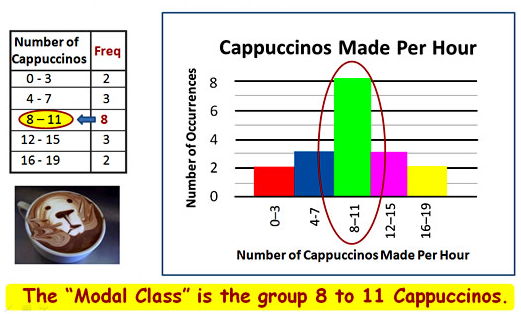
The modal class is the class interval with the highest frequency.
Example of grouped data:
\( 0\text{–}10,\;10\text{–}20,\;20\text{–}30,\;30\text{–}40 \)
Each class shows how many values fall within that interval.
How to Identify the Modal Class
Look at the frequency column and find the largest number.
Highest frequency → Modal class
Important
The modal class gives the interval where data is most concentrated, not the exact value.
Example 1:
Find the Modal class and Highest frequency of ,
The frequencies are:
| Class Interval | Frequency |
|---|---|
| 0–10 | 3 |
| 10–20 | 7 |
| 20–30 | 12 |
| 30–40 | 5 |
▶️ Answer/Explanation
Highest frequency \( =12 \)
Conclusion: Modal class is \( 20\text{–}30 \).
Example 2:
The frequencies are 5, 9, 4, 2 for intervals \( 5\text{–}10,\;10\text{–}15,\;15\text{–}20,\;20\text{–}25 \). Find the modal class.
▶️ Answer/Explanation
Largest frequency \( =9 \)
Conclusion: Modal class is \( 10\text{–}15 \).
Example 3:
Which interval is the modal class if frequencies are 6, 6, 10, 3 for \( 0\text{–}5,\;5\text{–}10,\;10\text{–}15,\;15\text{–}20 \)?
▶️ Answer/Explanation
Largest frequency \( =10 \)
Conclusion: Modal class is \( 10\text{–}15 \).