Quadratic Inequalities
A quadratic inequality is similar to a quadratic equation, but instead of an equals sign we use: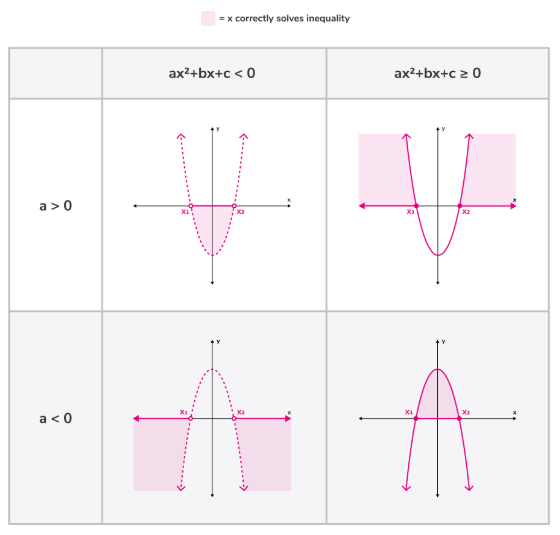
\( <,\; >,\; \le,\; \ge \)
Instead of finding single solutions, we find a range of values that make the inequality true.
Main Idea
First solve the quadratic equation. Then determine where the quadratic expression is positive or negative.
This is easiest using a number line.
Method
1. Replace the inequality with an equation.
2. Solve the quadratic equation.
3. Mark the roots on a number line.
4. Test a value in each interval.
5. Select intervals that satisfy the inequality.
Important Rule
A quadratic graph is a parabola:
- Above the x-axis → positive
- Below the x-axis → negative
Example 1:
Solve \( x^2<25 \).
▶️ Answer/Explanation
Solve equation:
\( x^2=25 \Rightarrow x=\pm5 \)
The parabola \( y=x^2 \) is less than 25 between the roots.
\( -5<x<5 \)
Conclusion: \( -5<x<5 \).
Example 2:
Solve \( 4x^2>25 \).
▶️ Answer/Explanation
\( x^2>\dfrac{25}{4} \)
\( x=\pm\dfrac{5}{2} \)
Greater than means outside the roots:
\( x<-\dfrac{5}{2} \) or \( x>\dfrac{5}{2} \)
Conclusion: \( x<-\dfrac{5}{2} \) or \( x>\dfrac{5}{2} \).
Example 3:
Solve \( x^2+3x+2>0 \).
▶️ Answer/Explanation
Factorise:
\( (x+1)(x+2)>0 \)
Roots:
\( x=-1,\;-2 \)
A positive quadratic is above the x-axis outside the roots.
\( x<-2 \) or \( x>-1 \)
Conclusion: \( x<-2 \) or \( x>-1 \).
Regions Defined by Linear Inequalities
Linear inequalities describe a region on a graph rather than a single line.
Instead of one solution, there are infinitely many solutions, represented by a shaded area.
Key Idea
Each inequality divides the graph into two halves. We shade the half that satisfies the inequality.
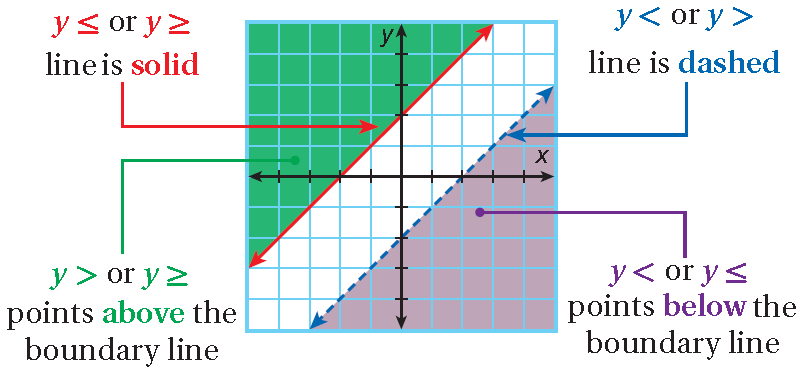
Rules
- \( \le \) or \( \ge \) → draw a solid line
- \( < \) or \( > \) → draw a dashed line
How to Shade
- Use a test point, usually \( (0,0) \) (unless the line passes through it).
- If the test point satisfies the inequality, shade that side of the line.
Multiple Inequalities
When several inequalities are given, the required solution is the region that satisfies all of them simultaneously. This is the overlapping shaded area.
Example 1:
Shade the region defined by \( x\le4 \).
▶️ Answer/Explanation
Draw the vertical line \( x=4 \).
Since the inequality is \( \le \), the line is solid.
Shade the region to the left of the line.
Conclusion: All points with \( x\le4 \).
Example 2:
Shade the region defined by \( y\le2x+1 \).
▶️ Answer/Explanation
First draw the line \( y=2x+1 \).
Use the test point \( (0,0) \):
\( 0\le1 \) true
So shade the side containing the origin.
Conclusion: Region below the line.
Example 3:
Shade the region defined by
\( x\le4 \)
\( y\le2x+1 \)
\( 5x+2y\le20 \)
▶️ Answer/Explanation
Convert third inequality:
\( 5x+2y\le20 \Rightarrow y\le10-\dfrac{5}{2}x \)
Draw all three boundary lines as solid lines.
Shade the region satisfying each inequality.
The required answer is the overlapping shaded triangular region.
Conclusion: The solution is the common shaded region.