Distance–Time Graphs
A distance–time graph shows how the distance travelled by an object changes with time. It is used to describe the motion of an object and to calculate its speed.
Axes of a Distance–Time Graph
- The horizontal axis (x-axis) shows time (s).
- The vertical axis (y-axis) shows distance (m).
Key Idea
The gradient (slope) of a distance–time graph represents the speed of the object.
\( \mathrm{speed = \dfrac{distance}{time}} \)
Types of Distance–Time Graphs
1. Straight Line with Constant Gradient
- Represents constant speed.
- The object travels equal distances in equal intervals of time.

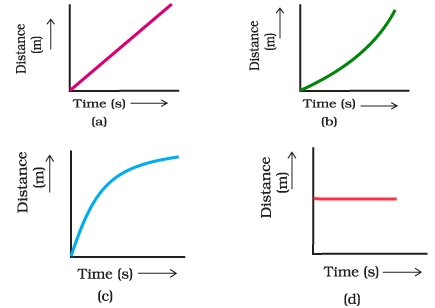
2. Horizontal Line
- Represents an object at rest.
- Distance does not change as time increases.
- Speed is zero.
3. Curved Line
- Represents changing speed.
- A steeper curve means higher speed.
- The object may be accelerating or decelerating.
Finding Speed from a Distance–Time Graph
- Choose two points on the graph.
- Calculate the change in distance.
- Calculate the change in time.
- Find the gradient using: \( \mathrm{speed = \dfrac{\Delta distance}{\Delta time}} \)
Example
An object moves in a straight line. It travels \( \mathrm{60\ m} \) in \( \mathrm{12\ s} \). Calculate the speed of the object.
▶️ Answer / Explanation
Use: \( \mathrm{speed = \dfrac{distance}{time}} \)
\( \mathrm{speed = \dfrac{60}{12}} \)
\( \mathrm{speed = 5\ m/s} \)
Example
A distance–time graph shows a horizontal line from \( \mathrm{0\ s} \) to \( \mathrm{10\ s} \). Describe the motion of the object.
▶️ Answer / Explanation
The distance does not change as time increases.
This means the object is stationary (at rest).
The speed of the object is \( \mathrm{0\ m/s} \).