Velocity–Time Graphs
A velocity–time graph shows how the velocity of an object changes with time. It is used to describe different types of motion and to calculate both acceleration and distance travelled.
Velocity–time graphs are especially useful when an object is accelerating or decelerating.
Axes of a Velocity–Time Graph
- The horizontal axis (x-axis) shows time (s).
- The vertical axis (y-axis) shows velocity (m/s).
Positive velocity means motion in one direction, while negative velocity means motion in the opposite direction.
Types of Velocity–Time Graphs
1. Horizontal Line
- Represents constant velocity.

- The object is moving at a steady speed.
- Acceleration is zero.

2. Straight Line with Positive Gradient
- Represents uniform acceleration.
- Velocity increases at a constant rate.
3. Straight Line with Negative Gradient
- Represents uniform deceleration.
- Velocity decreases at a constant rate.
4. Curved Line
- Represents non-uniform acceleration.
- Acceleration is changing with time.
Distance Travelled from a Velocity–Time Graph
The distance travelled is given by the area under the velocity–time graph.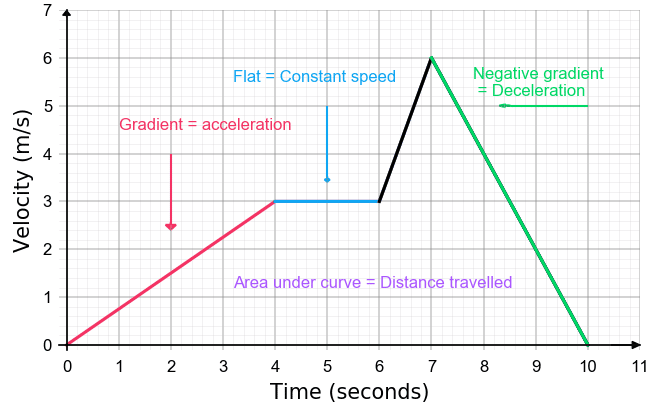
- A rectangle represents constant velocity.
- A triangle represents uniform acceleration from rest.
- More complex shapes can be split into simple shapes.
Key Idea
- The shape of the graph tells you how the object is moving.
- Steeper lines mean faster changes in velocity.
- The area under the graph gives distance travelled.
How to Plot a Velocity–Time Graph
- Record velocity at regular time intervals.
- Plot time on the x-axis and velocity on the y-axis.
- Choose a suitable scale for both axes.
- Join points with straight lines or a smooth curve as appropriate.
Example
An object moves with a constant velocity of \( \mathrm{6\ m/s} \) for \( \mathrm{10\ s} \). Describe the velocity–time graph.
▶️ Answer / Explanation
The graph is a horizontal straight line at \( \mathrm{6\ m/s} \).
This shows constant velocity and zero acceleration.
Example
A car starts from rest and reaches a velocity of \( \mathrm{20\ m/s} \) in \( \mathrm{5\ s} \). Describe the velocity–time graph.
▶️ Answer / Explanation
The graph is a straight line with a positive gradient starting from the origin.
This shows the car is accelerating uniformly.
Acceleration from Velocity–Time Graphs
The acceleration of an object can be determined directly from a velocity–time graph. This is done by calculating the gradient (slope) of the graph.
This method is widely used to analyse motion when velocity changes with time.
Key Relationship
The relationship between acceleration, change in velocity, and time is: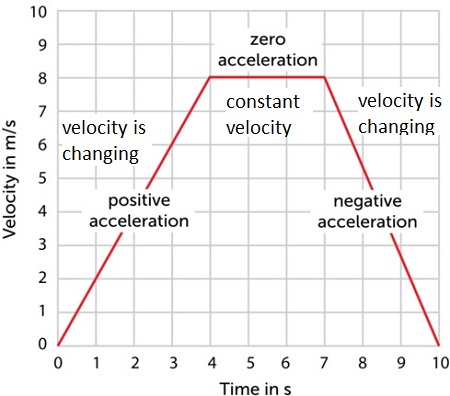
\( \mathrm{acceleration = \dfrac{change\ in\ velocity}{time\ taken}} \)
\( \mathrm{a = \dfrac{v – u}{t}} \)
Acceleration and Gradient
On a velocity–time graph:
- The gradient represents acceleration.
- A steeper gradient means a larger acceleration.
- A horizontal line has zero gradient, so acceleration is zero.
- A negative gradient represents deceleration.
How to Find Acceleration from a Graph
- Choose two clear points on the straight section of the graph.
- Calculate the change in velocity \( \mathrm{(v – u)} \).
- Calculate the change in time \( \mathrm{t} \).
- Divide change in velocity by time to find acceleration.

\( \mathrm{a = \dfrac{\Delta v}{\Delta t}} \)
Units
- Velocity is measured in metres per second (m/s).
- Time is measured in seconds (s).
- Acceleration is measured in metres per second squared (m/s²).
Interpreting Acceleration
- Positive acceleration → object speeds up.
- Negative acceleration → object slows down.
- Zero acceleration → constant velocity.
Acceleration can be constant or changing depending on the shape of the graph.
Important Points to Remember
- Use a straight section of the graph when finding gradient.
- Always include correct units in your answer.
- Read values carefully from the axes.
Example
A velocity–time graph shows that an object’s velocity increases from \( \mathrm{5\ m/s} \) to \( \mathrm{25\ m/s} \) in \( \mathrm{10\ s} \). Calculate the acceleration.
▶️ Answer / Explanation
Use: \( \mathrm{a = \dfrac{v – u}{t}} \)
\( \mathrm{a = \dfrac{25 – 5}{10}} \)
\( \mathrm{a = \dfrac{20}{10} = 2\ m/s^2} \)
Example
A velocity–time graph shows a straight line sloping downwards from \( \mathrm{12\ m/s} \) to \( \mathrm{0\ m/s} \) in \( \mathrm{6\ s} \). Calculate the acceleration.
▶️ Answer / Explanation
Use: \( \mathrm{a = \dfrac{v – u}{t}} \)
\( \mathrm{a = \dfrac{0 – 12}{6}} \)
\( \mathrm{a = -2\ m/s^2} \)
The negative value shows the object is decelerating.