Displaying a Sound Wave Using a Microphone and Oscilloscope
A microphone and an oscilloscope can be used together to display sound waves visually. This allows the properties of sound, such as frequency and amplitude, to be measured and analysed.
Role of the Microphone
A microphone converts sound energy into electrical energy.![]()
![]()
- Sound waves cause air particles to vibrate.
- These vibrations make the microphone diaphragm vibrate.
- The vibrations are converted into a varying electrical signal.
- The signal matches the sound wave pattern.
Key point: Louder sounds produce a larger electrical signal.
Role of the Oscilloscope
An oscilloscope displays electrical signals as a graph on a screen.
- The electrical signal from the microphone is fed into the oscilloscope.

- The oscilloscope displays the signal as a wave trace.
- The horizontal axis represents time.
- The vertical axis represents voltage.

This displayed trace represents the sound wave.
What the Oscilloscope Display Shows
- Amplitude of trace: shows the loudness of the sound.
- Spacing between waves: shows the frequency (pitch).
- Higher trace = louder sound.
- More waves per second = higher pitch.
Relevant Wave Relationship
The frequency of the sound can be calculated from the oscilloscope trace:
\( \mathrm{frequency = \dfrac{1}{time\ period}} \)
\( \mathrm{f = \dfrac{1}{T}} \)
- \( \mathrm{T} \) = time period of one wave (s)
- \( \mathrm{f} \) = frequency (Hz)
How to Use the Equipment (Step-by-Step)
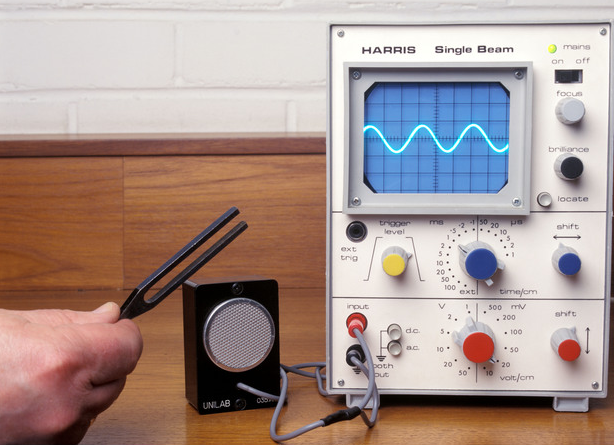
- Connect the microphone to the oscilloscope input.
- Switch on the oscilloscope.
- Adjust the time-base setting.
- Produce a sound near the microphone.
- Observe the wave trace on the screen.
Key Idea
- Microphone converts sound to an electrical signal.
- Oscilloscope displays the signal as a wave.
- The display allows frequency and amplitude to be measured.
Important Points to Remember
- The oscilloscope does not display sound directly.
- It displays voltage variation caused by sound.
- Time-base must be adjusted to see clear waves.
Example
A loud sound is made close to a microphone connected to an oscilloscope.
Describe how the oscilloscope trace changes.
▶️ Answer / Explanation
The amplitude of the trace increases.
This shows the sound is louder.
Example
The oscilloscope trace of a sound wave shows a time period of \( \mathrm{0.005\ s} \).
Calculate the frequency of the sound.
▶️ Answer / Explanation
Use:
\( \mathrm{f = \dfrac{1}{T}} \)
\( \mathrm{f = \dfrac{1}{0.005}} \)
\( \mathrm{f = 200\ Hz} \)