Energy Transfers in Devices and Sankey Diagrams
Many everyday and scientific devices transfer energy from one store to others. These energy transfers can be analysed using the principle of conservation of energy and represented clearly using Sankey diagrams.
Energy Transfer Relationship
The efficiency of a device is given by:
\( \mathrm{efficiency = \dfrac{useful\ energy\ output}{total\ energy\ input}} \)
This relationship is used to explain how much of the input energy is usefully transferred and how much is wasted.
What Is a Sankey Diagram?
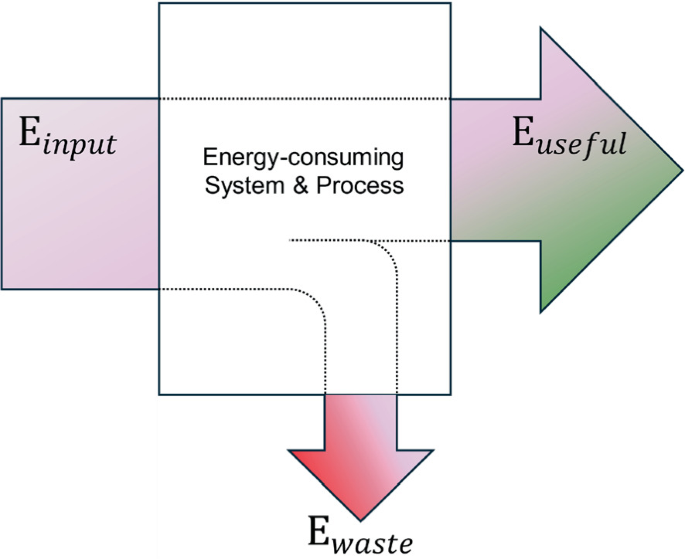
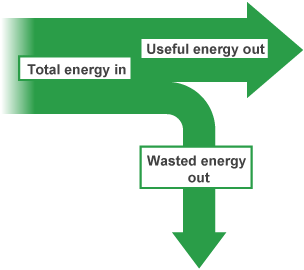
- A Sankey diagram shows energy transfers visually.
- The width of each arrow represents the amount of energy.
- The input energy arrow splits into useful and wasted energy outputs.
- Total input energy = total output energy.
Common Energy Transfers in Devices
1. Filament Lamp
- Input energy: electrical store
- Useful output: light (by radiation)
- Wasted output: thermal energy (by heating)
- Low efficiency because most energy becomes heat
2. Electric Motor
- Input energy: electrical store
- Useful output: kinetic energy (mechanically)
- Wasted output: thermal energy and sound
3. Car Engine
- Input energy: chemical store of fuel
- Useful output: kinetic energy of the car
- Wasted output: thermal energy, sound
4. Kettle
- Input energy: electrical store
- Useful output: thermal energy of water
- Wasted output: thermal energy of surroundings
Using Sankey Diagrams to Explain Efficiency
- A wide useful-energy arrow shows high efficiency.
- A wide wasted-energy arrow shows low efficiency.
- Reducing wasted energy increases efficiency.
Key Idea
- Energy is conserved in all devices.
- Devices differ in how efficiently they transfer energy.
- Sankey diagrams help compare devices visually.
Important Points to Remember
- Always identify input, useful output, and wasted output.
- Thermal energy is usually the main wasted store.
- Arrow widths must be proportional in Sankey diagrams.
Example
An electric motor receives \( \mathrm{1000\ J} \) of electrical energy.
It transfers \( \mathrm{700\ J} \) to useful kinetic energy.
(a) Calculate the efficiency of the motor. (b) Describe the energy transfers and sketch a Sankey diagram.
▶️ Answer / Explanation
(a)
\( \mathrm{efficiency = \dfrac{700}{1000} = 0.70 = 70\%} \)
(b)
Electrical energy is transferred to kinetic energy (useful).
The remaining \( \mathrm{300\ J} \) is transferred to thermal energy and sound.

The Sankey diagram would show a wide forward arrow (700 J) and a smaller downward arrow (300 J).
Example
A filament lamp receives \( \mathrm{200\ J} \) of electrical energy.
Only \( \mathrm{30\ J} \) is transferred as useful light energy.
Explain why the lamp is inefficient and describe the Sankey diagram.
▶️ Answer / Explanation
Most of the energy is transferred to the thermal store as heat.
Only a small fraction becomes useful light.

The Sankey diagram would show a very narrow light-energy arrow and a much wider heat-energy arrow.