
Edexcel iGCSE Physics (4PH1) 1.2 Movement & Position Exam Style Question Paper 1B - New Syllabus
Question
The diagram shows a truck travelling along a horizontal road.
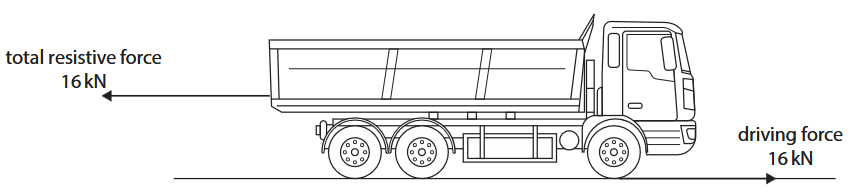
The horizontal forces acting on the truck are shown in the diagram.
(a) Give the resultant horizontal force acting on the truck. (1)
resultant horizontal force = __________________ \(\mathrm{kN}\)
(b) The driver of the truck has to stop because a tree has fallen on the road.
(i) The thinking distance of the driver is \(7\,\mathrm{m}\).
The braking distance of the truck is \(20\,\mathrm{m}\).
Calculate the stopping distance of the truck. (1)
stopping distance = __________________ \(\mathrm{m}\)
(ii) Give two factors that would affect the braking distance of the truck. (2)
1. ________________________________________________________________
2. ________________________________________________________________
(iii) Which of these factors would decrease the driver’s thinking distance? (1)
(B) the truck has old, worn tyres, rather than new tyres
(C) the driver is tired
(D) the truck is travelling at a lower speed
Syllabus Topic Codes (Edexcel International GCSE Physics 4PH1):
• 1.14–1.16: Forces, braking and friction — parts (b)(i) and (b)(ii)
• 1.3–1.4: Motion, speed and stopping distance — part (b)(iii)
▶️ Answer/Explanation
(a) Resultant horizontal force [1 mark]
The driving force is \(16\,\mathrm{kN}\) to the right and the total resistive force is \(16\,\mathrm{kN}\) to the left.
Therefore,
\(F_{\mathrm{resultant}}=16-16=0\,\mathrm{kN}\)
Final Answer: \( \boxed{0\,\mathrm{kN}} \)
(b)(i) Stopping distance [1 mark]
Stopping distance is the sum of the thinking distance and braking distance:
\(\mathrm{stopping\ distance}=\mathrm{thinking\ distance}+\mathrm{braking\ distance}\)
\(=7+20\)
\(=27\,\mathrm{m}\)
Final Answer: \( \boxed{27\,\mathrm{m}} \)
(b)(ii) Factors affecting braking distance [2 marks]
Any two valid factors, for example:
- Speed of the truck
- Mass or weight of the truck
- Condition of the brakes
- Condition of the tyres
- Condition of the road, such as whether it is wet or icy
- Whether the truck is travelling uphill or downhill
- How hard the brake pedal is pressed
Award \(1\) mark for each valid factor, up to \(2\) marks.
(b)(iii) Factor that decreases thinking distance [1 mark]
Correct Answer: \( \boxed{\mathrm{D}} \) the truck is travelling at a lower speed
Thinking distance depends on the speed of the vehicle and the driver’s reaction time. At a lower speed, the truck travels a shorter distance during the driver’s reaction time.
Final Answer: A lower speed decreases the thinking distance.
Question
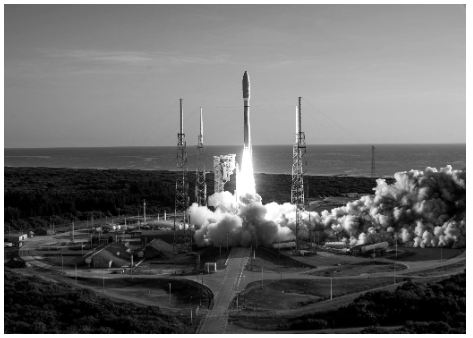
The photograph shows a rocket being launched at Cape Canaveral in the United States of America.
The table gives some information about the motion of the rocket during the first \(5.0\,\mathrm{s}\) of its launch.
| Quantity | Value |
|---|---|
| Initial velocity | \(0.0\,\mathrm{m\,s^{-1}}\) |
| Acceleration | \(13\,\mathrm{m\,s^{-2}}\) |
| Time taken | \(5.0\,\mathrm{s}\) |
(a) Calculate the final velocity of the rocket after \(5.0\,\mathrm{s}\).
Assume that the acceleration remains constant during this time. (3)
final velocity = __________________ \(\mathrm{m\,s^{-1}}\)
(b) Calculate the distance the rocket travels during the \(5.0\,\mathrm{s}\).
Assume that the acceleration remains constant during this time. (3)
distance travelled = __________________ \(\mathrm{m}\)
(c) Sketch a velocity-time graph and a distance-time graph showing how the motion of the rocket changes during the first \(5.0\,\mathrm{s}\) of its launch.
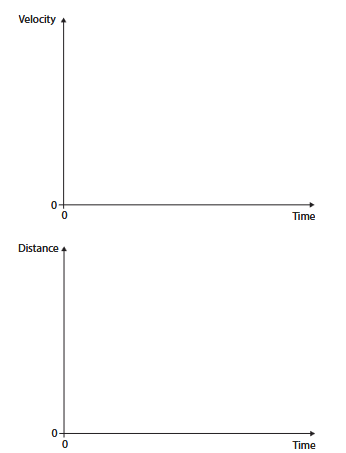
You do not need to include values on the axes. (4)
Syllabus Topic Codes (Edexcel International GCSE Physics 4PH1):
• 1.10: Relationship between final speed, initial speed, acceleration and distance moved — part (b)
• 1.7: Velocity-time graphs — part (c), velocity-time graph
• 1.3: Distance-time graphs — part (c), distance-time graph
▶️ Answer/Explanation
(a) Final velocity [3 marks]
1. Use the acceleration equation:
\(a=\dfrac{v-u}{t}\)
2. Rearrange for final velocity:
\(v=u+at\)
3. Substitute the values:
\(v=0+(13)(5.0)\)
\(v=65\,\mathrm{m\,s^{-1}}\)
Final Answer: \( \boxed{65\,\mathrm{m\,s^{-1}}} \)
(b) Distance travelled [3 marks]
1. Use the equation:
\(v^2=u^2+2as\)
2. Substitute the values:
\(65^2=(0)^2+2(13)s\)
3. Rearrange and calculate:
\(s=\dfrac{65^2}{2(13)}\)
\(s=\dfrac{4225}{26}\)
\(s=162.5\,\mathrm{m}\)
To an appropriate degree of precision:
\(s\approx163\,\mathrm{m}\)
Final Answer: \( \boxed{163\,\mathrm{m}} \)
(c) Motion graphs [4 marks]
Velocity-time graph:
- The graph is a straight line.
- It starts at the origin because the initial velocity is \(0\,\mathrm{m\,s^{-1}}\).
- It has a constant positive gradient because the acceleration is constant and positive.
Distance-time graph:
- The graph starts at the origin because the rocket has travelled \(0\,\mathrm{m}\) at \(t=0\).
- The gradient is positive throughout because the rocket is moving forwards.
- The gradient increases with time because the rocket’s velocity is increasing.
Therefore, the velocity-time graph is a straight rising line, while the distance-time graph is an upward-curving line that becomes progressively steeper.
Final Answer: The velocity-time graph is a straight line from the origin with positive constant gradient. The distance-time graph starts at the origin and curves upward with an increasing gradient.
Question
Ice hockey is a team sport played on ice. Players try to hit a disc called a puck into the other team’s goal.
(a) Diagram 1 shows a puck travelling across some smooth ice.
(i) State the formula linking average speed, distance moved and time taken. (1)
(ii) The puck travels at a constant speed of \(2.8\,\mathrm{m\,s^{-1}}\).
Calculate the distance moved by the puck in a time of \(3.5\,\mathrm{s}\). (3)
distance moved = __________________ \(\mathrm{m}\)
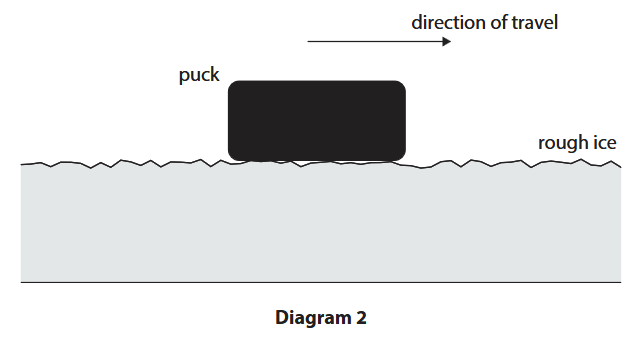
(b) Diagram 2 shows a puck travelling across some rough ice.
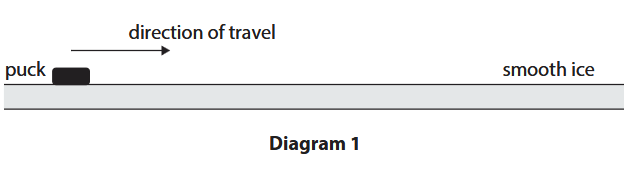
The rough ice exerts a frictional force on the puck.
(i) Draw a labelled arrow on diagram 2 to show the force of friction acting on the puck. (1)
(ii) Explain how the force of friction changes the velocity of the puck. (2)
Syllabus Topic Codes (Edexcel International GCSE Physics 4PH1):
• 1.16: Friction — parts (b)(i) and (b)(ii)
• 1.15: Resultant forces — relevant to the effect of the frictional force on the puck in part (b)(ii)
▶️ Answer/Explanation
(a)(i) Correct Answer: \( \boxed{\mathrm{speed}=\dfrac{\mathrm{distance}}{\mathrm{time}}} \) [1 mark]
Using standard symbols, this can also be written as:
\(v=\dfrac{s}{t}\)
(a)(ii) Distance moved [3 marks]
1. Use the speed equation:
\(v=\dfrac{s}{t}\)
2. Rearrange for distance:
\(s=vt\)
3. Substitute the values:
\(s=(2.8)(3.5)\)
\(s=9.8\,\mathrm{m}\)
Final Answer: \( \boxed{9.8\,\mathrm{m}} \)
(b)(i) Force of friction [1 mark]
- The frictional force acts horizontally to the left, opposite to the direction of travel of the puck.
- The arrow should therefore point from the puck towards the left and should be labelled friction or frictional force.
(b)(ii) Effect of friction on velocity [2 marks]
- The frictional force acts in the opposite direction to the velocity of the puck.
- Therefore, the puck slows down, so its speed and hence its velocity decrease.
The frictional force produces a resultant force opposite to the direction of motion, causing the puck to decelerate.
Final Answer: Friction acts opposite to the puck’s motion, causing the puck to decelerate and its velocity to decrease.
Question
A car travels at a constant speed of \(14\,\mathrm{m\,s^{-1}}\) along a road.
(a) Calculate the distance travelled by the car in a time of \(30\,\mathrm{s}\). (2 marks)
Use the formula
\(\text{distance travelled}=\text{average speed}\times\text{time taken}\)
distance travelled = ____________________
(b) The driver of the car sees an obstacle in the road ahead and applies the brakes.
(i) Which of these is a description of the thinking distance of the car? (1 mark)
(B) distance travelled between seeing the obstacle and applying the brakes
(C) distance travelled between seeing the obstacle and the car coming to a stop
(D) distance travelled as the car slows down
(ii) Which of these factors would increase the braking distance of the car? (1 mark)
(B) driver being tired
(C) worn tyres on the car
(D) a dry road instead of a wet road
(iii) State the only factor that affects both the thinking distance and the braking distance of the car. (1 mark)
____________________________________________________________
Syllabus Topic Codes (Edexcel International GCSE Physics 4PH1):
• 1.19–1.20: Stopping distance and factors affecting thinking distance and braking distance — parts (b)(i), (b)(ii), (b)(iii)
▶️ Answer/Explanation and Mark Scheme
(a) Distance travelled [2 marks]
Use
\(s=vt\)
\(s=14\times30\)
\(s=420\,\mathrm{m}\)
Answer: \( \boxed{420\,\mathrm{m}} \)
(b)(i) Correct Answer: \( \boxed{\mathrm{B}} \) [1 mark]
- The thinking distance is the distance travelled between seeing the obstacle and applying the brakes.
(b)(ii) Correct Answer: \( \boxed{\mathrm{C}} \) [1 mark]
- Worn tyres reduce the friction between the tyres and the road, increasing the braking distance.
(b)(iii) Correct Answer: speed of the car [1 mark]
- The speed of the car affects both thinking distance and braking distance.
Total: \(5\) marks
Question
In 1947, the Railton Mobil Special was the first ground vehicle to achieve a speed of more than 400 miles per hour.

(a) During a test, the vehicle travelled at a speed of 403 miles per hour.
(i) Calculate a speed of 403 miles per hour in metres per second (m/s).
[1 mile = 1600m]
(ii) During the test, the vehicle travelled past two markers. The markers were placed a known distance apart. Describe how these markers could be used to determine the speed of the vehicle.
(b) The diagram shows the vehicle travelling at a constant speed.

One of the horizontal forces acting on the vehicle has been drawn. Complete the diagram by drawing a labelled arrow for the other horizontal force acting on the vehicle.
Syllabus Topic Codes (Edexcel International GCSE Physics 4PH1):
• 1.3: Velocity and acceleration — part (a)(i)
• 1.10: Forces and their effects on motion — part (b)
• 1.12: Resultant forces and equilibrium — part (b)
▶️ Answer/Explanation
Ans
(a) (i) × 1600 seen in working OR ÷ 3600 seen in working;
speed = 179 (m/s);
(ii) idea of measuring time taken (to travel between markers);
use of appropriate instrument to measure time;
use of speed = distance / time;
(b) length of arrow equal to given arrow;
arrow drawn horizontally to the left;
arrow labelled “air resistance”;
Questions
A car accelerates with a constant driving force along a horizontal road and reaches its maximum speed. This is the velocity-time graph for the car’s journey.
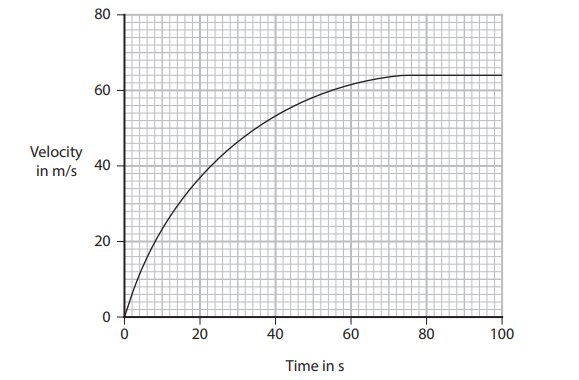
(a) By drawing a tangent to the curve, determine the acceleration of the car at a time of 20s.
(b) Determine the distance travelled by the car during the first 80s of its journey.
(c) Explain the motion of the car after 80s.
Syllabus Topic Codes (Edexcel International GCSE Physics 4PH1):
• 1.3: Velocity-time graphs and determining distance travelled from the area under the graph — part (b)
• 1.3: Interpretation of velocity-time graphs and motion at constant velocity — part (c)
▶️Answer/Explanation
Ans
(a) appropriate attempt to draw tangent at 20s on the graph;
acceleration = gradient;
acceleration in the range 1.00-1.20 \(m/s^2\);
acceleration in the range 1.05-1.15 \(m/s^2\);
(b) distance = area under line;
suitable method used;
distance in the range = 3200-4200 (m);
distance in the range = 3500-4000 (m);
distance in the range = 3700-3800 (m);
(c) speed/velocity is constant;
idea that driving force of car = air resistance;
resultant force is zero;
Questions
The graph shows how the thinking distance and the braking distance vary with the speed of a car.

(a) Which of these does not affect thinking distance?
A alcohol consumed by the driver
B condition of the road
C speed of the car
D tiredness of the driver
(b) Which of these would increase the braking distance of the car?
A faster reaction time of driver
B ice on the road
C more powerful brakes
D tyres with more grip
(c) Determine the stopping distance of the car when the speed of the car is \(20\,\mathrm{m\,s^{-1}}\). (3)
(d)
(i) State the formula linking average speed, distance moved and time taken. (1)
(ii) Determine the reaction time of the driver of the car. (3)
(e) Calculate the mean braking acceleration of the car as it brakes to a stop from an initial speed of \(30\,\mathrm{m\,s^{-1}}\). (4)
Syllabus Topic Codes (Edexcel International GCSE Physics 4PH1):
• 1.4: Speed, Distance and Time Relationship — part (d)(i) and (d)(ii)
• 1.9–1.10: Distance from Velocity-Time Graphs and Motion Equations — part (e)
• 1.6: Acceleration — part (e)
▶️ Answer/Explanation
(a) Factor that does not affect thinking distance [1 mark]
Answer: B, condition of the road.
- Alcohol consumption increases the driver’s reaction time and therefore increases thinking distance.
- The speed of the car affects thinking distance.
- Tiredness increases reaction time and therefore increases thinking distance.
- The condition of the road affects braking distance, rather than thinking distance.
(b) Factor that increases braking distance [1 mark]
Answer: B, ice on the road.
- A faster reaction time decreases thinking distance, not braking distance.
- Ice on the road reduces friction and increases braking distance.
- More powerful brakes reduce braking distance.
- Tyres with more grip increase friction and reduce braking distance.
(c) Stopping distance at \(20\,\mathrm{m\,s^{-1}}\) [3 marks]
Stopping distance is the sum of the thinking distance and braking distance:
\(\mathrm{stopping\ distance}=\mathrm{thinking\ distance}+\mathrm{braking\ distance}\)
From the graph at \(20\,\mathrm{m\,s^{-1}}\):
- Thinking distance \(=10.0\,\mathrm{m}\)
- Braking distance \(=26.5\,\mathrm{m}\)
Therefore:
\(\mathrm{stopping\ distance}=10.0+26.5\)
\(\boxed{\mathrm{stopping\ distance}=36.5\,\mathrm{m}}\)
(d)(i) Average speed formula [1 mark]
\(\boxed{\mathrm{average\ speed}=\dfrac{\mathrm{distance\ moved}}{\mathrm{time\ taken}}}\)
(d)(ii) Reaction time [3 marks]
From the graph, a suitable pair of readings is:
Thinking distance \(=15\,\mathrm{m}\) when speed \(=30\,\mathrm{m\,s^{-1}}\).
Using:
\(\mathrm{speed}=\dfrac{\mathrm{distance}}{\mathrm{time}}\)
Rearranging:
\(\mathrm{time}=\dfrac{\mathrm{distance}}{\mathrm{speed}}\)
\(t=\dfrac{15}{30}\)
\(\boxed{t=0.50\,\mathrm{s}}\)

(e) Mean braking acceleration [4 marks]
From the graph, the braking distance when the initial speed is \(30\,\mathrm{m\,s^{-1}}\) is approximately:
\(s=53\,\mathrm{m}\)
Use the motion equation:
\(v^2=u^2+2as\)
The final speed is \(v=0\,\mathrm{m\,s^{-1}}\), the initial speed is \(u=30\,\mathrm{m\,s^{-1}}\), and \(s=53\,\mathrm{m}\).
Therefore:
\(0^2=30^2+2\times a\times53\)
\(0=900+106a\)
\(a=-\dfrac{900}{106}\)
\(a\approx-8.5\,\mathrm{m\,s^{-2}}\)
\(\boxed{a\approx-8.5\,\mathrm{m\,s^{-2}}}\)
The negative sign shows that the acceleration is opposite to the direction of motion because the car is slowing down.
Questions
A student investigates how the time taken for a ball to roll down a slope changes with the distance from the bottom of the slope. This is the student’s method.
- Place a ball on the slope \(10\,\mathrm{cm}\) from the bottom of the slope.
- Release the ball and start a stopwatch.
- Stop the stopwatch when the ball arrives at the bottom of the slope.
- Record the time taken for the ball to roll down the slope.
- Repeat for different distances from the bottom of the slope.
(a) Complete the table by placing a tick (✓) to show which variables are the independent, dependent and control variables in this investigation.

(b) The table shows the student’s results.

(i) Plot the student’s data on the grid.
(ii) Draw a best fit curve.

(iii) The student concludes that the results obey this relationship
\(\dfrac{\mathrm{distance}}{\mathrm{time}^2}=\mathrm{constant}\)
Use the student’s data to deduce whether the student’s results support this conclusion.
Syllabus Topic Codes (Edexcel International GCSE Physics 4PH1):
• 1.5: Core Practical: Investigating Motion — parts (a) and (b)
• 1.4: Speed, Distance and Time Relationship — part (b)(iii)
▶️ Answer/Explanation
(a) Variables [3 marks]
The variables should be classified according to their roles in the investigation:
- Independent variable: distance from the bottom of the slope.
- Dependent variable: time taken for the ball to reach the bottom.
- Control variable: a variable that is kept constant, such as the same ball and the same slope.
(b)(i) Plotting the data
Plot all the data points accurately using the values given in the table.

(b)(ii) Best fit curve
Draw a smooth curve of best fit through the plotted results. The curve should represent the overall trend rather than simply joining the points with straight-line segments.
(b)(iii) Testing the proposed relationship
The student proposes:
\(\dfrac{s}{t^2}=\mathrm{constant}\)
Calculate \(\dfrac{s}{t^2}\) for one row of the table and then calculate it for another row.
For example:
\(\mathrm{constant}_1=\dfrac{s_1}{t_1^2}\)
\(\mathrm{constant}_2=\dfrac{s_2}{t_2^2}\)
Compare the two calculated values.
If the values are approximately equal, the results support the proposed relationship. If they differ significantly, the results do not support it.
Conclusion: The student’s results support the relationship if the calculated values of \(\dfrac{s}{t^2}\) are approximately constant for different rows of data.
Question
Diagram 1 shows a set of masses attached to a spring, which is suspended from a support.

(a) After the masses are added, the length of the spring is \(14.6\,\mathrm{cm}\). The student measures the extension of the spring as \(11.5\,\mathrm{cm}\).
(i) Calculate the original length of the spring.
(ii) The student removes the masses and notices that the spring does not show elastic behaviour. Predict a value for the new length of the spring after the masses have been removed.
(b) The student puts the masses back on the spring. The student then pulls the masses down and releases them. The masses vibrate up and down in a vertical direction, as shown in diagram 2.

The distance–time graph shows how the distance between the top of the masses and the support changes with time as the masses vibrate.

(i) Explain how the gradient of the graph shows that the masses accelerate as they vibrate.
(ii) Add crosses (X) to the distance–time graph to show all the times when the masses are not moving.
Syllabus Topic Codes (Edexcel International GCSE Physics 4PH1):
• 1.23: Hooke’s law and the initial linear region of a force-extension graph — part (a)(ii)
• 1.24: Elastic behaviour and recovery of original shape after deformation — part (a)(ii)
• 1.3: Plot and explain distance–time graphs — part (b)
• 1.4: Average speed, distance moved and time taken — part (b)(i)
• 1.6: Acceleration, velocity and time taken — part (b)(i)
▶️ Answer/Explanation
(a)(i) Original length of the spring [1 mark]
The extension is the difference between the new length and the original length:
\(\mathrm{extension}=\mathrm{new\ length}-\mathrm{original\ length}\)
Therefore:
\(\mathrm{original\ length}=14.6-11.5\)
\(\boxed{\mathrm{original\ length}=3.1\,\mathrm{cm}}\)
(a)(ii) New length after removing the masses [1 mark]
The spring does not show elastic behaviour, so it does not return to its original length after the masses are removed.
Therefore, the new length must be greater than \(3.1\,\mathrm{cm}\), but it cannot be greater than the stretched length of \(14.6\,\mathrm{cm}\).
Any suitable value in this range is acceptable, for example:
\(\boxed{10.0\,\mathrm{cm}}\)
(b)(i) Gradient and acceleration [3 marks]
The gradient of a distance–time graph represents speed.
The graph has a changing gradient, so the speed of the masses is not constant.
Since the velocity changes with time, the masses are accelerating during their vibration.
Therefore, the changing gradient of the graph provides evidence that the masses are accelerating.
(b)(ii) Times when the masses are not moving [2 marks]
The masses are momentarily stationary when their speed is zero.
On a distance–time graph, speed is the gradient. Therefore, the masses are not moving where the graph has a zero gradient, which occurs at the peaks and troughs.
Place crosses at all three peaks and all three troughs of the graph.