
Edexcel iGCSE Physics (4PH1) 1.2 Movement & Position Exam Style Question Paper 2B - New Syllabus
Question
The photograph shows a car being driven along a straight race track.
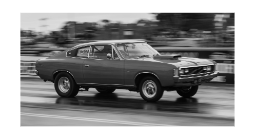
The car starts from rest and accelerates along the straight race track. After crossing the finish line, the driver applies the brakes to bring the car to rest.
The graph shows how the velocity of the car changes with time after the car starts to accelerate.
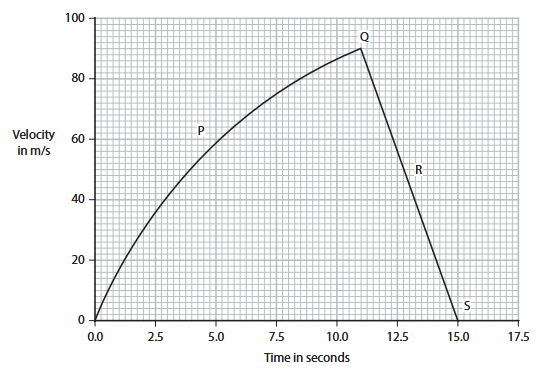
(a) What feature of the graph gives the magnitude of the acceleration of the car? (1 mark)
(B) axes labels
(C) curved section of the line
(D) gradient of the line
(b) At which point on the graph does the driver of the car first apply the brakes? (1 mark)
(B) Q
(C) R
(D) S
(c) Explain why the graph is a curve for the first \(11.0\,\mathrm{s}\). (2 marks)
________________________________________________________________________________________________
________________________________________________________________________________________________
(d) Calculate the distance travelled by the car from \(11.0\,\mathrm{s}\) to \(15.0\,\mathrm{s}\). (3 marks)
distance = ____________________ \(\mathrm{m}\)
Syllabus Topic Codes (Edexcel International GCSE Physics 4PH1):
• 1.6, 1.11–1.12: Acceleration; effects and types of forces — part (c)
• 1.9–1.10: Distance from velocity-time graphs and motion equations — part (d)
▶️ Answer/Explanation and Mark Scheme
(a) Correct Answer: \( \boxed{\mathrm{D}} \) gradient of the line [1 mark]
The gradient of a velocity-time graph gives the acceleration.
(b) Correct Answer: \( \boxed{\mathrm{B}} \) Q [1 mark]
At Q, the car stops accelerating and begins to decelerate as the brakes are applied.
(c) Why the graph is curved [2 marks]
- As the speed increases, air resistance increases.
- The resultant force and therefore the acceleration decrease, causing the gradient of the graph to decrease.
(d) Distance travelled [3 marks]
The distance travelled is the area under the velocity-time graph.
From \(11.0\,\mathrm{s}\) to \(15.0\,\mathrm{s}\), the graph forms a triangle with base \(4.0\,\mathrm{s}\) and height \(90\,\mathrm{m\,s^{-1}}\).
\(\text{distance}=\dfrac{1}{2}\times90\times4.0\)
\(\text{distance}=180\,\mathrm{m}\)
Answer: \( \boxed{180\,\mathrm{m}} \)
Total: \(7\) marks
Questions
The graph shows how the thinking distance and the braking distance vary with the speed of a car.

(a) Which of these does not affect thinking distance?
A alcohol consumed by the driver
B condition of the road
C speed of the car
D tiredness of the driver
(b) Which of these would increase the braking distance of the car?
A faster reaction time of driver
B ice on the road
C more powerful brakes
D tyres with more grip
(c) Determine the stopping distance of the car when the speed of the car is \(20\,\mathrm{m\,s^{-1}}\). (3)
(d)
(i) State the formula linking average speed, distance moved and time taken. (1)
(ii) Determine the reaction time of the driver of the car. (3)
(e) Calculate the mean braking acceleration of the car as it brakes to a stop from an initial speed of \(30\,\mathrm{m\,s^{-1}}\). (4)
Syllabus Topic Codes (Edexcel International GCSE Physics 4PH1):
• 1.4: Speed, Distance and Time Relationship — part (d)(i) and (d)(ii)
• 1.9–1.10: Distance from Velocity-Time Graphs and Motion Equations — part (e)
• 1.6: Acceleration — part (e)
▶️ Answer/Explanation
(a) Factor that does not affect thinking distance [1 mark]
Answer: B, condition of the road.
- Alcohol consumption increases the driver’s reaction time and therefore increases thinking distance.
- The speed of the car affects thinking distance.
- Tiredness increases reaction time and therefore increases thinking distance.
- The condition of the road affects braking distance, rather than thinking distance.
(b) Factor that increases braking distance [1 mark]
Answer: B, ice on the road.
- A faster reaction time decreases thinking distance, not braking distance.
- Ice on the road reduces friction and increases braking distance.
- More powerful brakes reduce braking distance.
- Tyres with more grip increase friction and reduce braking distance.
(c) Stopping distance at \(20\,\mathrm{m\,s^{-1}}\) [3 marks]
Stopping distance is the sum of the thinking distance and braking distance:
\(\mathrm{stopping\ distance}=\mathrm{thinking\ distance}+\mathrm{braking\ distance}\)
From the graph at \(20\,\mathrm{m\,s^{-1}}\):
- Thinking distance \(=10.0\,\mathrm{m}\)
- Braking distance \(=26.5\,\mathrm{m}\)
Therefore:
\(\mathrm{stopping\ distance}=10.0+26.5\)
\(\boxed{\mathrm{stopping\ distance}=36.5\,\mathrm{m}}\)
(d)(i) Average speed formula [1 mark]
\(\boxed{\mathrm{average\ speed}=\dfrac{\mathrm{distance\ moved}}{\mathrm{time\ taken}}}\)
(d)(ii) Reaction time [3 marks]
From the graph, a suitable pair of readings is:
Thinking distance \(=15\,\mathrm{m}\) when speed \(=30\,\mathrm{m\,s^{-1}}\).
Using:
\(\mathrm{speed}=\dfrac{\mathrm{distance}}{\mathrm{time}}\)
Rearranging:
\(\mathrm{time}=\dfrac{\mathrm{distance}}{\mathrm{speed}}\)
\(t=\dfrac{15}{30}\)
\(\boxed{t=0.50\,\mathrm{s}}\)

(e) Mean braking acceleration [4 marks]
From the graph, the braking distance when the initial speed is \(30\,\mathrm{m\,s^{-1}}\) is approximately:
\(s=53\,\mathrm{m}\)
Use the motion equation:
\(v^2=u^2+2as\)
The final speed is \(v=0\,\mathrm{m\,s^{-1}}\), the initial speed is \(u=30\,\mathrm{m\,s^{-1}}\), and \(s=53\,\mathrm{m}\).
Therefore:
\(0^2=30^2+2\times a\times53\)
\(0=900+106a\)
\(a=-\dfrac{900}{106}\)
\(a\approx-8.5\,\mathrm{m\,s^{-2}}\)
\(\boxed{a\approx-8.5\,\mathrm{m\,s^{-2}}}\)
The negative sign shows that the acceleration is opposite to the direction of motion because the car is slowing down.