Practical: Temperature–Time Graph During a Change of State
This practical investigates how the temperature of a substance changes with time when it is heated, and shows that the temperature remains constant during a change of state.
Aim
To obtain a temperature–time graph for a substance and show that the temperature remains constant during a change of state.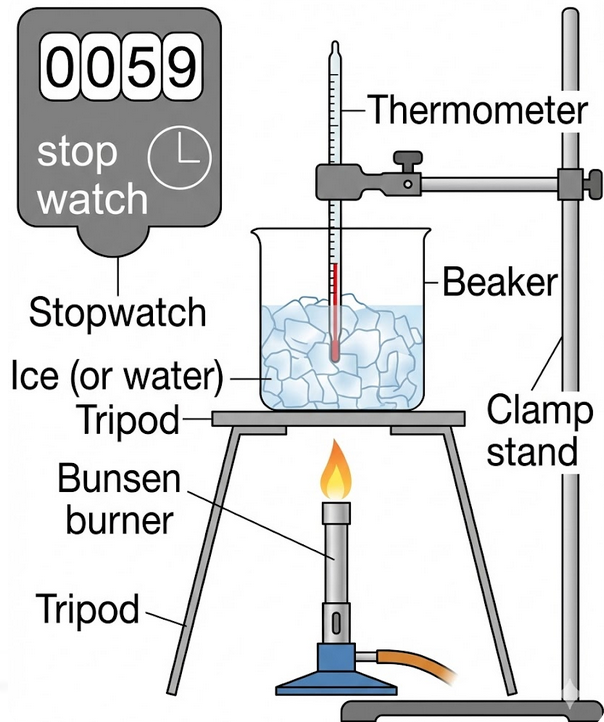
Apparatus
- Ice (or water)
- Beaker
- Thermometer or temperature probe
- Stopwatch
- Heat source (Bunsen burner or hot plate)
- Clamp stand
Method
- Place crushed ice into a beaker.
- Insert the thermometer so it does not touch the sides.
- Start heating the beaker gently.
- Start the stopwatch.
- Record the temperature every 30 seconds.
- Continue heating until all the ice has melted and the temperature begins to rise again.
- Plot a graph of temperature (°C) against time (s).
Variables
- Independent: time
- Dependent: temperature
- Controlled: mass of substance, heating rate, thermometer position
Expected Results
- Temperature increases before melting.
- Temperature stays constant during melting.
- Temperature increases again after melting is complete.
Explanation of the Graph
- Sloping section: temperature increases → kinetic energy increases.
- Flat section: change of state → temperature constant.
- Energy is used to overcome forces between particles.
During the flat section, the kinetic energy remains constant while the potential energy increases.
Conclusion
- Temperature remains constant during a change of state.
- Energy supplied increases internal energy.
- Energy is used to break bonds between particles.
Safety Precautions
- Handle hot equipment carefully.
- Use heat-resistant mats.
- Wear eye protection if using a Bunsen burner.
Sources of Error & Improvements
- Heat loss to surroundings → insulate the beaker.
- Thermometer lag → use a digital temperature probe.
- Uneven heating → stir gently.
Key Idea
- Temperature does not rise during a change of state.
- Energy is used to change particle arrangement.
- This confirms the particle model.
Example
A temperature–time graph shows a flat section while ice is melting.
Explain why the temperature stays constant.
▶️ Answer / Explanation
The energy supplied is used to overcome forces between particles.
The particles gain potential energy, not kinetic energy.
Since kinetic energy does not increase, the temperature stays constant.
Example
Water is heated and boils at 100 °C.
Explain what happens to the energy supplied during boiling.
▶️ Answer / Explanation
The energy is used to separate the particles.
Potential energy increases while kinetic energy stays constant.
This allows the liquid to change into a gas.