Main Components of the Hertzsprung–Russell (HR) Diagram
The Hertzsprung–Russell (HR) diagram is a graph used to classify stars according to their surface temperature (colour) and absolute magnitude (brightness).
Key Statement
Statement: The HR diagram plots absolute magnitude against surface temperature (or colour) to show different groups of stars.
Key idea: A star’s position on the HR diagram shows its temperature, brightness, and stage in its life cycle.
Axes of the HR Diagram
Vertical axis (y-axis): Absolute Magnitude
- Represents true brightness.
- Brighter stars are at the top.
- Dimmer stars are at the bottom.
- Lower (more negative) values mean brighter stars.
Horizontal axis (x-axis): Surface Temperature / Colour
- Temperature decreases from left to right.
- Blue stars on the left.
- Red stars on the right.
Important exam point: The temperature axis runs in the opposite direction to most graphs.
Typical Orientation of the HR Diagram
• Top → very bright stars
• Bottom → dim stars
• Left → hot (blue) stars
• Right → cool (red) stars
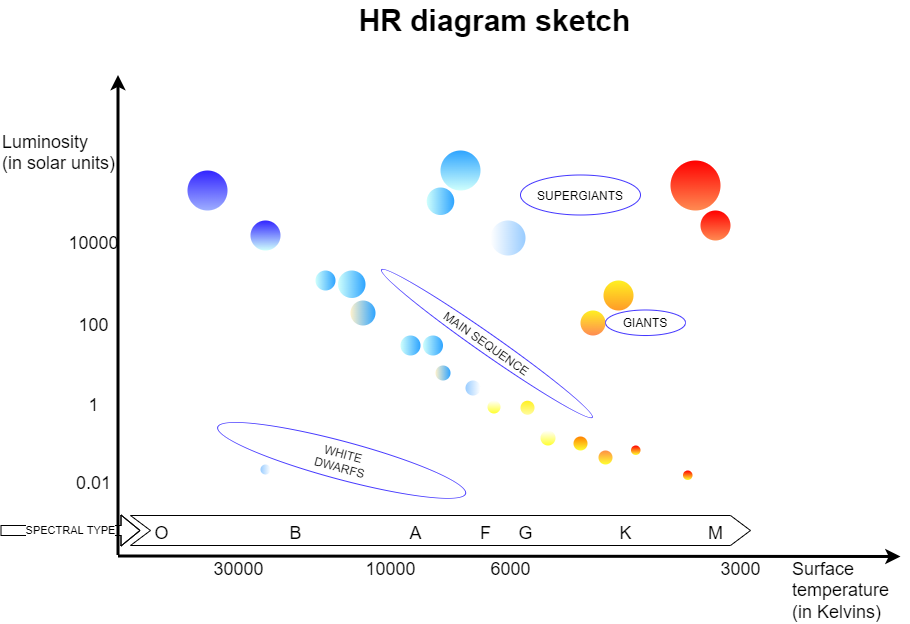
Main Regions of the HR Diagram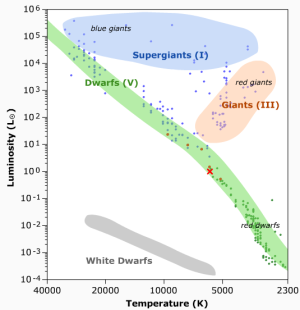
1. Main Sequence
- Diagonal band from top left to bottom right.
- Stars fuse hydrogen into helium.
- The Sun lies on the main sequence.
Key idea: Most stars spend most of their lives here.
2. Red Giants and Red Supergiants
- Located at the top right.
- Cool surface temperature.
- Very bright due to large size.
3. White Dwarfs
- Located at the bottom left.
- Hot surface temperature.
- Dim because they are very small.
Summary of HR Diagram Regions
| Region | Temperature | Brightness | Typical stars |
|---|---|---|---|
| Main sequence | Wide range | Wide range | Sun |
| Red giants | Low | Very high | Large evolved stars |
| White dwarfs | High | Low | Stellar remnants |
How to Draw an HR Diagram in an Exam
- Draw axes and label them clearly.
- Label vertical axis: Absolute magnitude (bright at top).
- Label horizontal axis: Temperature (hot on left).
- Sketch main sequence diagonally.
- Add red giants (top right).
- Add white dwarfs (bottom left).
Exam tip: Always label at least one region.
Example
A star is hot but dim. Use the HR diagram to identify which region the star is most likely found in and explain your reasoning.
▶️ Answer / Explanation
- Hot stars are found on the left of the diagram.
- Dim stars are found near the bottom.
- The bottom-left region corresponds to white dwarfs.
- Therefore the star is likely a white dwarf.
Example
Explain why red giants appear at the top right of the HR diagram.
▶️ Answer / Explanation
- Red giants have low surface temperature.
- Low temperature places them on the right.
- They are very large, so they are very bright.
- High brightness places them at the top.