Edexcel A Level (IAL) Biology -1.15 -1.19 Risk Factors and Data analysis- Study Notes- New Syllabus
Edexcel A Level (IAL) Biology -1.15 -1.19 Risk Factors and Data analysis- Study Notes- New syllabus
Edexcel A Level (IAL) Biology -1.15 -1.19 Risk Factors and Data analysis- Study Notes -Edexcel A level Biology – per latest Syllabus.
Key Concepts:
- 1.15 be able to analyse and interpret quantitative data on illness and mortality rates to determine health risks, including distinguishing between correlation and causation and recognising conflicting evidence
- 1.16 be able to evaluate the design of studies used to determine health risk factors, including sample selection and sample size used to collect data that is both valid and reliable
- 1.17 understand why people’s perception of risks are often different from the actual risks, including underestimating and overestimating the risks due to diet and other lifestyle factors in the development of heart disease
- 1.18 (i) be able to analyse data on the possible significance for health of blood cholesterol levels and levels of high-density lipoproteins (HDLs) and low-density lipoproteins (LDLs)
(ii) know the evidence for a causal relationship between blood cholesterol levels (total cholesterol and LDL cholesterol) and cardiovascular disease (CVD) - 1.19 understand how people use scientific knowledge about the effect of diet, including obesity indicators, such as body mass index and waist-to-hip ratio, exercise and smoking to reduce their risk of coronary heart disease
Analysing Health Data: Illness, Mortality & Health Risks
🌱 Aim
To analyse and interpret quantitative data on illness and mortality to:
- Determine health risks
- Distinguish correlation vs causation
- Recognise conflicting evidence
Step 1: Understanding the Data
- Illness rate: Number of people affected by a disease per population in a given time.
- Mortality rate: Number of deaths per population in a given time.
- Quantitative data may include: age, gender, location, lifestyle factors, or exposure to risks.
Step 2: Analysing Patterns
- Look for trends: increases, decreases, peaks.
- Compare groups: male vs female, urban vs rural, smokers vs non-smokers.
- Identify outliers: unusually high or low values that may indicate data error or special cases.
Step 3: Correlation vs Causation
- Correlation: two variables change together (e.g., ice cream sales ↑ and sunburn cases ↑). Does NOT mean one causes the other.
- Causation: one variable directly causes the change in another (e.g., smoking → lung cancer).
- Tip: Look for biological plausibility and other supporting evidence before claiming causation.
Step 4: Conflicting Evidence
- Data from different studies may disagree due to:
- Sample size differences
- Measurement methods
- Confounding variables (factors that affect both variables)
- Always compare sources and check for bias.
Step 5: Interpreting Health Risks
- High illness/mortality in a group = possible risk factor.
- Consider other factors (diet, genetics, lifestyle, environment).
- Use statistical tools: averages, percentages, graphs, trend lines.
- Present clear conclusions: “X group has higher risk of Y due to Z factor (supported by data).”
🧠 Quick Recap
Illness/mortality rates → show health risks.
Correlation ≠ causation → be careful interpreting data.
Conflicting evidence → check source, sample, methods.
Use numbers to support conclusions.
Evaluating Study Design for Health Risk Factors
🌱 Key Concept
To assess how well a study is designed to determine health risk factors, focusing on:
- Sample selection
- Sample size
- Validity and reliability of data
1. Sample Selection![]()
- Representative sample: Must reflect the population being studied.
Example: studying smoking habits → sample should include all age groups, genders, regions. - Random sampling: Reduces bias; each individual has an equal chance of selection.
- Stratified sampling: Ensures specific groups (age, gender, socioeconomic status) are represented.
- Tip: Poor sample selection → biased results → invalid conclusions.
2. Sample Size
- Larger sample size = more reliable and valid results.
- Small sample size → higher chance of random error, may not reflect the population.
- Balance feasibility vs accuracy: large enough to detect trends, small enough to be practical.
3. Validity of Data
- Internal validity: Study measures what it intends to measure.
Example: measuring effect of diet on heart disease → must accurately record diet and health outcomes. - External validity: Results can be generalised to the wider population.
4. Reliability of Data
- Consistency: Repeating the study under the same conditions should give similar results.
- Standardised methods: Same measurement tools, procedures, and definitions.
- Minimising errors: Training observers, calibrating equipment.
5. Other Considerations
- Control for confounding variables: Other factors that can affect results (e.g., genetics, lifestyle).
- Ethical considerations: Consent, confidentiality, minimal risk.
- Study type matters: Observational vs experimental studies affect reliability of conclusions.
🧠 Quick Recap
Sample Selection: Must be representative; random or stratified
Sample Size: Larger = more reliable; balance feasibility
Validity: Measures what it intends; results generalisable
Reliability: Consistent results; standardised methods
Confounding Factors: Must be controlled to avoid misleading conclusions
Perception vs Actual Risk of Heart Disease
🌱 Key Concept
People’s perception of risks often differs from the actual risks, especially for heart disease. Understanding this helps explain why some lifestyle choices may not match reality.
1. Why Perceptions Differ from Actual Risks
- Underestimating risk: People may think “I eat fast food occasionally, so I’m safe,” but even small, frequent poor dietary habits increase risk.
Healthy-looking individuals may assume they’re at low risk despite genetic predispositions. - Overestimating risk: Headlines about rare cases (e.g., sudden heart attacks) can make people think the risk is higher than it is.
People may avoid certain foods completely, believing any consumption is dangerous. - Influence of lifestyle factors: Smoking, alcohol, inactivity, and poor diet all increase risk, but perception may not match actual statistical risk.
Misconceptions arise due to personal experience, media reports, and social influences.
2. Examples
| Lifestyle Factor | Perceived Risk | Actual Risk |
|---|---|---|
| Occasional fast food | Low | Medium–high (if frequent over time) |
| Smoking 1–2 cigarettes/day | Low | High (even small amounts raise risk) |
| Skipping exercise once a week | High | Moderate (regular inactivity is more important) |
3. Why Accurate Perception Matters
- Informed choices: Correct understanding helps people adopt healthier diets and lifestyles.
- Preventive action: People are more likely to reduce risk factors like high-fat diets, inactivity, or smoking if they know the real risks.
- Public health: Education campaigns can adjust perceptions to reflect actual risks.
🧠 Quick Recap
People underestimate or overestimate risks due to personal bias, media, and social influence.
Actual risk depends on diet, genetics, lifestyle, and environment.
Correct understanding encourages healthier decisions and better heart disease prevention.
Blood Cholesterol, Lipoproteins & Cardiovascular Disease (CVD)
🌱 Key Concepts
Cholesterol levels in the blood are important indicators of heart health. Understanding HDLs, LDLs, and total cholesterol helps assess the risk of CVD.
1. Blood Cholesterol
- Cholesterol: a lipid essential for cell membranes and hormone production.
- Normal range: ~<200 mg/dL total cholesterol in adults.
- Too much cholesterol can lead to plaque formation in arteries → atherosclerosis → heart disease.
2. Lipoproteins
Cholesterol is transported in blood by lipoproteins:
| Type | Role | Health Significance |
|---|---|---|
| HDL (High-Density Lipoprotein) | “Good cholesterol” – carries cholesterol from tissues to liver for disposal | High HDL → protective, lowers CVD risk |
| LDL (Low-Density Lipoprotein) | “Bad cholesterol” – carries cholesterol from liver to tissues | High LDL → increases risk of plaque formation → CVD |
3. Analysing Data on Cholesterol & Health![]()
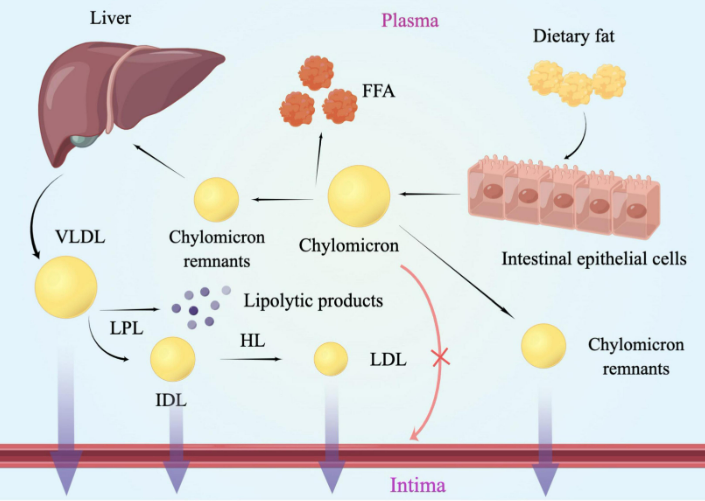
- Compare total cholesterol, LDL, HDL levels with CVD incidence.
- Look for trends: e.g., high LDL + low HDL → higher risk of heart disease.
- Semi-quantitative studies: epidemiological surveys, cohort studies.
4. Evidence for Causal Relationship
- Population studies: Countries/regions with high average LDL cholesterol → higher rates of CVD.
- Intervention studies: Reducing LDL (through diet or drugs) → decreases incidence of heart attacks.
- Genetic evidence: People with familial hypercholesterolemia (high LDL from birth) → very high CVD risk.
Conclusion:
- High LDL and total cholesterol levels are causally linked to CVD.
- High HDL is protective.
🧠 Quick Recap
LDL = bad, HDL = good.
High LDL & total cholesterol → ↑ CVD risk.
Low HDL → ↑ CVD risk.
Reducing LDL or increasing HDL improves heart health.
Reducing Coronary Heart Disease Risk Through Diet, Exercise & Lifestyle
🌱 Key Concept
Coronary heart disease (CHD) risk can be managed using scientific knowledge about diet, obesity, exercise, and smoking. Awareness of obesity indicators helps individuals take preventative measures.
1. Diet & CHD
- Balanced diet reduces risk of high blood cholesterol and obesity.
- Reduce:
- Saturated fats → lower LDL cholesterol
- Salt → control blood pressure
- Sugary foods → prevent obesity
- Increase:
- Fruits, vegetables → provide antioxidants
- Fiber → helps reduce cholesterol absorption
2. Obesity Indicators
Monitoring body fat and weight helps assess CHD risk:
| Indicator | What It Measures | Risk Implication |
|---|---|---|
| BMI (Body Mass Index) | Weight relative to height | BMI > 30 → Obesity → ↑ CHD risk |
| Waist-to-Hip Ratio (WHR) | Fat distribution (waist vs hips) | High WHR → abdominal obesity → ↑ CHD risk |
Note: WHR is better than BMI for assessing visceral fat, which is linked to heart disease.
3. Exercise
- Regular aerobic exercise:
- Increases HDL (“good cholesterol”)
- Lowers LDL and total cholesterol
- Controls body weight and blood pressure
- Recommended: 150 min/week moderate or 75 min/week vigorous exercise.
4. Smoking
- Smoking → damages endothelium of blood vessels → ↑ plaque formation
- Quitting smoking → improves blood pressure, HDL levels, and reduces CHD risk
5. Using Scientific Knowledge
- People can calculate BMI and WHR to monitor obesity
- Track diet and exercise to manage weight and cholesterol
- Understand risk factors (smoking, diet, inactivity) to make lifestyle changes
- Education campaigns use data from epidemiological studies to guide choices
🧠 Quick Recap
Balanced diet + exercise + no smoking → lower CHD risk.
BMI & WHR → key indicators of obesity-related risk.
Scientific knowledge helps people make informed lifestyle decisions.
