Biodiversity & Endemism
🌱 Introduction
Life on Earth exists in an incredible variety of forms from bacteria and fungi to plants and animals. To study and protect this variety, biologists use two key terms: biodiversity and endemism.
🧬 What is Biodiversity?
Definition:
Biodiversity means the variety of all living organisms on Earth at all levels, from genes to ecosystems.
Levels of Biodiversity
| Level | Description | Example |
|---|---|---|
| Genetic diversity | Variation in genes within a species | Different coat colors in dogs |
| Species diversity | Variety of species in a habitat | Coral reefs with fish, corals, sponges |
| Ecosystem diversity | Range of different habitats on Earth | Forests, deserts, wetlands, oceans |
Key idea:
The greater the biodiversity, the more stable and resilient the ecosystem becomes – it can recover faster from changes or damage.
🌍 What is Endemism?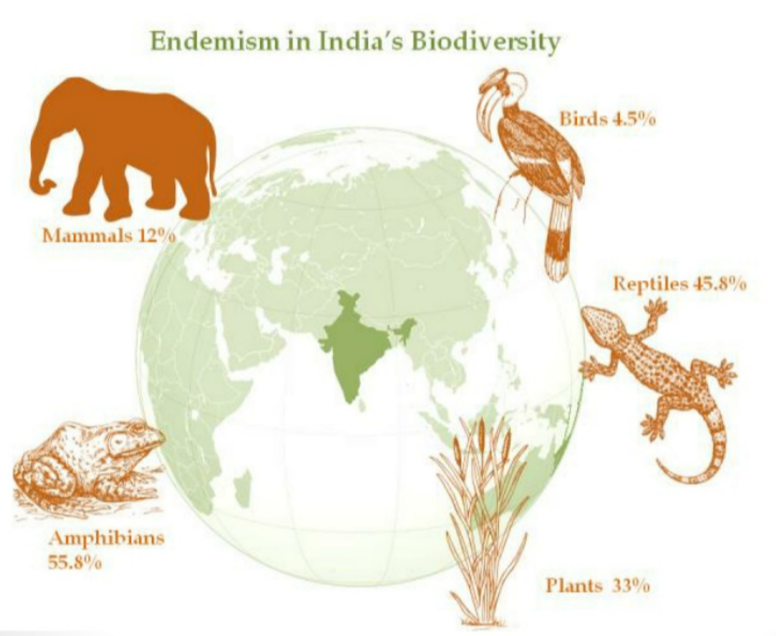
Definition:
Endemism means when a species is found naturally in only one specific geographic location and nowhere else in the world.
Examples of Endemic Species
| Species | Endemic Location | Note |
|---|---|---|
| Lemurs | Madagascar | Evolved in isolation after the island separated |
| Kangaroos | Australia | Adapted to dry grasslands and open habitats |
| Giant Tortoises | Galápagos Islands | Result of long-term island isolation |
| Nilgiri Tahr | Western Ghats (India) | Example of Indian endemism |
Reason for Endemism:
- Isolation (islands, mountains, valleys)
- Unique climate or habitat conditions
- Long evolutionary history without migration
⚠️ Importance of Studying Both
- Biodiversity helps measure the health of ecosystems.
- Endemism helps identify unique and fragile regions (called biodiversity hotspots).
- Many endemic species are highly vulnerable to extinction because they exist in limited areas.
🧩 Summary Table
| Term | Meaning | Example | Importance |
|---|---|---|---|
| Biodiversity | Variety of life at all levels (genes, species, ecosystems) | Amazon rainforest | Indicates ecosystem health |
| Endemism | Species unique to one region | Kangaroo (Australia) | Marks ecological uniqueness, needs protection |
⚡ Quick Recap
Biodiversity = total variety of life on Earth.
It includes genetic, species, and ecosystem diversity.
Endemism = species found only in one specific location.
High biodiversity → stable ecosystem.
Endemic species → often more threatened by habitat loss.