Bacterial Growth Curve and Exponential Growth Rate Constant
🌿 Introduction
When bacteria reproduce in a closed culture (like a flask of broth), their population follows a predictable pattern called the bacterial growth curve. It has four phases: lag, exponential, stationary, and death. Understanding these phases helps in predicting population size, planning experiments and calculating growth rates.
1. Lag Phase
What happens in this phase
- Bacteria are adjusting to the new environment.
- Cells prepare for division by synthesising enzymes, proteins and ATP.
- Very little or no cell division occurs.
Why this phase occurs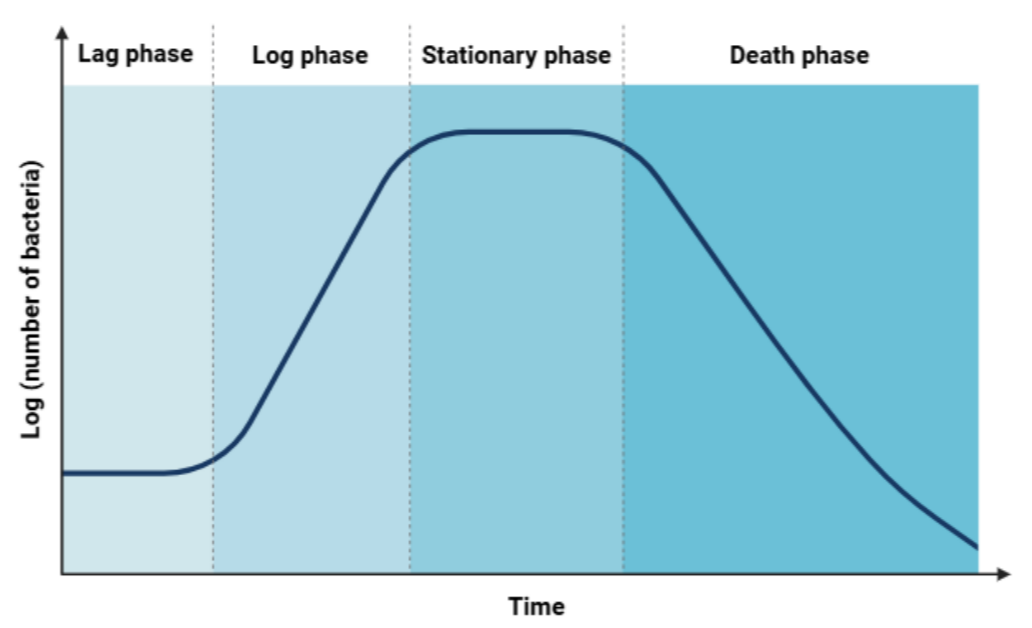
- Cells may be recovering from stress or damage.
- Nutrient composition is new, so enzymes need to be activated.
2. Exponential (Log) Phase
What happens in this phase
- Cells divide at their maximum rate.
- Population increases exponentially (doubling at constant intervals).
- Conditions are ideal: plenty of nutrients, oxygen and space.
Important point
- This is the phase where growth rate constants and generation time are calculated because growth is most predictable.
3. Stationary Phase
What happens in this phase
- Cell division slows and eventually equals cell death rate.
- Population size becomes stable.
- Nutrients begin to run out and waste products build up.
Why it matters
- Many useful metabolites (e.g., antibiotics) are produced in this phase by some microbes.
4. Death (Decline) Phase
What happens in this phase
- Death rate exceeds cell division.
- Nutrient exhaustion and toxic waste accumulation cause population to decrease.
- Cells may undergo lysis.
How to Calculate Exponential Growth Rate Constant (k)
During the exponential phase, bacterial growth follows this pattern:
\( N = N_0 e^{kt} \)
- \( N_0 \) = initial number of cells
- \( N \) = number of cells after time \( t \)
- \( k \) = growth rate constant
- \( t \) = time (usually hours)
Formula for k
\( k = \frac{\ln N – \ln N_0}{t} \)
This tells you how fast the bacteria are growing.
Generation Time (g)
\( g = \frac{\ln 2}{k} \)
Shorter generation time = faster-growing bacteria.
📌Worked Example:
A culture increases from 2 × 10⁶ cells to 3.2 × 10⁷ cells in 4 hours. Find k.
\( k = \frac{\ln(3.2 \times 10^7) – \ln(2 \times 10^6)}{4} \)
\( k = \frac{\ln(16)}{4} \)
\( k = \frac{2.7726}{4} = 0.693\ \text{h}^{-1} \)
(Recognise \( \ln(16) = 2.7726 \))
Generation time:
\( g = \frac{\ln 2}{k} = \frac{0.693}{0.693} = 1\ \text{hour} \)
📋 Summary Table
| Phase | What Happens | Key Reason |
|---|---|---|
| Lag | Cells adjust, no division | Enzymes and proteins being prepared |
| Exponential | Rapid cell division | Ideal conditions |
| Stationary | Birth rate = death rate | Nutrients low, waste ↑ |
| Death | Population falls | Toxicity + starvation |
Quick Recap
Four phases: Lag → Exponential → Stationary → Death.
Exponential phase is used to calculate k and generation time.
Growth formula: \( N = N_0 e^{kt} \).
Growth rate constant: \( k = \frac{\ln N – \ln N_0}{t} \).
Generation time: \( g = \frac{\ln 2}{k} \).