2.17 Periodic Trends and Graphical Representation of Ionisation Energy
The first ionisation energy of elements shows a repeating pattern when plotted against atomic number. This pattern provides strong evidence for the structure of the atom and leads to the concept of periodicity.
You must be able to represent ionisation energy data graphically (including using logarithmic scales) and interpret the trends observed across elements from hydrogen to krypton (atomic numbers 1 to 36).
Graphing First Ionisation Energy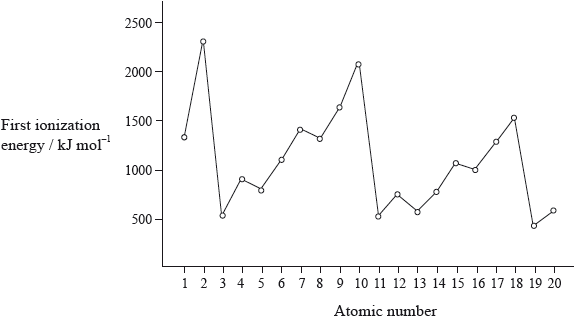
When plotting a graph:
- The x-axis represents atomic number
- The y-axis represents first ionisation energy (often in kJ mol\(^{-1}\))
Because ionisation energy values vary significantly across elements, a logarithmic scale is sometimes used on the y-axis.
Using \( \log(\text{ionisation energy}) \) helps to compress large values and makes trends easier to observe clearly.
This allows periodic patterns to be visualised more effectively.
Observed Trends in the Graph
When first ionisation energy is plotted against atomic number, a repeating pattern emerges:
Ionisation energy increases across a period, then drops sharply at the start of the next period.
This pattern repeats for each period in the Periodic Table.
The increase across a period is due to increasing nuclear charge, while electrons are added to the same shell, so shielding remains similar.
The sharp drop occurs when a new shell begins, meaning the outer electron is further from the nucleus and more shielded.
Irregularities in the Trend
The graph is not perfectly smooth. Small dips occur due to sub-shell structure and electron pairing.
- A drop occurs when electrons start to occupy a higher-energy p sub-shell instead of an s sub-shell.
- Another drop occurs when electrons pair in the same orbital, increasing repulsion.
These irregularities provide further evidence for sub-shells and electron interactions.
Meaning of a Periodic Property
A periodic property is a property that shows a repeating pattern at regular intervals when elements are arranged in order of increasing atomic number.
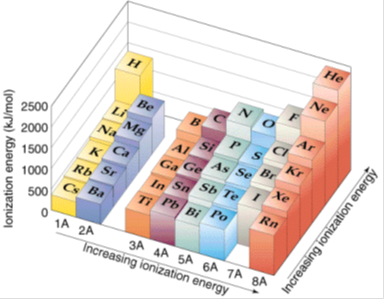
First ionisation energy is a periodic property because its values repeat in a predictable way across each period.
This periodicity arises because the electronic configurations of elements repeat, leading to similar chemical and physical properties.
Key Understanding
- The repeating pattern in ionisation energy reflects the repeating pattern in electronic structure.
- Elements in the same group have similar outer electron configurations and therefore similar ionisation energies.
- The use of logarithmic graphs helps reveal these periodic patterns more clearly across a wide range of values.
Example 1:
Describe the general pattern observed in a graph of first ionisation energy against atomic number for the first 20 elements.
▶️ Answer/Explanation
The graph shows a repeating pattern of increasing ionisation energy across each period.
There are sharp drops at the start of each new period (e.g. from neon to sodium).
There are also small dips within periods due to sub-shell effects and electron pairing.
This repeating pattern demonstrates periodicity.
Example 2:
Explain why a logarithmic scale is sometimes used when plotting ionisation energy data.
▶️ Answer/Explanation
Ionisation energy values vary widely across elements, especially between different shells.
A logarithmic scale compresses large values and spreads out smaller values.
This makes patterns and trends easier to observe clearly.
It helps highlight the periodic nature of the data more effectively.