2.6 Mass Spectrometry
A mass spectrometer is an instrument used to measure the mass-to-charge ratio (\( m/z \)) of ions. It is used to determine isotopic composition, relative atomic mass, and the relative molecular mass of substances.
Basic Principles of a Mass Spectrometer
A mass spectrometer works in four main stages:
1. Ionisation
The sample is bombarded with high-energy electrons, causing atoms or molecules to lose electrons and form positive ions.
\( \mathrm{M(g) \rightarrow M^+(g) + e^-} \)
2. Acceleration
The ions are accelerated by an electric field so that they all have the same kinetic energy.
3. Deflection
The ions pass through a magnetic field and are deflected. The extent of deflection depends on their mass-to-charge ratio (\( m/z \)).
- Lighter ions are deflected more.
- Heavier ions are deflected less.
- Ions with higher charge are deflected more.
4. Detection
The ions hit a detector, producing a signal proportional to their abundance.
Mass Spectrum
A mass spectrum is a graph of relative abundance against \( m/z \).
- Each peak represents an ion.
- The height of the peak shows its abundance.
- The \( m/z \) value shows the mass-to-charge ratio.
(i) Isotopic Composition
Different isotopes appear as separate peaks because they have different masses.
The relative heights of the peaks indicate the relative abundances of the isotopes.
(ii) Relative Atomic Mass
The relative atomic mass (\( A_r \)) is calculated as a weighted mean:
\( A_r = \dfrac{\sum (m \times \text{abundance})}{\sum \text{abundance}} \)
(iii) Relative Molecular Mass
The peak with the highest \( m/z \) value (ignoring small fragment peaks) usually corresponds to the molecular ion.
This gives the relative molecular mass (\( M_r \)) of the compound.
(iv) Ions with 2+ Charge
Some ions may carry a \( 2+ \) charge, meaning they have lost two electrons.
Since \( m/z = \dfrac{\text{mass}}{\text{charge}} \), a \( 2+ \) ion will appear at half its actual mass.
Example: a particle of mass 56 with charge \( 2+ \) appears at \( m/z = 28 \)
Example 1:
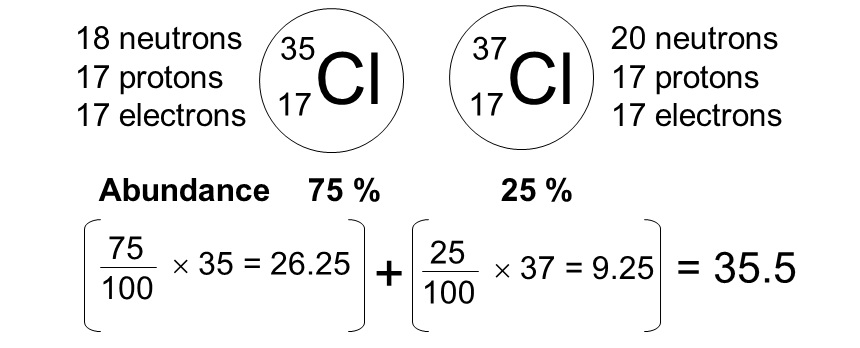
An element has two isotopes with the following data:
Mass = 35, abundance = 75% Mass = 37, abundance = 25%
(a) Calculate the relative atomic mass of the element. (b) Deduce the isotopic composition of the sample.
▶️ Answer/Explanation
(a)
\( A_r = \dfrac{(35 \times 75) + (37 \times 25)}{100} \)
\( A_r = \dfrac{2625 + 925}{100} = 35.5 \)
(b)
The element consists of 75% isotope with mass 35 and 25% isotope with mass 37.
Example 2:
A mass spectrum of a compound shows a molecular ion peak at \( m/z = 44 \) and a smaller peak at \( m/z = 22 \).
(a) Determine the relative molecular mass of the compound. (b) Explain the presence of the peak at \( m/z = 22 \).
▶️ Answer/Explanation
(a)
The molecular ion peak corresponds to the relative molecular mass.
\( M_r = 44 \)
(b)
The peak at \( m/z = 22 \) is half of 44.
This indicates the presence of a \( 2+ \) ion:
\( m/z = \dfrac{44}{2} = 22 \)
Therefore, the peak is due to a doubly charged ion.
2.7 Mass Spectra of Diatomic Molecules
Diatomic molecules contain two atoms bonded together. In mass spectrometry, these molecules produce characteristic patterns depending on the isotopes present and their relative abundances.
A key example is chlorine, which exists naturally as two isotopes: 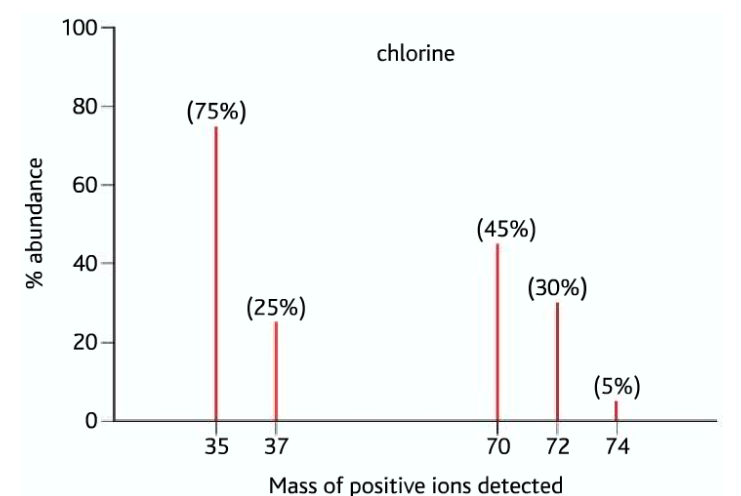
\( ^{35}\mathrm{Cl} \) (about 75%) and \( ^{37}\mathrm{Cl} \) (about 25%)
Possible Molecular Combinations
In a diatomic chlorine molecule (\( \mathrm{Cl_2} \)), the atoms can combine in different ways:
- \( ^{35}\mathrm{Cl} – ^{35}\mathrm{Cl} \) → mass = 70
- \( ^{35}\mathrm{Cl} – ^{37}\mathrm{Cl} \) → mass = 72
- \( ^{37}\mathrm{Cl} – ^{37}\mathrm{Cl} \) → mass = 74
Relative Peak Heights
The relative peak heights depend on probability (based on isotopic abundance).
Using the ratio 75% : 25% (or 3 : 1):
\( (^{35}\mathrm{Cl})^2 : (^{35}\mathrm{Cl})(^{37}\mathrm{Cl}) : (^{37}\mathrm{Cl})^2 \)
\( 3^2 : 2(3 \times 1) : 1^2 \)
\( 9 : 6 : 1 \)
Therefore, the mass spectrum will show three peaks at:
- \( m/z = 70 \) (highest peak)
- \( m/z = 72 \) (medium peak)
- \( m/z = 74 \) (smallest peak)
Key Idea
Relative peak heights are proportional to the probability of each isotopic combination.
This follows a binomial pattern similar to expanding:
\( (a + b)^2 \)
Example 1:
Bromine has two isotopes:
\( ^{79}\mathrm{Br} \) (50%) and \( ^{81}\mathrm{Br} \) (50%)
Predict the \( m/z \) values and relative peak heights for \( \mathrm{Br_2} \).
▶️ Answer/Explanation
Possible combinations:
\( ^{79}\mathrm{Br}-^{79}\mathrm{Br} \) → 158
\( ^{79}\mathrm{Br}-^{81}\mathrm{Br} \) → 160
\( ^{81}\mathrm{Br}-^{81}\mathrm{Br} \) → 162
Relative heights:
\( 1 : 2 : 1 \)
So peaks appear at 158, 160, 162 with equal spacing and symmetric heights.
Example 2:
Chlorine gas has isotopes in the ratio 3 : 1.
A student predicts the peaks at 70, 72, and 74 but suggests equal heights.
Explain why this is incorrect and determine the correct ratio.
▶️ Answer/Explanation
The student is incorrect because the peak heights depend on probability, not just possible combinations.
Using the ratio 3 : 1:
\( 3^2 : 2(3 \times 1) : 1^2 \)
\( 9 : 6 : 1 \)
Therefore:
- 70 → largest peak
- 72 → medium peak
- 74 → smallest peak
The unequal abundances of isotopes lead to unequal peak heights.