6.3 Enthalpy Level Diagrams
Enthalpy level diagrams (energy profile diagrams) are used to represent the energy changes that occur during a chemical reaction. They show the relative energies of reactants and products and the value of \( \Delta H \).
Key Features of Enthalpy Level Diagrams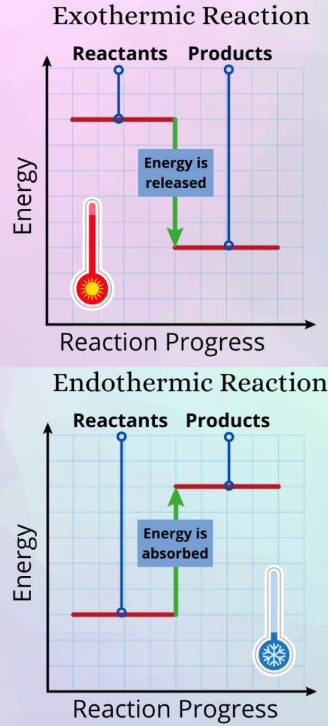
- Y-axis: Enthalpy (kJ mol\(^{-1}\))
- X-axis: Reaction progress
- Horizontal lines represent energy levels of reactants and products
- Vertical arrow shows \( \Delta H \)
Exothermic Reaction Diagram
- Reactants have higher energy than products.
- Energy is released to surroundings.
- \( \Delta H < 0 \) (negative).
Interpretation
- Downward arrow shows decrease in enthalpy.
- The difference represents energy released.
Endothermic Reaction Diagram
- Products have higher energy than reactants.
- Energy is absorbed from surroundings.
- \( \Delta H > 0 \) (positive).
Interpretation
- Upward arrow shows increase in enthalpy.
- The difference represents energy absorbed.
How to Construct an Enthalpy Diagram
- Step 1: Draw axes (enthalpy vs reaction progress).
- Step 2: Draw horizontal line for reactants.
- Step 3: Draw products at higher/lower level depending on reaction type.
- Step 4: Add arrow showing \( \Delta H \).
- Step 5: Label \( \Delta H \) with correct sign.
Key Points for Interpretation
- Position of products relative to reactants determines sign of \( \Delta H \).
- Larger vertical difference → larger energy change.
- Direction of arrow indicates heat flow.
Summary
- Exothermic: products lower, \( \Delta H < 0 \).
- Endothermic: products higher, \( \Delta H > 0 \).
- Diagrams visually represent energy changes.
Therefore, enthalpy level diagrams help in both understanding and predicting energy changes in reactions.
Example 1 :
An enthalpy diagram shows reactants at +50 kJ mol\(^{-1}\) and products at −150 kJ mol\(^{-1}\).
(a) Calculate \( \Delta H \).
(b) State whether the reaction is exothermic or endothermic and explain.
▶️ Answer/Explanation
(a) \( \Delta H = -150 – 50 = -200 \,\mathrm{kJ\,mol^{-1}} \)
(b) Negative \( \Delta H \) → exothermic.
Products are lower in energy than reactants.
Example 2:
Sketch an enthalpy level diagram for the reaction:
\( \mathrm{CaCO_3 \rightarrow CaO + CO_2} \quad \Delta H = +178 \,\mathrm{kJ\,mol^{-1}} \)
Explain the features of your diagram.
▶️ Answer/Explanation
Products drawn higher than reactants.
Upward arrow labelled \( \Delta H = +178 \,\mathrm{kJ\,mol^{-1}} \).
Indicates energy absorbed (endothermic).
Vertical difference represents energy change.