6.8 Evaluation of Enthalpy Experiments
In calorimetry experiments (insulated containers and combustion using spirit burners), it is essential to evaluate results by identifying errors, uncertainties, assumptions, and improving accuracy using techniques such as cooling curve corrections.
1. Sources of Error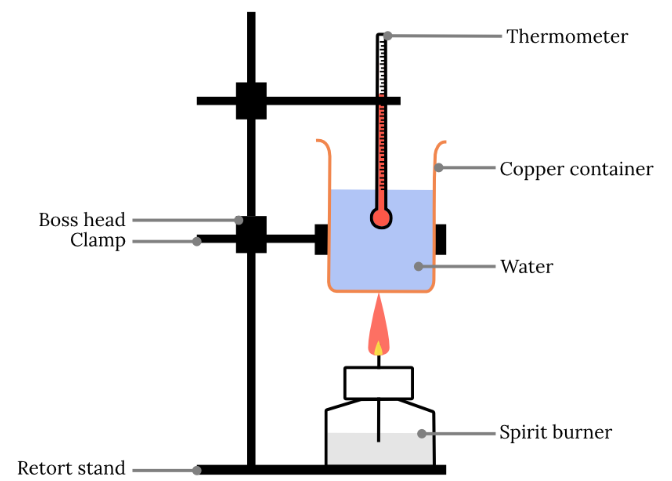
(a) Heat Loss to Surroundings
- Not all heat is transferred to the solution.
- Leads to lower temperature change.
- Causes calculated \( \Delta H \) to be less exothermic than true value.
(b) Incomplete Combustion (Spirit Burner)
- Produces \( \mathrm{CO} \) or carbon instead of \( \mathrm{CO_2} \).
- Less energy released than expected.
(c) Heat Absorbed by Apparatus
- Energy absorbed by calorimeter, thermometer, etc.
- Not included in calculations.
(d) Evaporation of Fuel
- Fuel may evaporate instead of burning.
- Leads to inaccurate mass change.
(e) Measurement Errors
- Temperature reading uncertainty.
- Volume/mass measurement errors.
2. Uncertainty
- Temperature uncertainty (e.g. ±0.1°C).
- Mass uncertainty (balance precision).
- Small ΔT → large percentage uncertainty.
Therefore, larger temperature changes improve reliability.
3. Assumptions Made
- No heat loss to surroundings.
- Density of solution = \( \mathrm{1.00\,g\,cm^{-3}} \).
- Specific heat capacity = \( \mathrm{4.18\,J\,g^{-1}\,°C^{-1}} \).
- Complete combustion (for fuels).
These assumptions introduce systematic errors.
4. Cooling Curve Correction
A cooling curve is used to correct for heat loss during the experiment. 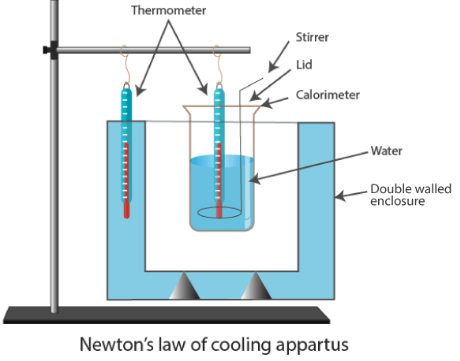
Method
- Record temperature at regular time intervals.
- Plot temperature vs time graph.
- Extrapolate the cooling curve back to the mixing time.
- Use corrected temperature change.
Purpose
- Accounts for heat lost during measurement.
- Gives more accurate ΔT.
5. Graphs Used
- X-axis: Time
- Y-axis: Temperature
- Extrapolation gives true maximum temperature.
6. Improvements
- Use lid on calorimeter.
- Insulate apparatus better.
- Use data logger for continuous measurement.
- Ensure complete combustion (excess oxygen).
Summary
- Errors mainly due to heat loss and incomplete combustion.
- Assumptions simplify calculations but reduce accuracy.
- Cooling curve correction improves results.
Therefore, careful evaluation is essential to obtain reliable enthalpy values.
Example 1 :
A student obtains a value of ΔH that is less exothermic than the literature value. Suggest two reasons and explain.
▶️ Answer/Explanation
Heat loss to surroundings reduces measured ΔT.
Incomplete combustion releases less energy.
Therefore, calculated ΔH is less negative than true value.
Example 2:
Explain how a cooling curve graph is used to obtain a more accurate temperature change.
▶️ Answer/Explanation
Temperature is plotted against time.
Cooling trend is extrapolated back to mixing time.
This gives corrected maximum temperature.
Therefore, heat loss is accounted for and ΔT is more accurate.