9.6 Reaction Profiles for Catalysed and Uncatalysed Reactions
Reaction profiles (energy profile diagrams) show how the energy of a system changes during the course of a reaction.
Reaction Profile
A reaction profile is a graph of energy against reaction progress.
- The y-axis represents energy.
- The x-axis represents the progress of the reaction.
- The curve shows the energy changes as reactants are converted into products.
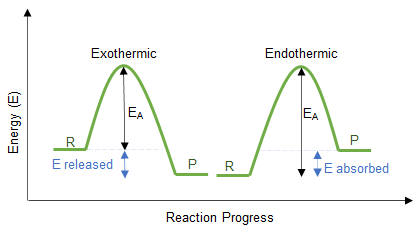
Uncatalysed Reaction Profile
- The curve rises to a single high peak.
- This peak represents the activation energy.
- A large amount of energy is required to reach the transition state.
- After the peak, the energy decreases to form products.
The height of the peak from the reactants represents the activation energy of the uncatalysed reaction.
Catalysed Reaction Profile
- The catalysed pathway has a lower activation energy.
- The curve usually has two smaller peaks instead of one large peak.
- This is because the reaction proceeds in multiple steps.
- An intermediate is formed between the steps.
Intermediate
An intermediate is a species formed during the reaction which is then used up in a later step.
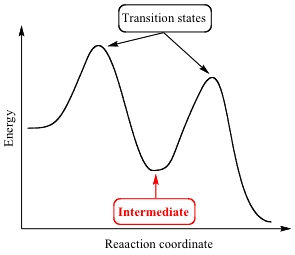
- It appears as a dip between the two peaks on the reaction profile.
- Its energy level lies between the two activation energy peaks.
- It is not present in the overall equation of the reaction.
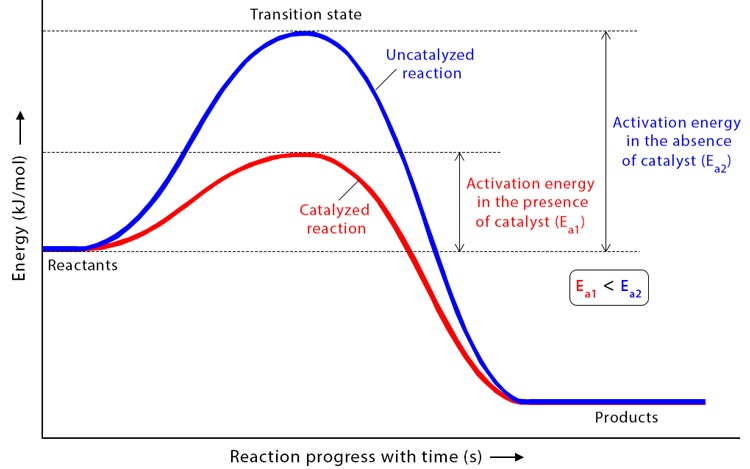
Comparison of Catalysed and Uncatalysed Profiles
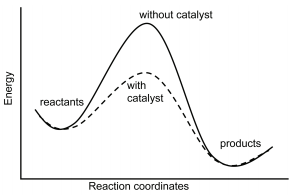
- The catalysed pathway has a lower maximum activation energy.
- The uncatalysed pathway has a higher single peak.
- Both pathways start and end at the same energy levels.
- Therefore, the enthalpy change of the reaction is unchanged.
Key Features to Include in a Diagram
- Label axes: energy and reaction progress.
- Show reactants and products clearly.
- Draw a higher curve for the uncatalysed pathway.
- Draw a lower, two-step curve for the catalysed pathway.
- Indicate activation energies.
- Show the intermediate between the two peaks.
Therefore, catalysts provide a different reaction route involving intermediates and lower activation energy.
Example 1:
Explain how a catalysed reaction profile differs from an uncatalysed reaction profile.
▶️ Answer/Explanation
The catalysed profile has a lower activation energy than the uncatalysed profile.
It often shows two peaks instead of one, indicating multiple steps.
An intermediate is formed between these steps.
The overall energy change remains the same.
Example 2:
What is meant by an intermediate in a catalysed reaction?
▶️ Answer/Explanation
An intermediate is a species formed during one step of a reaction.
It is used up in a subsequent step.
It appears between two peaks on the reaction profile.
It does not appear in the overall equation.