(i) Calculating Half-life from Graphical Data
The half-life (\( t_{1/2} \)) is the time taken for the concentration of a reactant to decrease to half of its initial value and can be determined directly from a concentration–time graph.

- Identify the initial concentration at \( t = 0 \)
- Calculate half of this value
- Locate this concentration on the graph
- Read the corresponding time from the x-axis
- This time interval represents the half-life
- Repeat for successive halvings to check consistency
- If values are not exact, interpolation between points may be required
- Accuracy depends on correct reading of graph scale
Graph Features
- Curve decreases with time (reactant being consumed)
- Gradient becomes less steep over time
- Each halving corresponds to a horizontal time interval
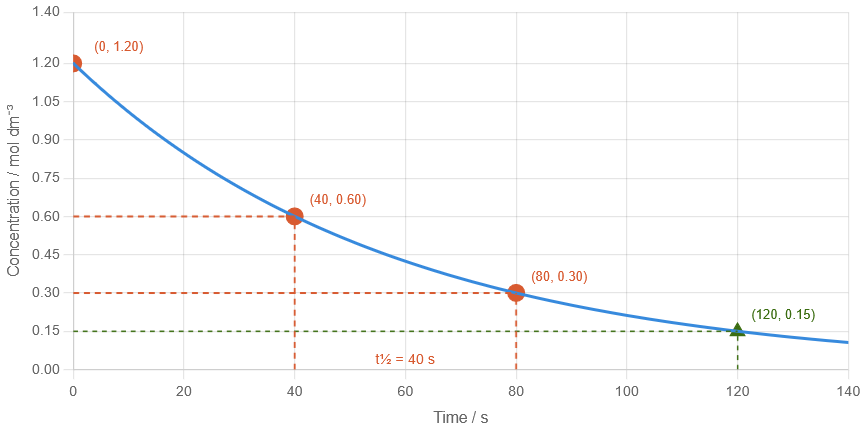
Example 1
A concentration–time graph shows the following data for a reactant:
\( t = 0\ \mathrm{s},\ [A] = 1.20\ mol\ dm^{-3} \) \( t = 40\ \mathrm{s},\ [A] = 0.60\ mol\ dm^{-3} \) \( t = 80\ \mathrm{s},\ [A] = 0.30\ mol\ dm^{-3} \)
(a) Determine the half-life. (b) Estimate the concentration at 120 s.
▶️ Answer/Explanation
(a)
\( \mathrm{1.20 \rightarrow 0.60} \) in 40 s → half-life = 40 s
(b)
Each 40 s → concentration halves
\( \mathrm{1.20 \rightarrow 0.60 \rightarrow 0.30 \rightarrow 0.15} \)
At 120 s → \( \mathrm{0.15\ mol\ dm^{-3}} \)
Example 2
A graph shows that concentration decreases from \( \mathrm{0.90} \) to \( \mathrm{0.45\ mol\ dm^{-3}} \) between 25 s and 55 s.
(a) Determine the half-life. (b) Explain how you would confirm your answer using another point on the graph.
▶️ Answer/Explanation
(a)
Half-life = \( 55 – 25 = 30\ \mathrm{s} \)
(b)
Find another halving (e.g. \( \mathrm{0.45 \rightarrow 0.225} \))
If it also takes 30 s → confirms consistent half-life
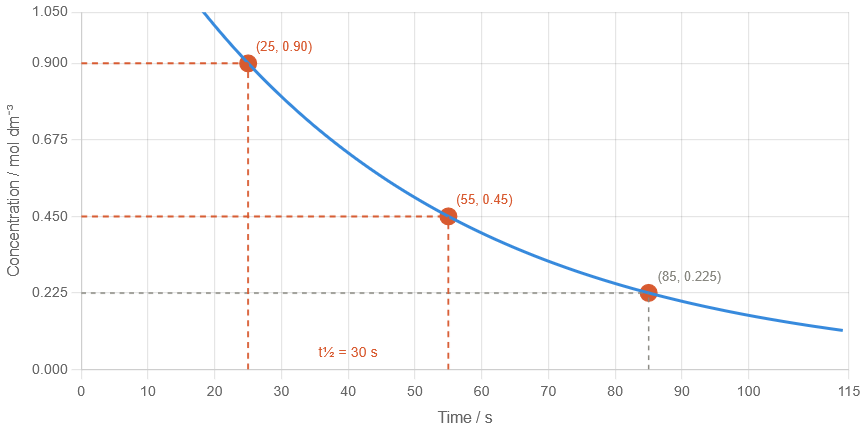
This improves reliability of result from graph data
(ii) Identifying First-Order Reactions using Half-life
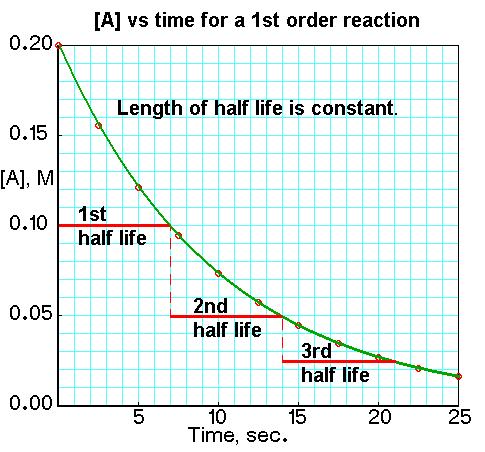
A first-order reaction is identified by a constant half-life, meaning the time taken for the concentration of a reactant to halve remains the same throughout the reaction.
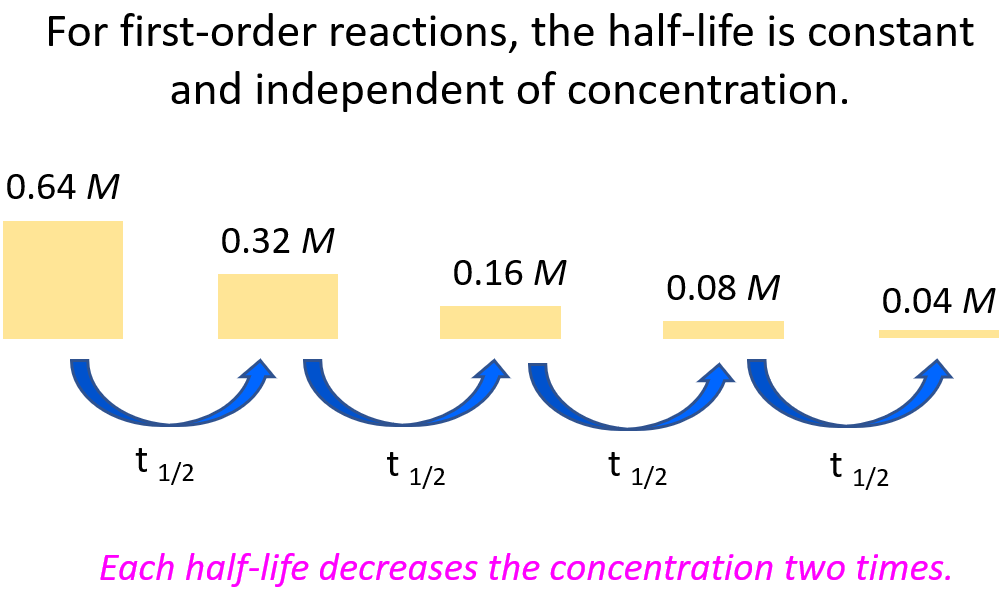
- Equal time intervals for successive halvings of concentration
- Independent of initial concentration
- Characteristic feature of first-order kinetics
- Rate is directly proportional to concentration
- As concentration decreases, rate decreases proportionally
- This results in a constant half-life
How to Identify from Data/Graph
- Determine half-life at different points
- Compare time intervals for each halving
- If constant → first order
- If increasing → not first order (often second order)
Key Insight
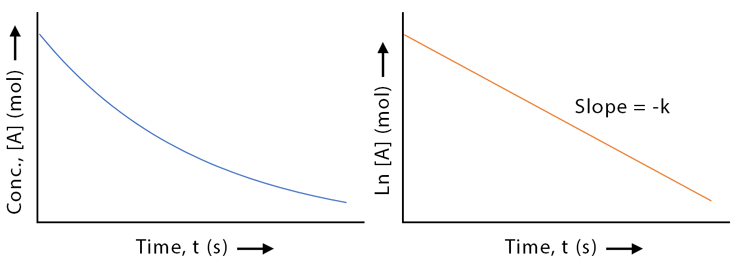
- First-order reactions follow exponential decay
- Plot of \( \ln[A] \) vs time gives a straight line
Example 1
The concentration of a reactant changes as follows:
\( \mathrm{1.00 \rightarrow 0.50} \) in 25 s \( \mathrm{0.50 \rightarrow 0.25} \) in 25 s \( \mathrm{0.25 \rightarrow 0.125} \) in 25 s
(a) Identify the order of the reaction. (b) Calculate the concentration after 100 s. (c) State one additional method to confirm your answer experimentally.
▶️ Answer/Explanation
(a)
Half-life = 25 s (constant)
→ Reaction is first order
(b)
100 s = 4 half-lives
\( \mathrm{1.00 \rightarrow 0.50 \rightarrow 0.25 \rightarrow 0.125 \rightarrow 0.0625} \)
Final concentration = \( \mathrm{0.0625\ mol\ dm^{-3}} \)
(c)
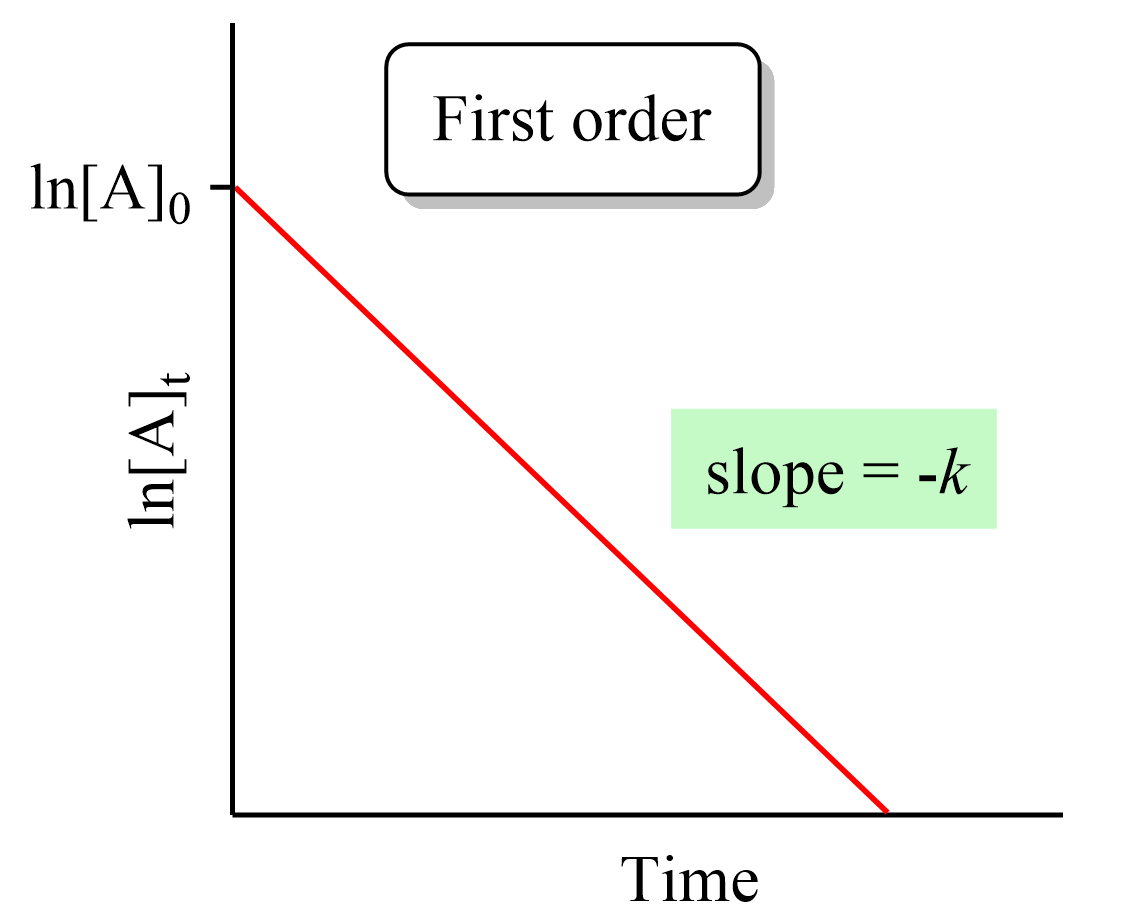
Plot \( \ln[A] \) vs time → straight line confirms first order
Example 2
Two reactions P and Q give the following data:
- P: half-life = 30 s, 30 s, 30 s
- Q: half-life = 20 s, 35 s, 55 s
(a) Identify the order of each reaction. (b) Explain why the half-life changes in reaction Q. (c) Suggest the shape of the concentration–time graph for each.
▶️ Answer/Explanation
(a)
P → constant half-life → first order
Q → increasing half-life → not first order (likely second order)
(b)
In Q, rate depends more strongly on concentration
As concentration decreases, rate decreases more rapidly
Therefore, it takes longer for each halving → increasing half-life
(c)
P: smooth exponential decay curve (first order)
Q: steeper initial drop, then flattens more gradually