Displacement–Time, Velocity–Time and Acceleration–Time Graphs
Graphs are an essential way to represent motion. They show how displacement, velocity and acceleration change with time.
1. Displacement–Time (s–t) Graphs
Meaning: Shows how an object’s position changes over time.
- The gradient (slope) gives the velocity: \( \mathrm{v = \dfrac{ds}{dt}} \)
- Flat (horizontal) line → object is stationary.
- Straight sloping line → constant velocity.
- Curved line → changing velocity → acceleration.
- Steeper line → higher speed.
Typical shapes:

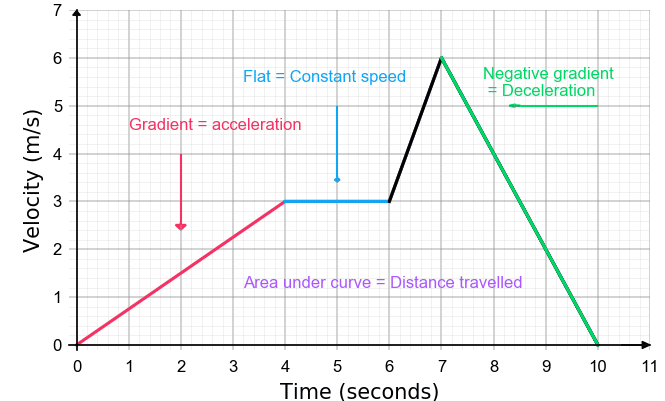
2. Velocity–Time (v–t) Graphs
Meaning: Shows how velocity changes with time.
- The gradient gives acceleration: \( \mathrm{a = \dfrac{dv}{dt}} \)
- Flat horizontal line → constant velocity.
- Positive slope → positive acceleration.
- Negative slope → deceleration.
- The area under the graph gives displacement: \( \mathrm{s = \text{area under } v\text{-}t} \)
Typical shapes:

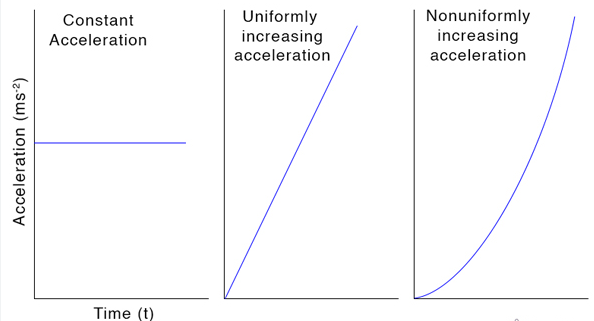
3. Acceleration–Time (a–t) Graphs
Meaning: Shows how acceleration changes with time.
- Flat (horizontal) line → constant acceleration.
- Area under the graph gives change in velocity: \( \mathrm{\Delta v = \text{area under } a\text{-}t} \)
- A value of zero → no acceleration → constant velocity.
Typical shapes:

Example (Easy)
The displacement–time graph of an object shows a straight line with a constant positive slope. What does this indicate about the motion?
▶️ Answer / Explanation
A straight-line s–t graph → constant slope → constant velocity.
The object is moving at a steady speed in one direction.
Example (Medium)
A velocity–time graph shows velocity increasing uniformly from \( \mathrm{2\,m\,s^{-1}} \) to \( \mathrm{10\,m\,s^{-1}} \) in 4 s. Find the acceleration.
▶️ Answer / Explanation
Use the gradient of the v–t graph:
\( \mathrm{a = \dfrac{10 – 2}{4} = 2\,m\,s^{-2}} \)
Example (Hard)
A velocity–time graph forms a triangle with a base of \( \mathrm{6\,s} \) and a height of \( \mathrm{12\,m\,s^{-1}} \). Calculate the total displacement.
▶️ Answer / Explanation
Displacement = area under v–t graph.
Area of triangle:
\( \mathrm{s = \dfrac{1}{2} \times 6 \times 12} \)
\( \mathrm{s = 36\,m} \)
Slopes and Areas of s–t, v–t and a–t Graphs (Including Non-Uniform Acceleration)
Understanding the slopes and areas of motion graphs allows us to determine velocity, acceleration and displacement, even when motion is not uniform.
1. Displacement–Time (s–t) Graphs
Physical quantity from the slope:
- Slope = velocity \( \mathrm{v = \dfrac{ds}{dt}} \)
Interpretation:

- Straight line → constant velocity.
- Curve → velocity changing (acceleration present).
- Steeper slope → higher speed.
- Flat line → object is stationary.
Non-uniform acceleration:
- If the slope increases → object is speeding up.
- If the slope decreases → object is slowing down.
- Velocity at any instant = tangent to the curve.
2. Velocity–Time (v–t) Graphs
Physical quantities from the graph:
- Slope = acceleration \( \mathrm{a = \dfrac{dv}{dt}} \)
- Area under graph = displacement \( \mathrm{s = \int v\,dt} \)
Interpretation:
- Horizontal line → constant velocity.
- Positive slope → positive acceleration.
- Negative slope → deceleration.
- Curved line → changing acceleration (non-uniform acceleration).
Non-uniform acceleration:
- Acceleration at any instant = slope of the tangent.
- Displacement for irregular curves = area under the curve (often split into shapes or integrated).
- If the graph dips below the time axis → negative velocity (motion in opposite direction).
3. Acceleration–Time (a–t) Graphs
Physical quantity from the area:
- Area under a–t graph = change in velocity \( \mathrm{\Delta v = \int a\,dt} \)
Interpretation:
- Horizontal line → constant acceleration.
- Area gives how much velocity increases or decreases.
- Curve above time axis → speeding up.
- Curve below time axis → slowing down (negative acceleration).
Non-uniform acceleration:
- If the graph slopes upward → acceleration is increasing.
- If it slopes downward → acceleration decreasing.
- Velocity = total signed area (positive minus negative areas).
Using the Quantities
- To find velocity from an s–t graph → use slope (straight line or tangent).
- To find acceleration from v–t graph → use slope (straight or tangent).
- To find displacement from v–t graph → calculate the area.
- To find change in velocity from a–t graph → area under the curve.
- For curves (non-uniform motion), break the graph into small segments or use integration.
Example (Easy)
An s–t graph shows a curve that becomes steeper with time. What does this tell you about the velocity?
▶️ Answer / Explanation
A steeper slope means velocity is increasing.
The object is accelerating.
Example (Medium)
A v–t graph forms a straight line increasing from \( \mathrm{3\,m\,s^{-1}} \) at \( \mathrm{t=0} \) to \( \mathrm{11\,m\,s^{-1}} \) at \( \mathrm{t=4\,s} \). Find the acceleration and displacement.
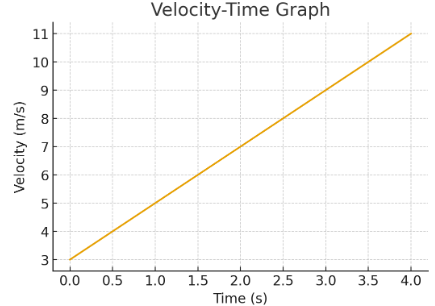
▶️ Answer / Explanation
Acceleration (slope):
\( \mathrm{a = \dfrac{11 – 3}{4} = 2\,m\,s^{-2}} \)
Displacement (area under v–t):
Trapezium area:
\( \mathrm{s = \dfrac{1}{2}(3 + 11)(4)} \)
\( \mathrm{s = 28\,m} \)
Example (Hard)
An a–t graph shows a constant value of \( \mathrm{2\,m\,s^{-2}} \) for 5 s, followed by a constant value of \( \mathrm{-1\,m\,s^{-2}} \) for 4 s.
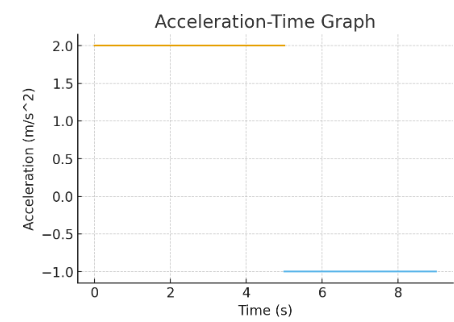
Find the total change in velocity.
▶️ Answer / Explanation
First section:
\( \mathrm{\Delta v_1 = 2 \times 5 = 10\,m\,s^{-1}} \)
Second section:
\( \mathrm{\Delta v_2 = (-1) \times 4 = -4\,m\,s^{-1}} \)
Total change:
\( \mathrm{\Delta v = 10 – 4 = 6\,m\,s^{-1}} \)