I–V Characteristics of Ohmic Conductors, Filament Bulbs, Thermistors and Diodes
The current–potential difference (I–V) graph shows how current through a component changes with applied voltage. Different components have characteristic shapes depending on how their resistance behaves.
Ohmic Conductor (e.g., metal wire at constant temperature)
- Obeys Ohm’s law.
- Current is directly proportional to voltage.
- Resistance remains constant.
Graph Shape: Straight line through the origin.

\( I \propto V \quad \Rightarrow \quad R = \dfrac{V}{I} = \text{constant} \)
Filament Bulb
- As current increases, the filament gets hot.
- Resistance increases with temperature.
- The graph curves — becomes less steep at higher voltages.
Graph Shape: A curve that gets shallower at high voltages (non-linear).

More current → higher temperature → higher resistance → smaller increase in current.
Thermistor (NTC — negative temperature coefficient)
- Resistance decreases as temperature increases.
- When voltage increases, current increases rapidly at first.
- Graph becomes steeper — opposite of filament bulb.
Graph Shape: A curve that gets steeper as voltage increases.
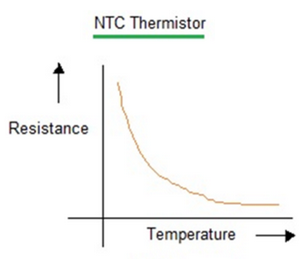
Higher current → higher temperature → lower resistance → even higher current.
Diode
- Conducts only when forward biased.
- Has a “threshold” or “switch-on” voltage (typically about 0.6–0.7 V for silicon).
- In reverse bias, current is almost zero.
Graph Shape:

- Forward bias: almost no current until threshold, then rapid increase.
- Reverse bias: near-zero current (almost flat line).
Shows highly non-ohmic behaviour.
Summary Table
| Component | I–V Graph Shape | Behaviour |
|---|---|---|
| Ohmic Conductor | Straight line through origin | Constant resistance, obeys Ohm’s law |
| Filament Bulb | Curves, slope decreases | Resistance increases with temperature |
| Thermistor (NTC) | Curves, slope increases | Resistance decreases with temperature |
| Diode | Flat until threshold, then steep rise | Conducts only when forward biased |
Example (Easy)
A component has an I–V graph that is a straight line through the origin. What type of component is it?
▶️ Answer / Explanation
An ohmic conductor — because \( I \propto V \).
Example (Medium)
The I–V graph of a component curves and becomes less steep as V increases. What does this tell you about the component?
▶️ Answer / Explanation
- It is a filament bulb.
- Increasing V → more current → higher temperature → higher resistance → slower current increase.
Example (Hard)
A component’s I–V graph shows almost no current until 0.65 V, after which current rises sharply. In reverse bias the current is nearly zero. Identify the component and explain the behaviour.
▶️ Answer / Explanation
It is a diode.
- Forward direction requires a threshold voltage (~0.6–0.7 V) to allow conduction.
- Once this is reached, the current increases rapidly → low resistance.
- In reverse bias the diode blocks current → very high resistance.