Interpreting Transverse, Longitudinal, and Standing Wave Graphs
This topic explains how to draw and interpret wave graphs representing:
- Transverse waves
- Longitudinal waves
- Standing (stationary) waves
Graphs may represent displacement vs. distance or displacement vs. time. Understanding the difference is essential.
Transverse Wave Graphs
For transverse waves, particles oscillate perpendicularly to wave direction. Graphs typically show:
- Displacement vs. distance (x) → shows shape of the wave (crests + troughs).
- Displacement vs. time (t) → shows vibration of a single point.
![]()
Key features from graphs:
- Amplitude = maximum displacement.
- Wavelength \( \lambda \) = distance between crests.
- Period \( T \) = time between successive peaks at one point.
- Frequency \( f = \frac{1}{T} \).
Longitudinal Wave Graphs
Two types of graphs are commonly used:
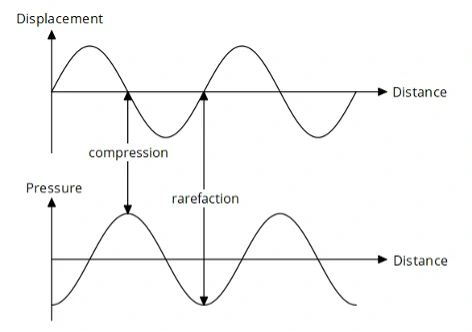
- Displacement vs. distance → molecules oscillating back and forth.
- Pressure vs. distance → compressions and rarefactions.

How to read them:
- High-pressure regions (compressions) → peaks on a pressure graph.
- Low-pressure regions (rarefactions) → troughs.
- Displacement graph shows oscillation around equilibrium.
- Pressure and displacement graphs are 90° out of phase.
Standing (Stationary) Waves
Standing waves form when two waves of equal amplitude and frequency travel in opposite directions and interfere.

Graph features:
- Nodes → points of zero displacement (always stationary).
- Antinodes → points of maximum displacement.
- Distance between adjacent nodes = \( \frac{\lambda}{2} \).
- Energy does not propagate along the wave.
Interpreting standing wave graphs:
- “Snapshot” graphs show the displacement at a moment in time.
- Time evolution graphs show oscillation of nodes and antinodes.
Understanding Common Graph Axes
| Diagram | Description |
|---|---|
Displacement–Distance Graph |
|
Displacement–Time Graph |
|
Pressure–Distance Graph (Longitudinal) |
|


What You Must Be Able to Interpret
- Amplitude from the peak height.
- Wavelength from spacing between repeating patterns.
- Period from time between peaks.
- Frequency from period.
- Wave speed using \( v = f\lambda \).
- Nodes & antinodes on standing waves.
- Compression/rarefaction spacing for longitudinal waves.
Example (Easy)
A displacement–distance graph of a transverse wave shows crests 2 m apart. What is the wavelength?
▶️ Answer / Explanation
Wavelength \( \lambda = 2\,\mathrm{m} \).
Example (Medium)
A longitudinal pressure–distance graph shows compressions every \( 0.75\, \mathrm{m} \). Find the wavelength.
▶️ Answer / Explanation
Compressions repeat every \( \lambda \), so \( \lambda = 0.75\,\mathrm{m} \).
Example (Hard)
A standing wave on a string shows 3 antinodes along a length of \( 1.2\,\mathrm{m} \). Find the wavelength of the wave.
▶️ Answer / Explanation
3 antinodes = \( \frac{3\lambda}{2} \) spans the length.
So:
\( \frac{3\lambda}{2} = 1.2 \)
\( \lambda = \frac{1.2 \times 2}{3} = 0.80\,\mathrm{m} \)