CORE PRACTICAL 15: Investigate the Absorption of Gamma Radiation by Lead
This experiment investigates how the intensity (count rate) of gamma radiation decreases as it passes through increasing thicknesses of lead.
Aim
To investigate how gamma radiation is absorbed by lead and to study the exponential decrease in count rate with thickness.
Theory
Gamma radiation is highly penetrating and is absorbed gradually as it passes through matter.
The corrected count rate follows an exponential relationship:
\( I = I_0 e^{-\mu x} \)
- \( I \) = corrected count rate after absorption
- \( I_0 \) = initial corrected count rate
- \( \mu \) = absorption coefficient of lead
- \( x \) = thickness of lead (m)
Important: Background radiation must be subtracted from all measured counts.
Apparatus
- Gamma radiation source
- Geiger–Müller tube with counter
- Lead sheets of known thickness
- Micrometer screw gauge or ruler
- Clamp stand
- Timer
Method
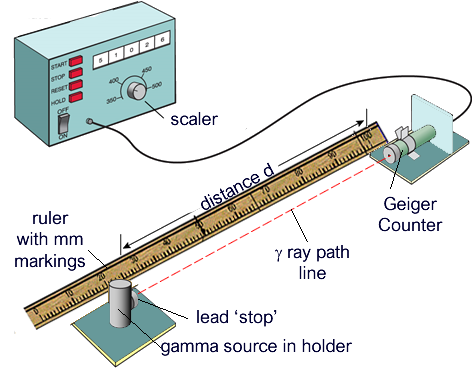
- Set up the GM tube and gamma source at a fixed distance.
- Measure background radiation with no source present.
- Place the source in position and record the count rate with no lead.
- Insert one sheet of lead and record the count rate over a fixed time.
- Increase the lead thickness step by step, recording the count rate each time.
- Keep the geometry and distance constant throughout.
Correcting for Background Radiation
The corrected count rate is calculated using:
\( \text{corrected count rate} = \text{measured count rate} – \text{background count rate} \)
All data analysis must use corrected values.
Analysis
- Plot a graph of corrected count rate \( I \) against lead thickness \( x \).

- The graph shows an exponential decrease.
- Plot \( \ln I \) against \( x \).
- This graph should be a straight line.

The gradient of the straight-line graph is equal to \( -\mu \).
Safety Precautions
- Handle radioactive sources with tongs.
- Keep exposure time as short as possible.
- Store the source in a lead-lined container.
- Never point the source directly at people.
Sources of Error
- Statistical (random) variation in count rate
- Inaccurate measurement of lead thickness
- Changes in background radiation
- Misalignment of source and detector
Improvements
- Use longer counting times to reduce uncertainty
- Repeat readings and calculate averages
- Use thinner lead sheets for more data points
- Ensure accurate alignment of apparatus
Example
Measured count rate = \( 420\ \mathrm{counts\,min^{-1}} \) Background count rate = \( 120\ \mathrm{counts\,min^{-1}} \)
Calculate the corrected count rate.
▶️ Answer / Explanation
\( \text{corrected count rate} = 420 – 120 = 300\ \mathrm{counts\,min^{-1}} \)