Hertzsprung–Russell Diagram: Luminosity and Surface Temperature
The Hertzsprung–Russell (H–R) diagram is a graphical representation that shows how stars are related by their luminosity and surface temperature.
Axes of the H–R Diagram

- The vertical axis shows luminosity (or absolute magnitude).
- Luminosity increases upwards.
- The horizontal axis shows surface temperature (K).
- Temperature decreases from left to right.
Important:
- Hot stars are on the left.
- Cool stars are on the right.
Main Regions of the H–R Diagram
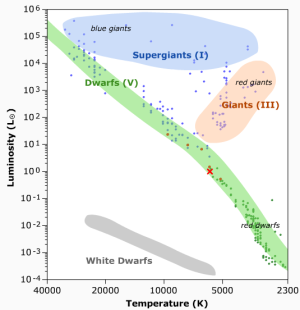
Main Sequence
- Diagonal band from top-left to bottom-right.
- Stars spend most of their lifetime here.
- Includes the Sun.
Giants and Supergiants
- Located above the main sequence.
- High luminosity but relatively low surface temperature.
- Very large radius.
White Dwarfs
- Located below the main sequence.
- Low luminosity but high surface temperature.
- Very small radius.
Interpreting Stellar Properties
- Stars of the same temperature can have different luminosities.
- Higher luminosity at same temperature → larger radius.
- Lower luminosity at same temperature → smaller radius.
This follows from the Stefan–Boltzmann law:
\( L = 4\pi r^2 \sigma T^4 \)
Sketching a Simple H–R Diagram
- Label vertical axis: Luminosity (increasing upwards).
- Label horizontal axis: Surface temperature (decreasing to the right).
- Draw a diagonal main sequence band.
- Label giants above and white dwarfs below.
Exam tip: Always show temperature decreasing left to right.
Stellar Evolution on the H–R Diagram
- Stars begin on the main sequence.
- As fuel runs out, stars move to the giant region.
- Low-mass stars eventually become white dwarfs.
Exam Note
- Do not confuse brightness with luminosity.
- State temperature direction clearly.
- Link position to size and energy output.
- Use terms: main sequence, giant, white dwarf.
Example (Easy)
Where is the Sun located on the H–R diagram?
▶️ Answer / Explanation
The Sun lies on the main sequence, roughly in the middle of the diagram.
Example (Medium)
Two stars have the same surface temperature, but one is much more luminous. What can you say about their radii?
▶️ Answer / Explanation
The more luminous star must have a much larger radius.
Example (Hard)
A star has surface temperature \( 30\,000\,\mathrm{K} \) and very low luminosity. Identify the region of the H–R diagram where it is found.
▶️ Answer / Explanation
The star is a white dwarf: hot but faint, so it lies below the main sequence on the left.