CORE PRACTICAL 14: Investigate the Relationship Between Pressure and Volume of a Gas at Fixed Temperature
This experiment investigates how the pressure of a gas changes with its volume when the temperature is kept constant. This relationship is known as Boyle’s law.
Aim
To investigate the relationship between pressure and volume of a fixed mass of gas at constant temperature.
Theory (Boyle’s Law)
For a fixed mass of gas at constant temperature:
\( pV = \text{constant} \)
This means:
- Pressure is inversely proportional to volume
- As volume decreases, pressure increases
- As volume increases, pressure decreases
In terms of the ideal gas equation:
\( pV = NkT \)
If \( N \) and \( T \) are constant, then \( pV \) is constant.
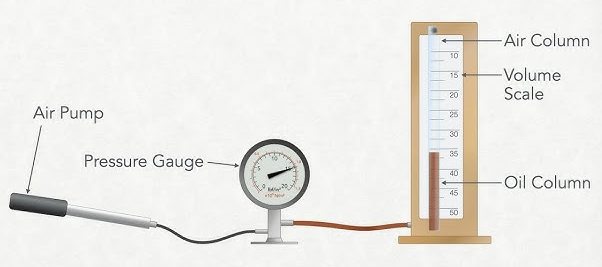
Apparatus
- Gas syringe with scale
- Pressure sensor or pressure gauge
- Data logger or digital display
- Connecting tubing
- Clamp stand
Method
- Connect the gas syringe to the pressure sensor using airtight tubing.
- Set an initial volume of gas in the syringe.
- Record the corresponding pressure.
- Decrease the volume in small steps by pushing the syringe plunger.
- At each volume, record the pressure.
- Wait briefly at each step to ensure temperature remains constant.
- Repeat readings to improve reliability.
Keeping Temperature Constant
- Change the volume slowly.
- Allow time for gas to return to room temperature after compression.
- Avoid rapid compression which increases temperature.
Analysis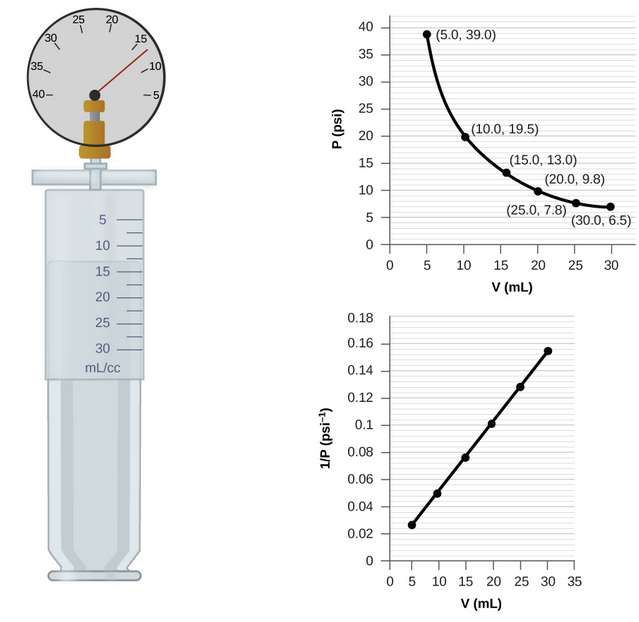
- Plot a graph of pressure \( p \) against volume \( V \).
- The graph will be a curve showing inverse proportionality.
- Plot a graph of pressure \( \dfrac{1}{p} \) against \(V \).
- This graph should be a straight line through the origin.
Conclusion: The experiment confirms that \( p \propto \dfrac{1}{V} \) at constant temperature.
Sources of Error
- Leaks in tubing or syringe
- Temperature changes during compression
- Friction in syringe plunger
- Calibration error in pressure sensor
Improvements
- Use a digital pressure sensor with data logging
- Take readings while increasing and decreasing volume
- Average repeated readings
- Allow longer time between measurements
Example
A gas has pressure \( 1.0\times10^{5}\,\mathrm{Pa} \) at volume \( 40\,\mathrm{cm^3} \). Calculate the pressure when the volume is reduced to \( 20\,\mathrm{cm^3} \) at constant temperature.
▶️ Answer / Explanation
Using \( p_1 V_1 = p_2 V_2 \):
\( (1.0\times10^{5})(40) = p_2 (20) \)
\( p_2 = \dfrac{(1.0\times10^{5})(40)}{20} = 2.0\times10^{5}\,\mathrm{Pa} \)
Pressure doubles when volume halves.