Total Float, Gantt (Cascade) Charts and Scheduling
In project planning, once the critical path and activity timings have been determined, attention turns to float and scheduling. These ideas help managers use time efficiently and present plans clearly.
Total Float
The total float of an activity is the maximum amount of time that the activity can be delayed without delaying the overall completion of the project.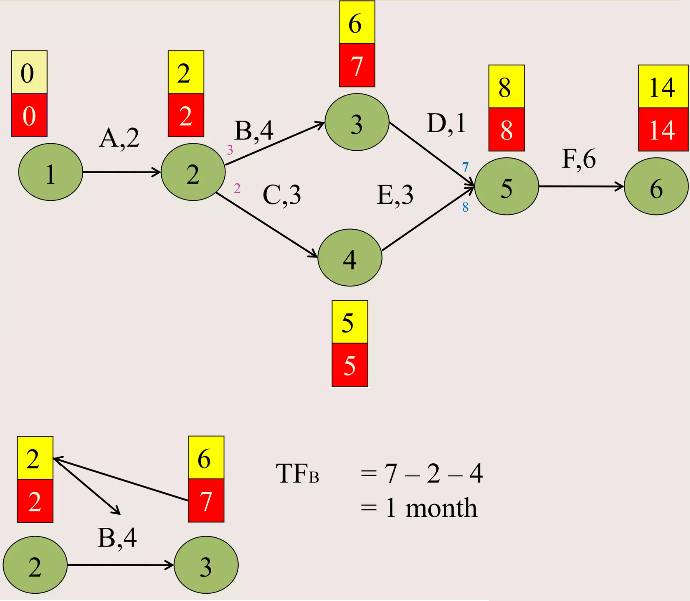
For an activity with:
- Earliest start time = EST
- Latest start time = LST
the total float is:
$\text{Total float = LST − EST}$
Equivalently:
$\text{Total float = LFT − EFT}$
An activity with zero total float lies on the critical path.
Interpretation of Total Float
- Large float → activity has flexibility
- Zero float → any delay delays the project
- Float helps prioritise resources
Gantt (Cascade) Charts
A Gantt chart, also known as a cascade chart, is a graphical representation of a project schedule.
It shows activities plotted against time, making the schedule easy to understand.
Features of a Gantt Chart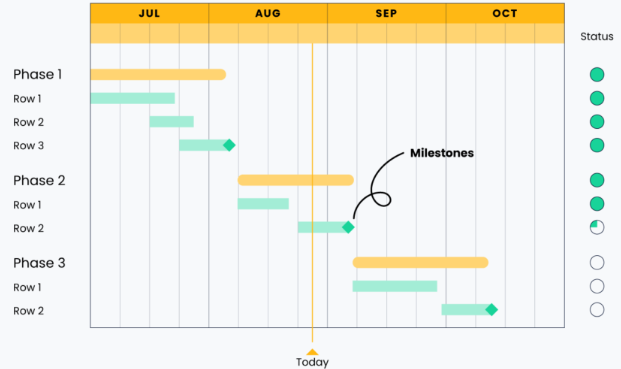
- Horizontal axis represents time
- Each activity is shown as a horizontal bar
- The left end of the bar shows the start time
- The length of the bar represents the duration
Activities on the critical path are often highlighted.
Scheduling Using a Gantt Chart
Once EST and LST values are known, activities can be scheduled:
- At their earliest start times for minimum project duration
- Or delayed within their float to balance workload
Scheduling decisions must respect:
- Precedence constraints (order of activities)
- Total float limits
Advantages of Gantt Charts
- Easy to interpret visually
- Useful for monitoring progress
- Highlights critical activities clearly
Limitations of Gantt Charts
- Do not show dependencies as clearly as networks
- Large projects can become cluttered
Example :
An activity has the following times:
Earliest start time (EST) = 6
Latest start time (LST) = 9
Find the total float and comment on whether the activity is critical.
▶️ Answer/Explanation
Total float is given by:
Total float = LST − EST = 9 − 6 = 3
Since the total float is not zero, the activity is not critical.
Conclusion: The activity may be delayed by up to 3 time units without affecting the project duration.
Example:
A project has the following activities scheduled at their earliest start times:
Activity A: starts at 0, duration 4
Activity B: starts at 4, duration 3
Activity C: starts at 2, duration 5
State the finish times of each activity and identify which activities overlap.
▶️ Answer/Explanation
Finish times:
Activity A: finishes at 4
Activity B: finishes at 7
Activity C: finishes at 7
Activities A and C overlap between time 2 and 4.
Conclusion: A Gantt chart clearly shows overlapping activities and helps manage resource allocation.
Example :
An activity has duration 5, earliest start time 3, and total float 4.
Find the latest start time and explain how this flexibility can be used in scheduling.
▶️ Answer/Explanation
Latest start time:
LST = EST + total float = 3 + 4 = 7
The activity may start at any time between 3 and 7 without delaying the project.
Conclusion: Float allows activities to be rescheduled to reduce clashes and balance workloads.