Transformations of the Graph of \( y = f(x) \)
Transformations change the position or shape of a function’s graph. Given any function \( y = f(x) \), we can shift, stretch, or compress its graph using simple algebraic modifications.
Main Transformations
| Transformation | Effect on Graph |
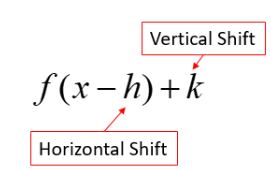
| \( y = f(x) + a \) | Vertical shift Move graph up by \( a \) if \( a > 0 \), down if \( a < 0 \) |
| \( y = f(x + a) \) | Horizontal shift Move graph left by \( a \) units |
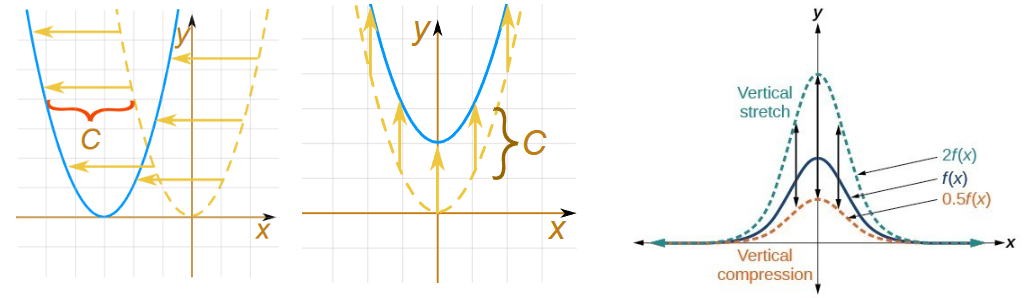
| \( y = af(x) \) | Vertical stretch/compression If \( a > 1 \): stretch If \( 0 < a < 1 \): compression If \( a < 0 \): reflection in x-axis and stretch/compress |
| \( y = f(ax) \) | Horizontal stretch/compression If \( a > 1 \): horizontal compression by factor \( a \) If \( 0 < a < 1 \): horizontal stretch If \( a < 0 \): reflection in y-axis + stretch/compress |
Important Notes
- Changes inside the brackets affect the graph horizontally.
- Changes outside the brackets affect the graph vertically.
- A negative sign produces reflection:
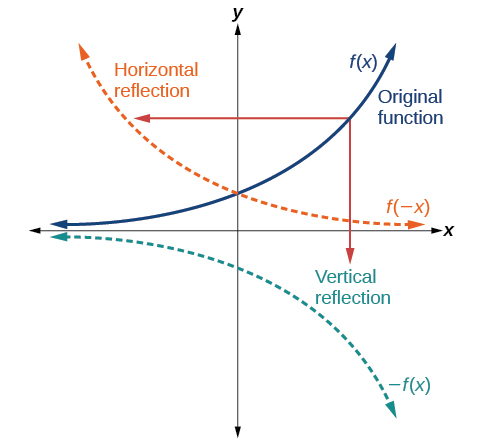
Reflection in x-axis: \( y = -f(x) \)
Reflection in y-axis: \( y = f(-x) \)
Example
Given the graph of \( y = x^2 \), sketch the graph of \( y = x^2 + 3 \).
▶️ Answer / Explanation
This is a vertical shift upward by 3 units.
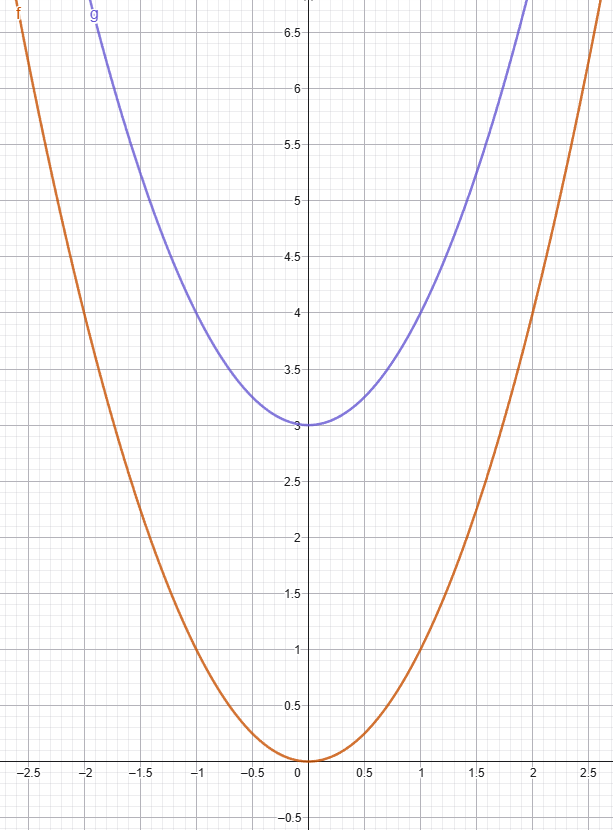
- The shape of the parabola does not change.
- Vertex moves from \( (0,0) \) to \( (0,3) \).
- Axis of symmetry remains \( x = 0 \).
Example
Given the graph of \( y = \dfrac{1}{x} \), sketch the graph of \( y = \dfrac{1}{2x} \).
▶️ Answer / Explanation
This is a transformation of the form \( y = f(ax) \) with \( a = 2 \).
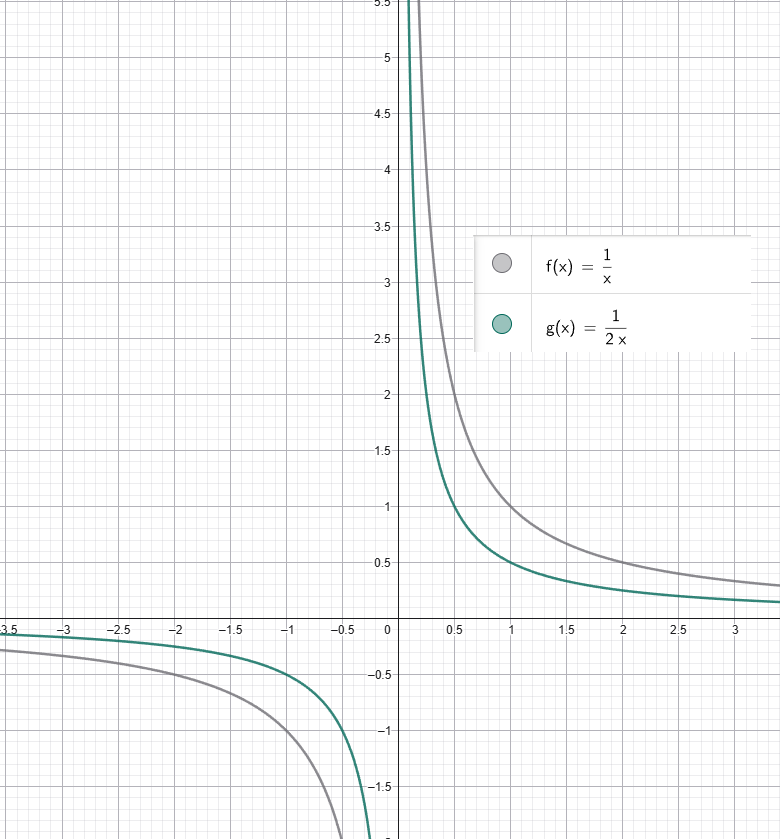
Effect:
- Horizontal compression by factor 2.
- Vertical shape remains the same (reciprocal curve).
- Asymptotes remain at \( x = 0 \) and \( y = 0 \).
- Graph becomes steeper near the origin.
Example
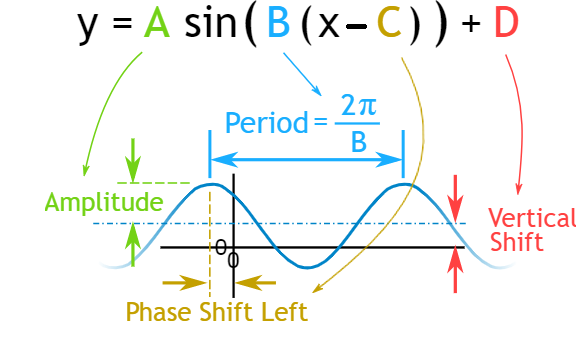
The graph of \( y = \sin x \) is transformed to \( y = 3\sin(x – \dfrac{\pi}{4}) \). Describe the full transformation and sketch the resulting graph.
▶️ Answer / Explanation
Step-by-step transformations:
- \( y = \sin(x – \dfrac{\pi}{4}) \) Shifts graph right by \( \dfrac{\pi}{4} \)
- \( y = 3\sin(x – \dfrac{\pi}{4}) \) Vertical stretch by factor 3 → amplitude becomes 3
Resulting graph features:
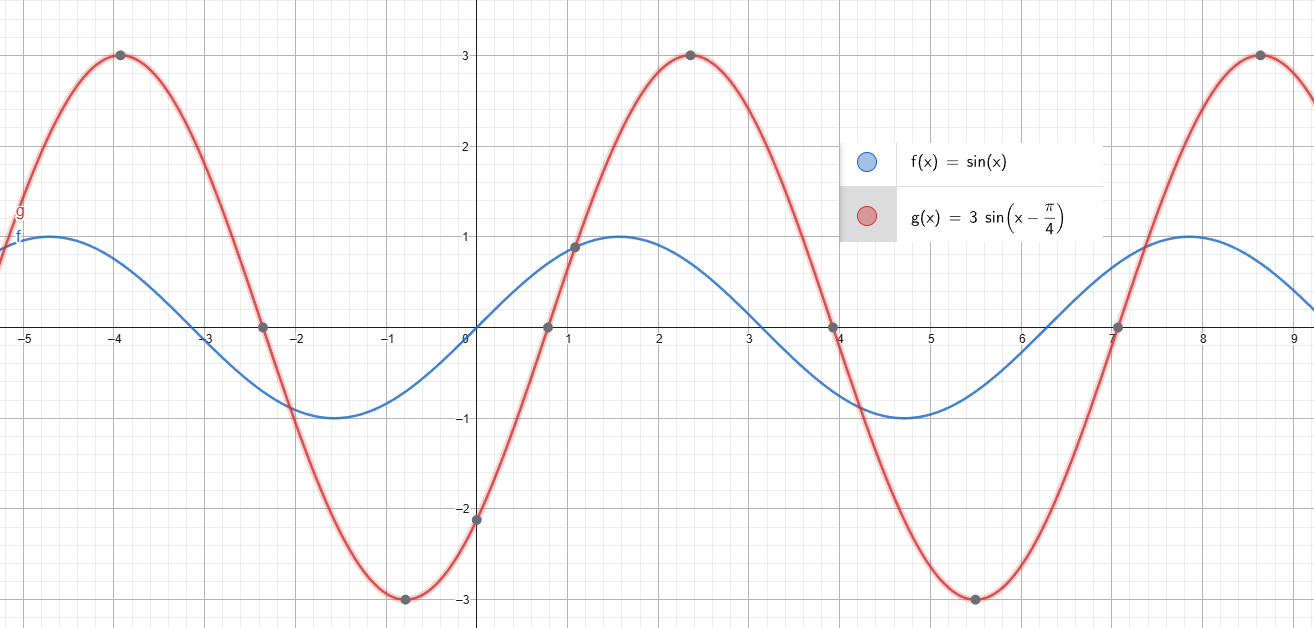
- Period unchanged: \( 2\pi \)
- Amplitude = 3
- Maximum at \( x = \dfrac{\pi}{4} + \dfrac{\pi}{2} = \dfrac{3\pi}{4} \)
- Graph oscillates between −3 and 3