Representing Linear and Quadratic Inequalities Graphically
Graphical representation of inequalities involves drawing the boundary curve (a straight line or parabola) and shading the region that satisfies the inequality. The boundary may or may not be included depending on the inequality symbol.
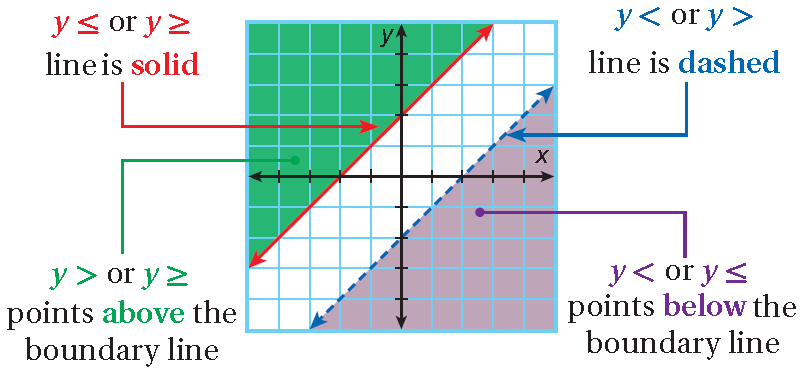
Line and Curve Convention
| Symbol | Boundary Line / Curve | Region Shaded |
| \( y > f(x) \) | Dotted line or curve | Above the graph of \( y = f(x) \) |
| \( y \ge f(x) \) | Solid line or curve | Above or on the graph |
| \( y < f(x) \) | Dotted line or curve | Below the graph of \( y = f(x) \) |
| \( y \le f(x) \) | Solid line or curve | Below or on the graph |
Linear Inequalities Graphically
For inequalities such as:
\( y > x + r,\quad y < ax + b,\quad y \ge 2 – 3x \)
- The boundary is the line \( y = x + r \).
- Use a dotted line for strict inequalities (\( > \), \( < \)).
- Use a solid line for non-strict inequalities (\( \ge \), \( \le \)).
- Shade above for \( y > \) or \( y \ge \); shade below for \( y < \) or \( y \le \).
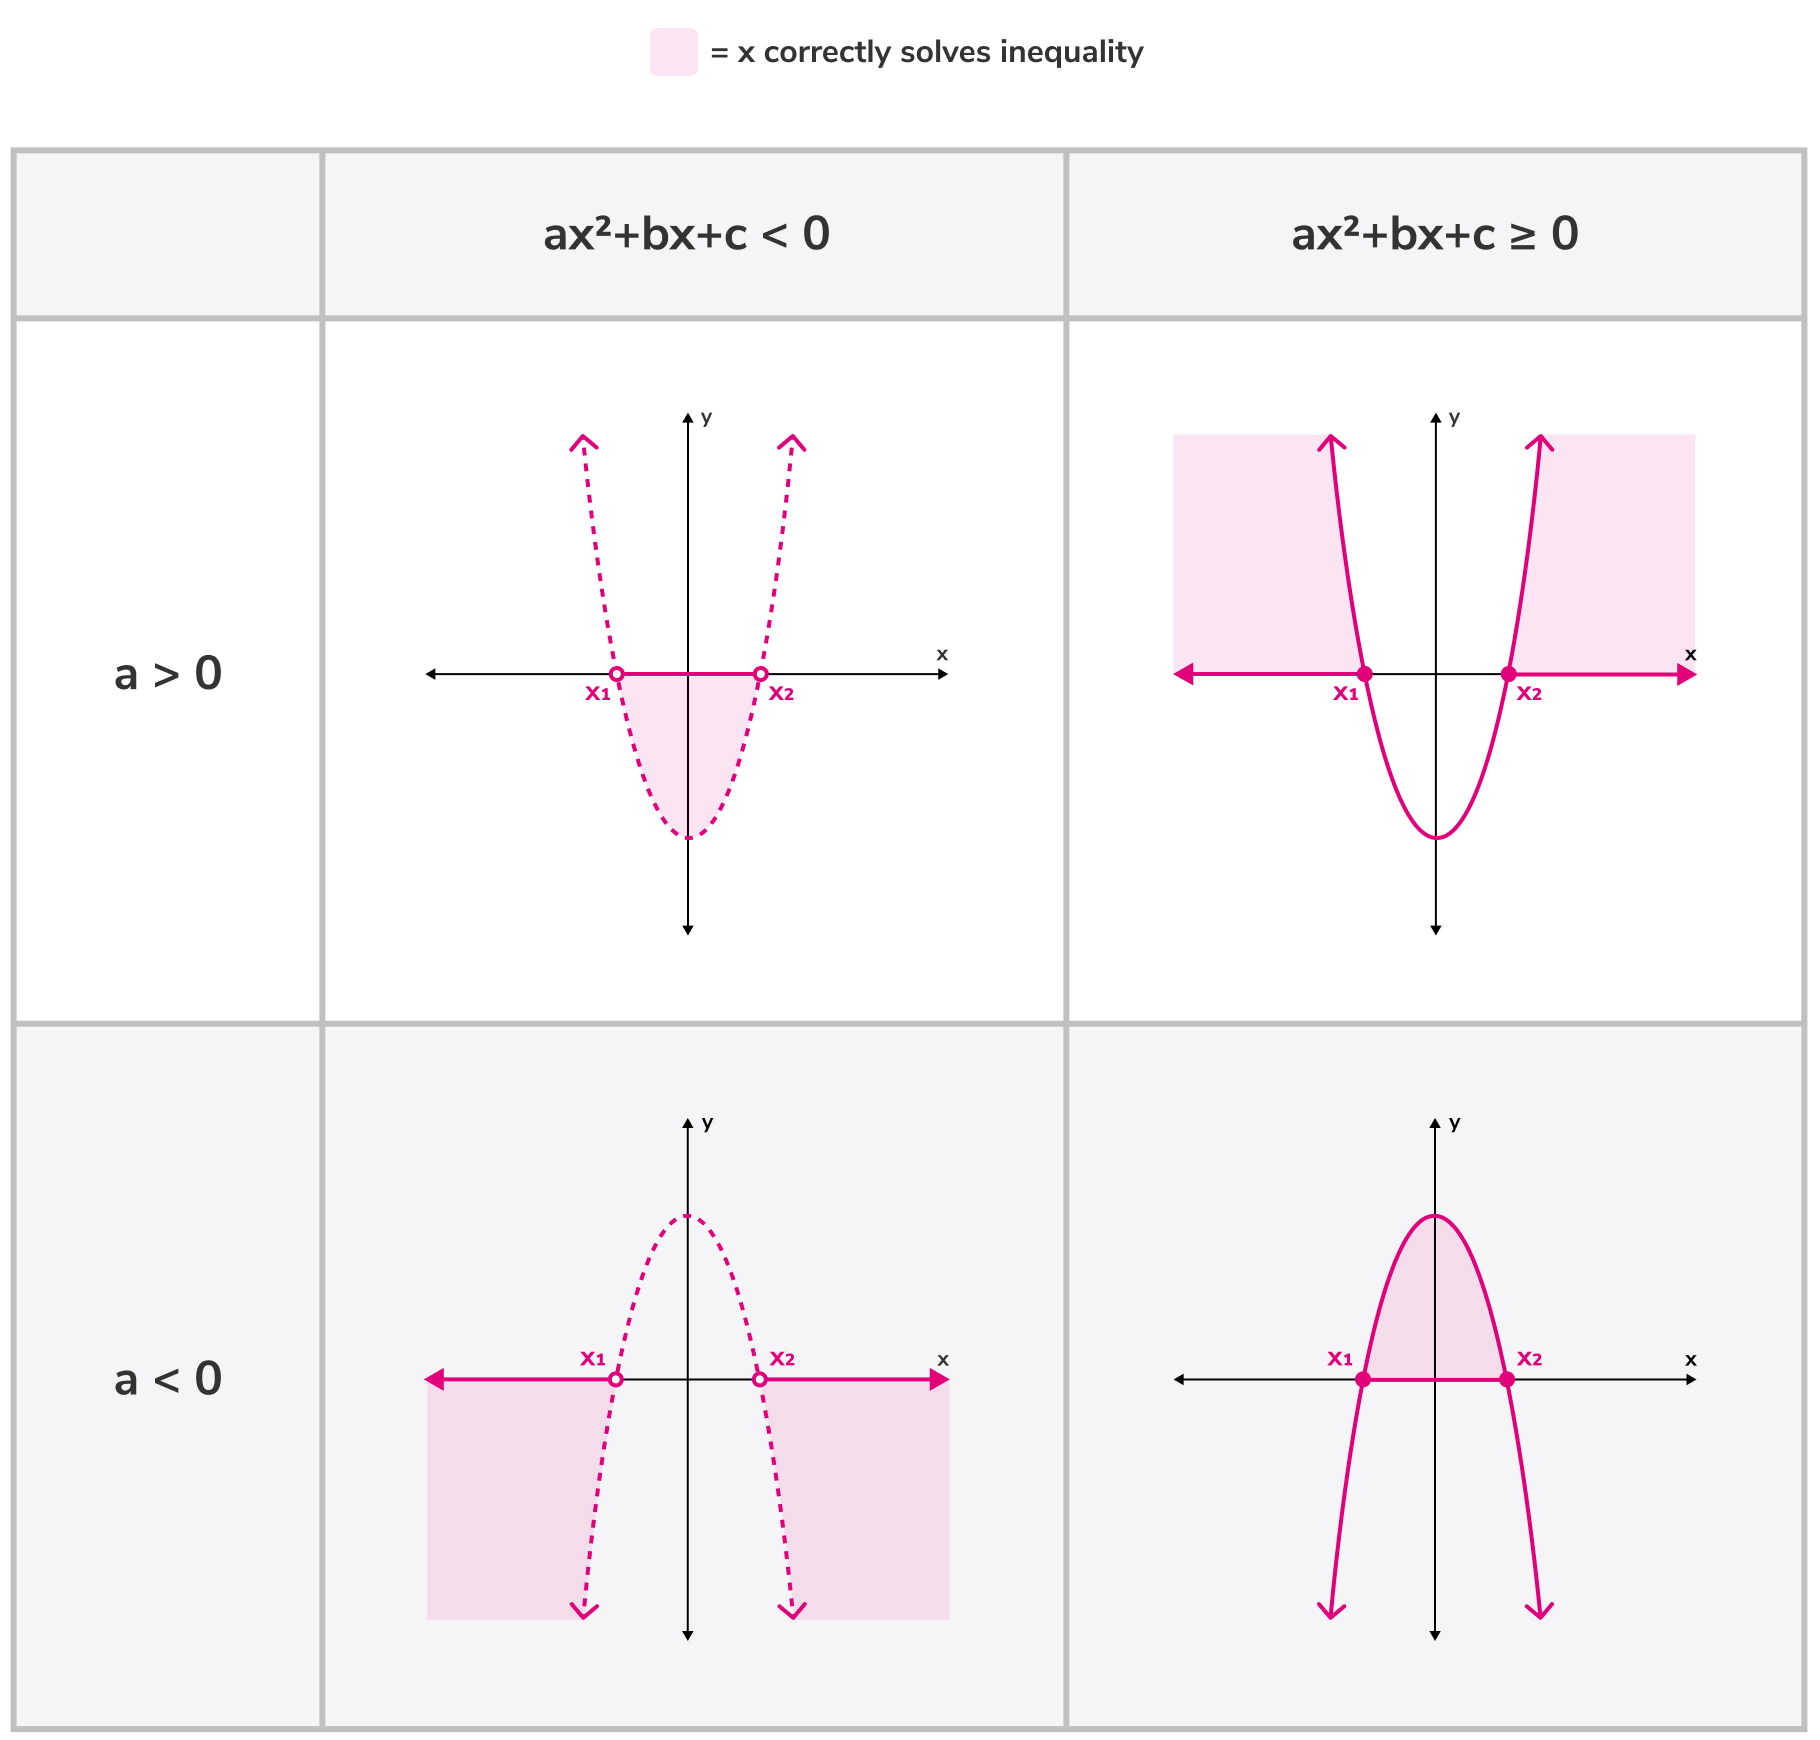
Quadratic Inequalities Graphically
For inequalities such as:
\( y > ax^2 + bx + c,\quad y \le px^2 + qx + r \)
- The boundary is the parabola \( y = ax^2 + bx + c \).
- Dotted curve for \( > \) or \( < \); solid curve for \( \ge \) or \( \le \).
- Shade above the parabola when \( y > \) or \( y \ge \).
- Shade below the parabola when \( y < \) or \( y \le \).
- Use the shape (opening up or down) to determine where regions lie.
Example
Represent the inequality \( y > x + 1 \) on a graph.
▶️ Answer / Explanation
Step 1: Draw the line \( y = x + 1 \) as a dotted line.
Step 2: Test a point (e.g., the origin): \( 0 > 1 \) is false, so the region containing the origin is not included.
Step 3: Shade the region above the line.
Graphical meaning: All points lying strictly above the line \( y = x + 1 \) satisfy the inequality.
Example
Represent the inequality \( y \le -2x + 4 \) on a graph.
▶️ Answer / Explanation
Step 1: Draw the boundary line \( y = -2x + 4 \) as a solid line because of \( \le \).
Step 2: Test a point such as \( (0,0) \): \( 0 \le 4 \) is true → the region below the line is included.
Step 3: Shade the region below the line.
Example
Represent the quadratic inequality \( y > x^2 – 4x + 1 \) on a graph.
▶️ Answer / Explanation
Step 1: Plot the parabola \( y = x^2 – 4x + 1 \). It opens upward.
Step 2: Use a dotted curve because the inequality is strict (\( > \)).
Step 3: Shade the region above the parabola.
Graphical meaning:
All points whose y-value is greater than the value on the parabola for that same x satisfy the inequality.