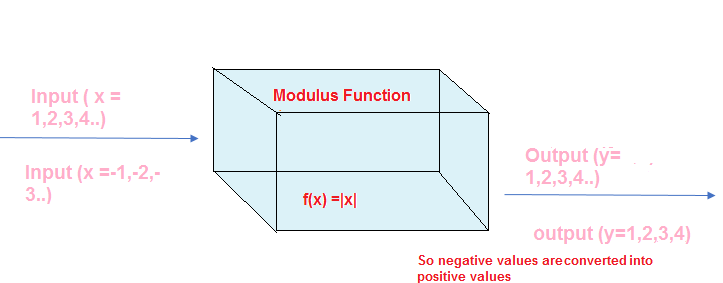
The Modulus Function
The modulus (or absolute value) of a real number represents its distance from zero on the number line.
For any real number \( x \):
\( |x| = \begin{cases} x, & x \ge 0 \\ -x, & x < 0 \end{cases} \)
This definition is the basis for all modulus graphs.
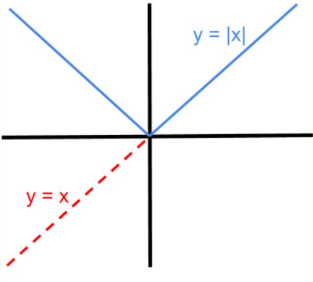
Graph of \( y = |x| \)
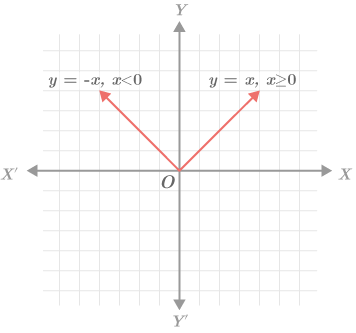
- V-shaped graph
- Vertex at \( (0,0) \)
- Symmetric about the y-axis
Graph of \( y = |ax + b| \)
The graph of \( y = |ax+b| \) is obtained by taking the graph of \( y = ax+b \) and reflecting any part below the x-axis above it.
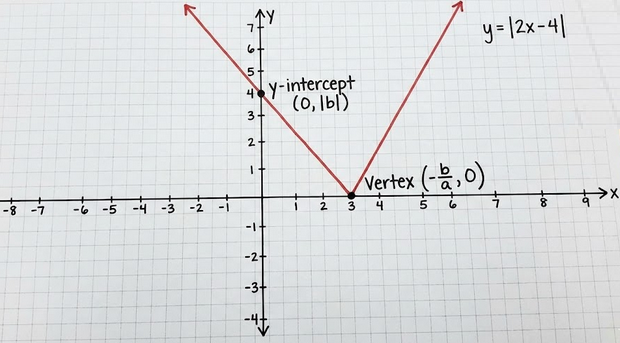
Key features:
- Vertex occurs where \( ax+b = 0 \)
- That is at \( x = -\dfrac{b}{a} \)
- The graph consists of two straight lines
Graph of \( y = |f(x)| \)
To sketch \( y = |f(x)| \) from the graph of \( y = f(x) \):
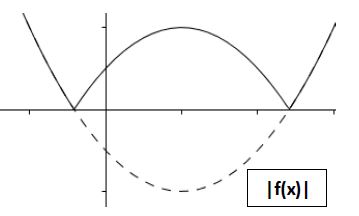
- Keep the parts of the graph where \( f(x) \ge 0 \) unchanged
- Reflect the parts where \( f(x) < 0 \) in the x-axis
The x-intercepts remain unchanged.
Graph of \( y = f(|x|) \)
To sketch \( y = f(|x|) \) from the graph of \( y = f(x) \):
- Take the part of the graph for \( x \ge 0 \)
- Reflect it in the y-axis
- The left-hand side is a mirror image of the right-hand side
The graph is always symmetric about the y-axis.
Solving Equations Using Modulus Graphs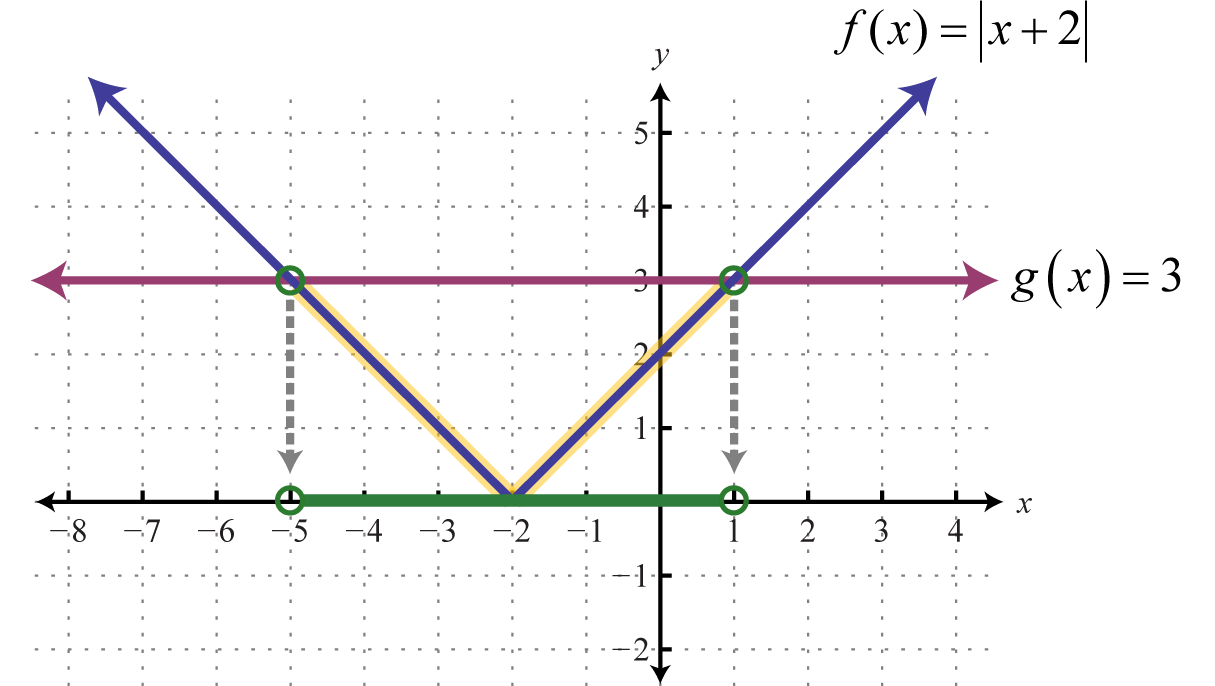
To solve an equation such as:
\( |f(x)| = g(x) \)
Method:
- Sketch the graph of \( y = |f(x)| \)
- Sketch the graph of \( y = g(x) \)
- Find the x-coordinates of intersection points
Solving Inequalities Using Modulus Graphs
For an inequality such as:
\( |f(x)| > g(x) \)
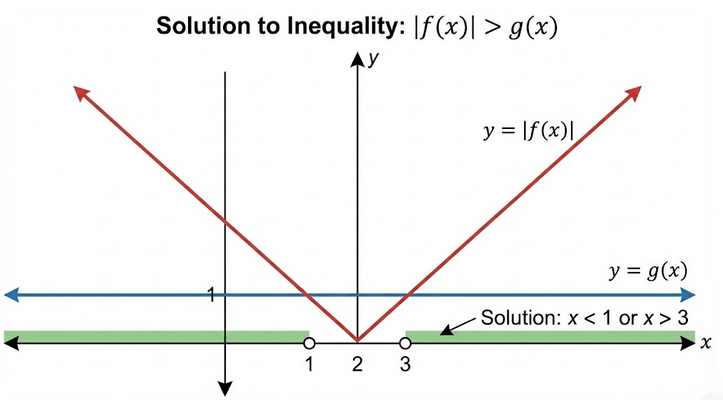
The solution corresponds to regions where the graph of \( y = |f(x)| \) lies above \( y = g(x) \).
Example
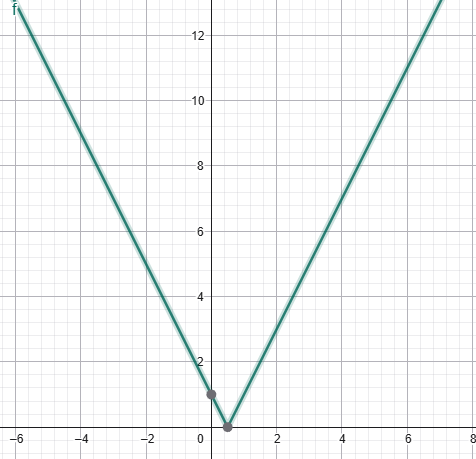
Sketch the graph of:
\( y = |2x – 1| \)
▶️ Answer / Explanation
Set \( 2x – 1 = 0 \Rightarrow x = \dfrac{1}{2} \).
The vertex is at \( \left(\dfrac{1}{2}, 0\right) \).
For \( x \ge \dfrac{1}{2} \), \( y = 2x – 1 \).
For \( x < \dfrac{1}{2} \), \( y = 1 – 2x \).
Example
Use the graph of \( y = |2x – 1| \) to solve:
\( |2x – 1| = x + 5 \)
▶️ Answer / Explanation
Solve algebraically by cases:
Case 1: \( 2x – 1 \ge 0 \)
\( 2x – 1 = x + 5 \Rightarrow x = 6 \)
Case 2: \( 2x – 1 < 0 \)
\( 1 – 2x = x + 5 \Rightarrow x = -\dfrac{4}{3} \)
Solutions:
\( x = 6 \) or \( x = -\dfrac{4}{3} \)
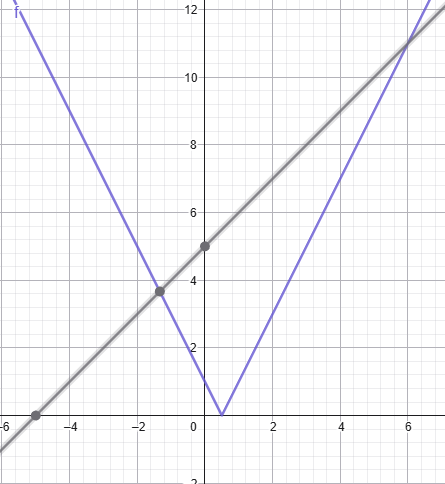
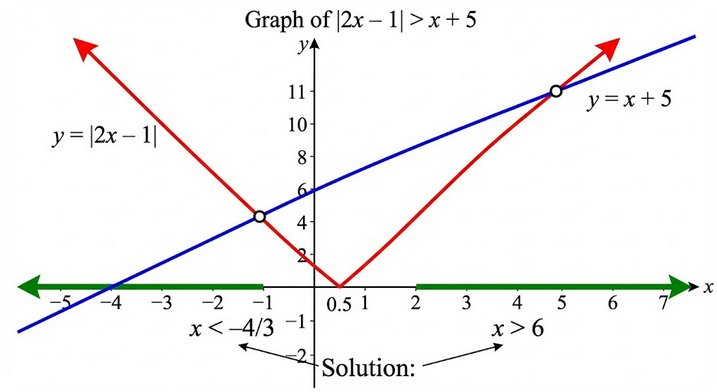
Example
Use the graph of \( y = |2x – 1| \) to solve:
\( |2x – 1| > x + 5 \)
▶️ Answer / Explanation
Find where:
\( |2x – 1| = x + 5 \)
From Example 2, intersections occur at:
\( x = -\dfrac{4}{3},\ 6 \)
Testing intervals shows:
\( x < -\dfrac{4}{3} \) or \( x > 6 \)
Solution:
\( x < -\dfrac{4}{3} \) or \( x > 6 \)