The Basic Ideas of Mathematical Modelling in Probability and Statistics
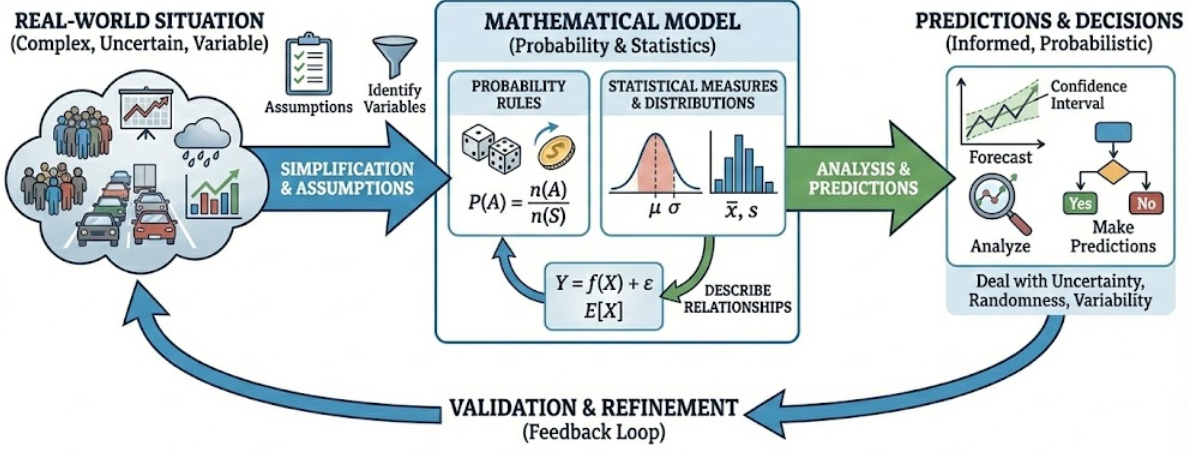
Mathematical modelling is the process of using mathematics to represent, analyse, and make predictions about real-world situations. In probability and statistics, modelling helps us deal with uncertainty, randomness, and variability in data.
A mathematical model simplifies a real situation by making reasonable assumptions, identifying relevant variables, and describing their relationships using probability rules, statistical measures, or distributions.
Stages of Mathematical Modelling
The modelling process typically follows these stages:
- Understanding the real-world problem
- Making simplifying assumptions
- Formulating a mathematical or statistical model
- Solving or analysing the model
- Interpreting results in context and refining the model if necessary
Mathematical Modelling in Probability
In probability, modelling involves representing random experiments using sample spaces, events, and probability rules. Assumptions such as equally likely outcomes or independence are often used to simplify the situation.
Common probability models include experiments involving coins, dice, cards, and simple random selections.
Mathematical Modelling in Statistics
In statistics, modelling focuses on using data to describe and make inferences about a population. Statistical models involve assumptions about data behaviour, such as randomness, distribution shape, and the absence of bias.
Statistical measures such as the mean, median, variance, and standard deviation are used to summarise data, while probability distributions are used to model variability.
Limitations of Mathematical Models
All models are approximations of reality. Results depend heavily on the assumptions made, and conclusions may be inaccurate if assumptions are unrealistic or data is unreliable.
Example :
A fair coin is tossed once. Describe a suitable probability model.
▶️ Answer/Explanation
The sample space is
\( S = \{H, T\} \)
Assuming the coin is fair, each outcome is equally likely.
\( P(H) = P(T) = \dfrac{1}{2} \)
This forms a simple probability model for the experiment.
Example :
A bag contains 3 red balls and 2 blue balls. One ball is selected at random. Construct a probability model.
▶️ Answer/Explanation
The total number of balls is 5.
\( P(\text{Red}) = \dfrac{3}{5} \)
\( P(\text{Blue}) = \dfrac{2}{5} \)
The model assumes each ball has an equal chance of being selected.
Example :
The heights of students in a class are recorded and the mean height is calculated. Explain how this forms part of a statistical model.
▶️ Answer/Explanation
The recorded data represents a sample from a larger population.
The mean height is used as a numerical summary to model the central tendency of the population.
This model assumes the sample is representative and that the mean is an appropriate measure.