Histograms
A histogram is a graphical representation of continuous data grouped into class intervals. It is commonly used in statistics to display the distribution of a data set and to identify patterns such as skewness, spread, and modal class.
Unlike bar charts, histograms have no gaps between bars, as the data is continuous.
Class Intervals and Frequencies
Data is grouped into class intervals of the form \( a \le x < b \). Each class has a corresponding frequency, which is the number of observations in that interval.

Frequency Density
When all class widths are equal, the height of each bar can represent frequency directly. However, when class widths are unequal, the vertical axis must represent frequency density.
\( \text{Frequency density} = \dfrac{\text{Frequency}}{\text{Class width}} \)
In a histogram, the area of each bar is proportional to the frequency of the class.
Key Features of Histograms
• The horizontal axis shows class intervals
• The vertical axis shows frequency or frequency density
• The tallest bar represents the modal class
• The overall shape shows the distribution of the data
Interpreting Histograms
Histograms can be used to estimate the median, quartiles, and the proportion of data within a given range by comparing areas of bars.
Example :
A class interval has width 5 and frequency 20. Find the frequency density.
▶️ Answer/Explanation
\( \text{Frequency density} = \dfrac{20}{5} = 4 \)
So the height of the bar representing this class is 4.
Example :
A histogram uses frequency density on the vertical axis. A class \( 10 \le x < 20 \) has frequency density 3. Find the frequency.
▶️ Answer/Explanation
The class width is
\( 20 – 10 = 10 \)
Frequency is given by
\( \text{Frequency} = 3 \times 10 = 30 \)
Example :
Explain why frequency density is used instead of frequency when class widths are unequal.
▶️ Answer/Explanation
If frequency alone were used, wider classes would appear to contain more data simply because they are wider.
Using frequency density ensures that the area of each bar represents the true frequency, allowing fair comparison between classes.
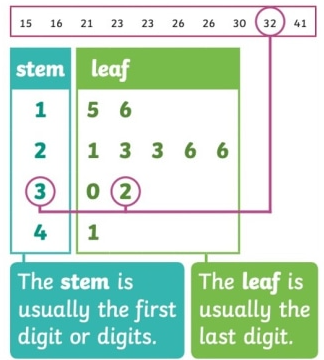
Stem-and-Leaf Diagrams
A stem-and-leaf diagram is a method of displaying numerical data that shows the distribution while retaining the original data values. It is particularly useful for small to moderate data sets.
Each data value is split into a stem (the leading digit or digits) and a leaf (the final digit).
Constructing a Stem-and-Leaf Diagram
To construct a stem-and-leaf diagram:
- Choose appropriate stems
- List the leaves in ascending order for each stem
- Include a key to explain the values
Key
A key is essential to show how the data values are represented.
Example key: \( 3 \mid 7 \) represents 37
Back-to-Back Stem-and-Leaf Diagrams
A back-to-back stem-and-leaf diagram is used to compare two related data sets using a common set of stems. One data set is written on the left of the stems and the other on the right.

Leaves on the left-hand side are written in descending order, while leaves on the right-hand side are written in ascending order.
Example :
The following data shows test scores: \( 32,\; 35,\; 37,\; 41,\; 44,\; 46,\; 48 \). Construct a stem-and-leaf diagram.
▶️ Answer/Explanation
Stems represent the tens digit.
3 | 2 5 7
4 | 1 4 6 8
Key: \( 3 \mid 2 \) represents 32
Example :
The data values are \( 14,\; 18,\; 22,\; 25,\; 27,\; 31 \). Find the median using a stem-and-leaf diagram.
▶️ Answer/Explanation
Stem-and-leaf diagram:
1 | 4 8
2 | 2 5 7
3 | 1
There are 6 values, so the median is the mean of the 3rd and 4th values:
\( \dfrac{22 + 25}{2} = 23.5 \)
Example 3:
The following back-to-back stem-and-leaf diagram compares the scores of two classes.
| Class A | Stem | Class B |
|---|---|---|
| 8 5 | 2 | 1 4 |
| 9 7 6 | 3 | 2 5 8 |
Explain one advantage of using a back-to-back stem-and-leaf diagram.
▶️ Answer/Explanation
It allows two related data sets to be compared easily using the same scale, making differences in distribution and central tendency clear.
Box-and-Whisker Plots (Box Plots)
A box-and-whisker plot, commonly called a box plot, is a graphical representation of numerical data based on the five-number summary. It is used to show the spread, central tendency, and skewness of a data set.
Five-Number Summary
A box plot is constructed using:
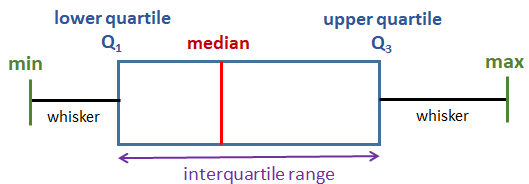
- Minimum value
- Lower quartile \( Q_1 \)
- Median
- Upper quartile \( Q_3 \)
- Maximum value
Interquartile Range
The interquartile range (IQR) measures the spread of the middle 50 percent of the data and is given by
\( \text{IQR} = Q_3 – Q_1 \)
Interpreting Box Plots
- The box represents the middle 50 percent of the data
- The median shows the central value
- Longer whiskers indicate greater spread
- The position of the median indicates skewness
Example :
The five-number summary of a data set is: Minimum \( = 4 \), \( Q_1 = 7 \), Median \( = 10 \), \( Q_3 = 15 \), Maximum \( = 18 \). State the interquartile range.
▶️ Answer/Explanation
\( \text{IQR} = 15 – 7 = 8 \)
So the interquartile range is 8.
Example :
The box plot of a data set has median closer to the lower quartile and a longer upper whisker. Describe the skewness of the data.
▶️ Answer/Explanation
The data is positively skewed, as the upper half of the data is more spread out than the lower half.
Example :
Two box plots represent the test scores of Class A and Class B. Explain how you would decide which class has more consistent results.
▶️ Answer/Explanation
The class with the smaller interquartile range has more consistent results, as its scores are less spread out.