Measures of Dispersion
Measures of dispersion describe how spread out the data values are about a measure of location. They provide information about the variability or consistency of a data set and are used together with measures of location to compare distributions.
Range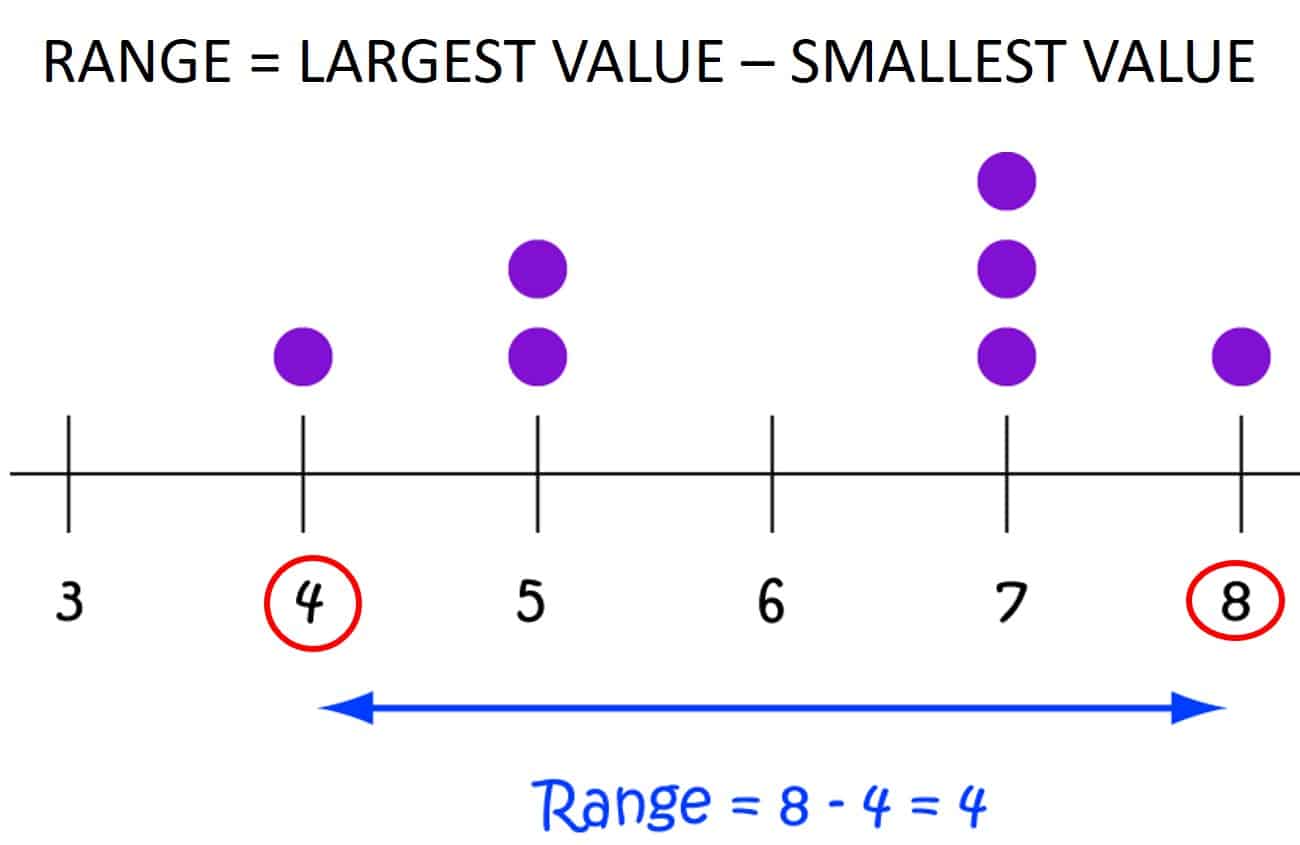
The range is the simplest measure of dispersion.
$\text{Range = largest value − smallest value}$
The range gives a quick indication of spread but is strongly affected by extreme values.
Interpercentile and Interquartile Range
An interpercentile range is the difference between two percentiles and measures the spread of the central part of the data.
$\text{Interpercentile range = upper percentile − lower percentile}$
A common example is the interquartile range (IQR):
$\text{IQR = upper quartile − lower quartile}$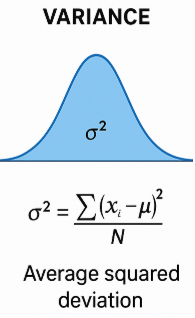
Interpercentile ranges are less affected by extreme values than the range.
Variance
The variance measures the average squared deviation from the mean.
For ungrouped data, the variance is given by
\( \text{variance} = \dfrac{1}{n}\sum (x – \bar{x})^2 \)
The variance is expressed in squared units, which makes direct interpretation difficult.
Standard Deviation
The standard deviation is the square root of the variance.
Standard deviation = \( \sqrt{\text{variance}} \)
The standard deviation is expressed in the same units as the data and is therefore easier to interpret.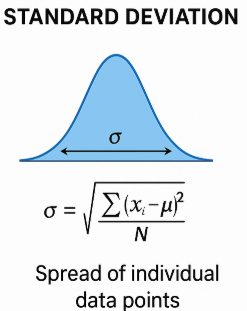
Simple Interpolation
When data are grouped, simple linear interpolation may be used to estimate quartiles or percentiles.
Interpolation assumes that the data are uniformly distributed within each class interval.
Interpretation of Measures of Location and Dispersion
Students are expected to:
- Compare data sets using both location and dispersion
- Comment on consistency using variance or standard deviation
- Explain the effect of extreme values
Formal significance tests are not required.
Example :
Two machines A and B produce components with the same mean length. Machine A has a standard deviation of 1.2 mm, while machine B has a standard deviation of 2.5 mm. Compare the consistency of the two machines.
▶️ Answer/Explanation
Both machines have the same mean, so the average length is the same.
Machine B has a larger standard deviation.
This indicates greater variation in the component lengths
Conclusion: Machine A is more consistent than machine B.
Example :
A data set has a range of 90 and an interquartile range of 22. What does this suggest about the distribution?
▶️ Answer/Explanation
The large range indicates that the extreme values are far apart.
The relatively smaller interquartile range shows that:
The middle 50% of the data is fairly tightly clustered
Conclusion: The data may contain extreme values, but most observations lie close together.
Example :
The lower quartile of a grouped data set is estimated as 42 and the upper quartile as 58 using interpolation. Explain what this information tells you about the data.
▶️ Answer/Explanation
The interquartile range is
\( 58 – 42 = 16 \)
This means that the middle 50% of the data lies between 42 and 58.
Conclusion: Most of the data values are concentrated within a range of 16 units, indicating moderate spread.